| Param | Original file | Final file |
|---|---|---|
| Filename | modeM0/AS1A05_072T02_9000002762_18590cztM0_level2.evt | modeM0/AS1A05_072T02_9000002762_18590cztM0_level2_quad_clean.evt |
| Size (bytes) | 429,857,280 | 64,388,160 |
| Size | 409.9 MB | 61.4 MB |
| Events in quadrant A | 2,535,961 | 400,378 |
| Events in quadrant B | 2,600,884 | 411,826 |
| Events in quadrant C | 4,387,502 | 362,883 |
| Events in quadrant D | 3,120,072 | 389,293 |
| Mode SS | |||
|---|---|---|---|
| Quadrant | BADHDUFLAG | Total packets | Discarded packets |
| A | 0 | 110 | 0 |
| B | 0 | 110 | 0 |
| C | 0 | 110 | 0 |
| D | 0 | 110 | 0 |
| Mode M0 | |||
|---|---|---|---|
| Quadrant | BADHDUFLAG | Total packets | Discarded packets |
| A | 0 | 11154 | 1 |
| B | 0 | 11246 | 1 |
| C | 0 | 16527 | 1 |
| D | 0 | 12835 | 1 |
| Quadrant | Total seconds | Saturated seconds | Saturation percentage |
|---|---|---|---|
| A | 5499 | 8 | 0.145481% |
| B | 5499 | 7 | 0.127296% |
| C | 5499 | 607 | 11.038371% |
| D | 5499 | 43 | 0.781960% |
Noise dominated data is calculated using 1-second bins in cleaned event files. If a bin has >2000 counts, and if more than 50% of those come from <1% of pixels, then it is considered to be noise-dominated and hence unusable.
| Quadrant | # 1 sec bins | Bins with >0 counts | Bins with >2000 counts | High rate bins dominated by noise | Noise dominated (total time) | Noise dominated (detector-on time) | Marked lightcurve |
|---|---|---|---|---|---|---|---|
| A | 5499 | 5499 | 2 | 2 | 0.04% | 0.04% | 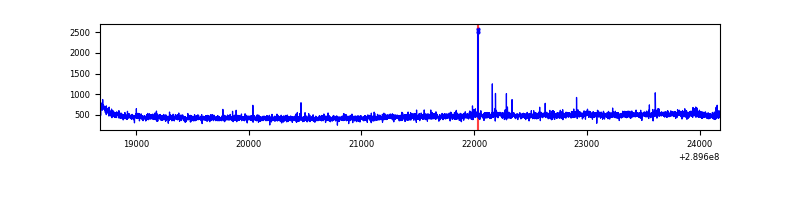 |
| B | 5499 | 5499 | 3 | 3 | 0.05% | 0.05% | 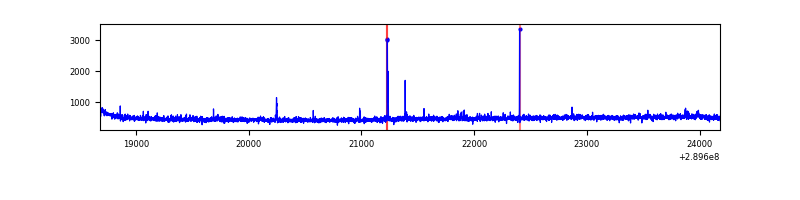 |
| C | 5499 | 5499 | 448 | 448 | 8.15% | 8.15% | 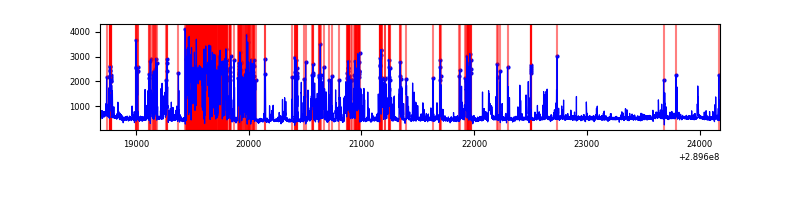 |
| D | 5499 | 5499 | 44 | 44 | 0.80% | 0.80% | 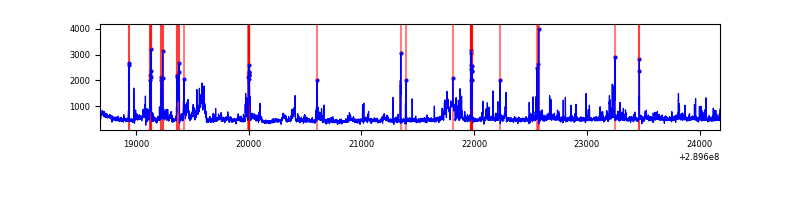 |
Top three noisy pixels from each quadrant. If the there are fewer than three noisy pixels in the level2.evt file, extra rows are filled as -1
| Pixel properties | Quadrant properties | ||||||
|---|---|---|---|---|---|---|---|
| Quadrant | DetID | PixID | Counts | Sigma | Mean | Median | Sigma |
| A | 14 | 111 | 20066 | 145.86 | 651 | 638 | 133.2 |
| A | 13 | 254 | 8664 | 60.26 | 651 | 638 | 133.2 |
| A | 0 | 226 | 5693 | 37.95 | 651 | 638 | 133.2 |
| B | 3 | 64 | 17336 | 131.67 | 652 | 635 | 126.8 |
| B | 12 | 111 | 15240 | 115.15 | 652 | 635 | 126.8 |
| B | 11 | 111 | 13437 | 100.93 | 652 | 635 | 126.8 |
| C | 4 | 254 | 1861222 | 13143.64 | 600 | 603 | 141.6 |
| C | 14 | 238 | 91822 | 644.38 | 600 | 603 | 141.6 |
| C | 9 | 54 | 88732 | 622.55 | 600 | 603 | 141.6 |
| D | 1 | 52 | 615988 | 3925.21 | 636 | 615 | 156.8 |
| D | 5 | 222 | 50390 | 317.49 | 636 | 615 | 156.8 |
| D | 15 | 145 | 25446 | 158.39 | 636 | 615 | 156.8 |
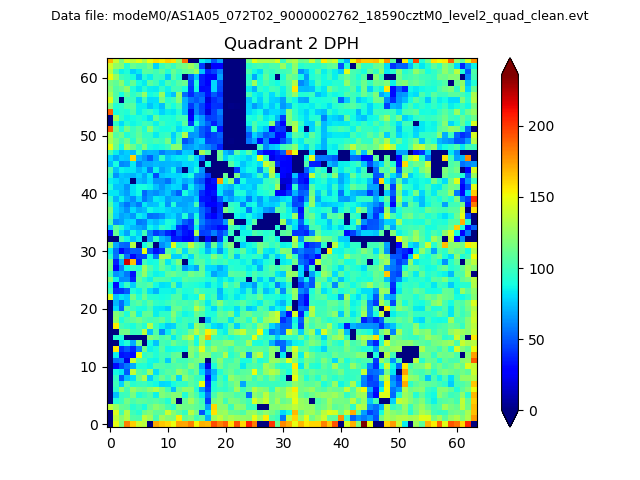
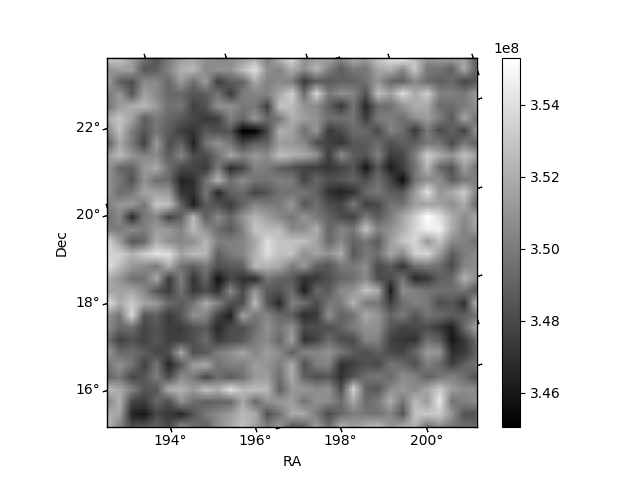
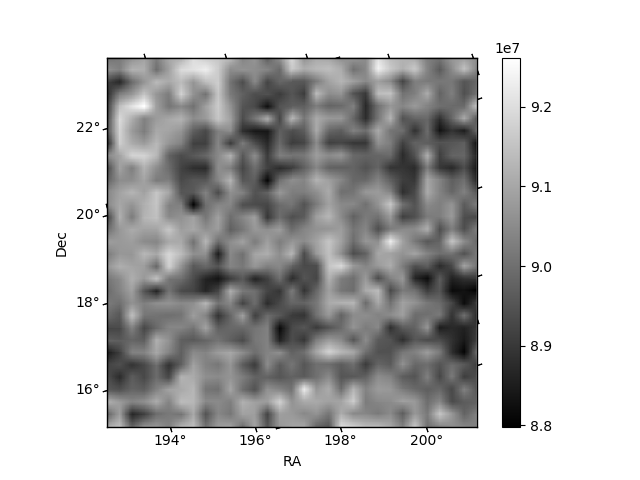
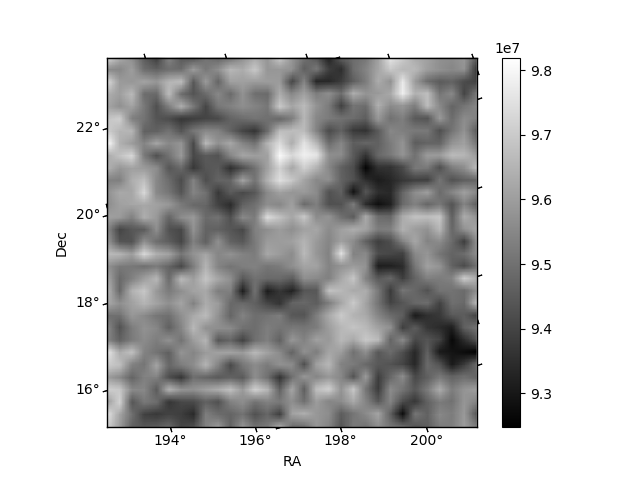
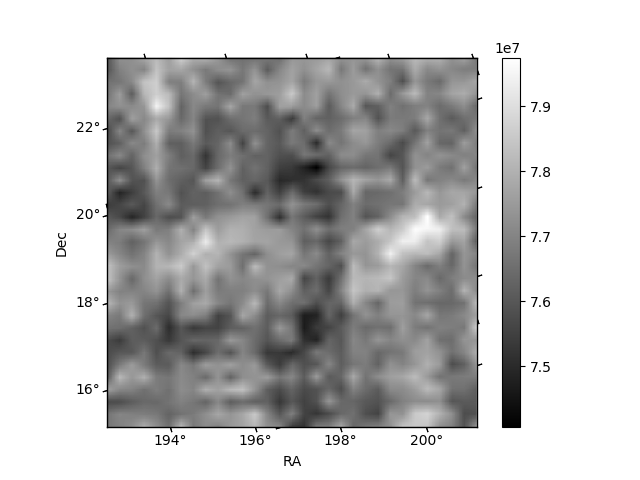
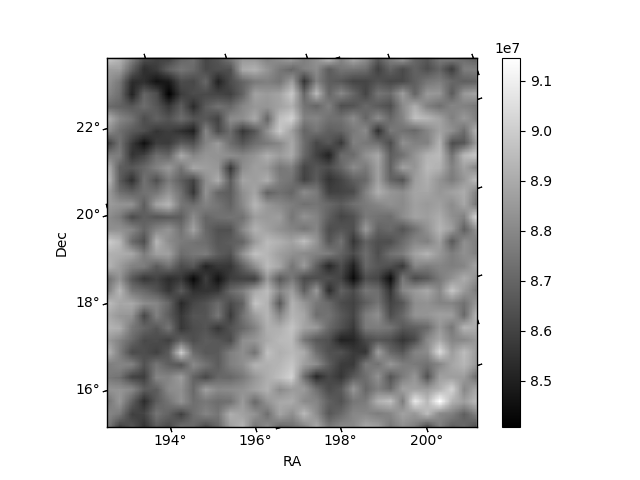
Histogram calculated using DETX and DETY for each event in the final _common_clean file
| Quadrant A | 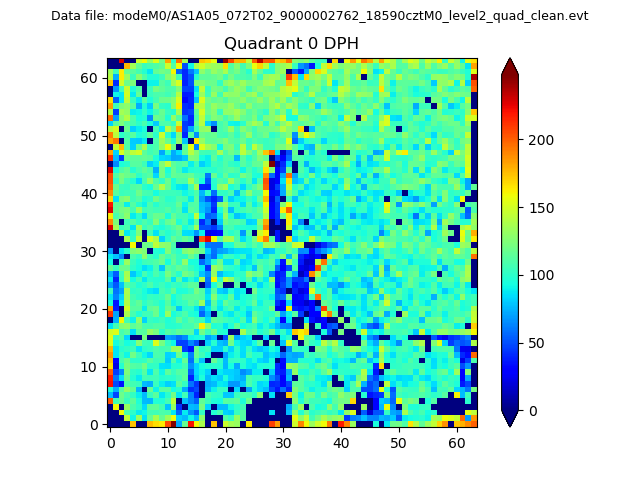 |
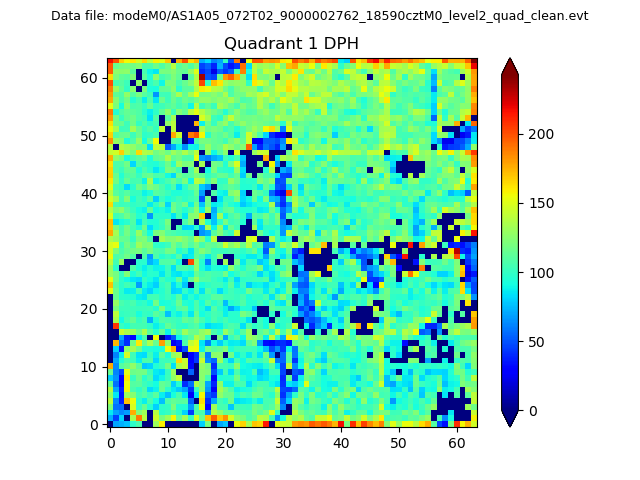 |
Quadrant B |
|---|---|---|---|
| Quadrant D | 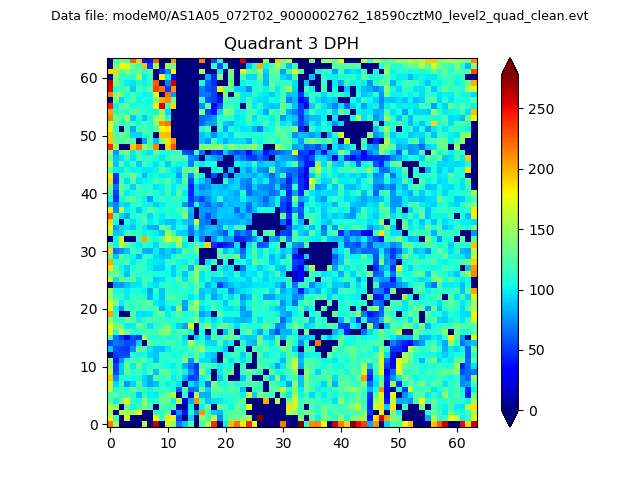 |
 |
Quadrant C |
| Plot type | Count rate plots | Images |
|---|---|---|
| Comparison with Poisson distribution Blue bars denote a histogram of data divided into 1 sec bins. Red curve is a Poisson curve with rate = median count rate of data. |
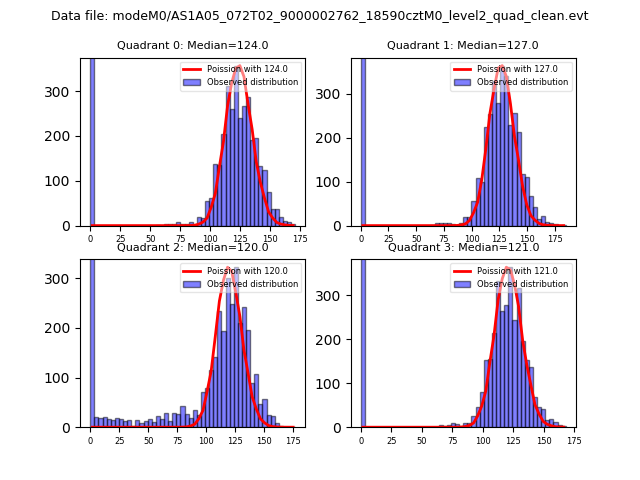 |
 |
| Quadrant-wise count rates Data is divided into 100 sec bins |
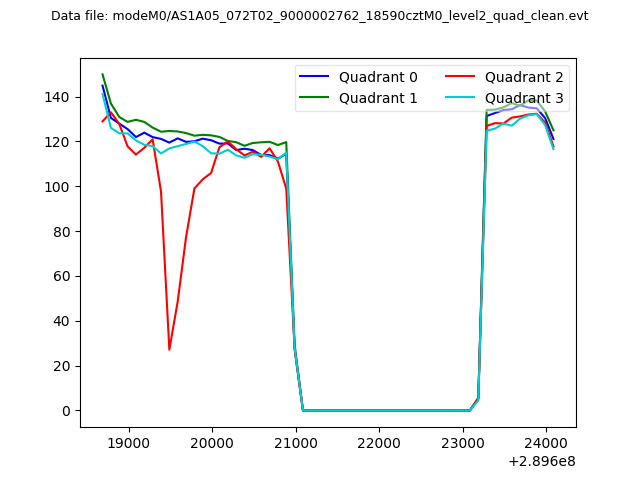 |
|
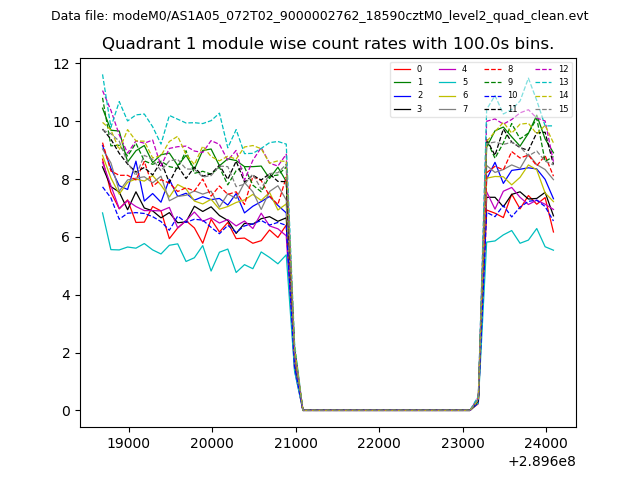
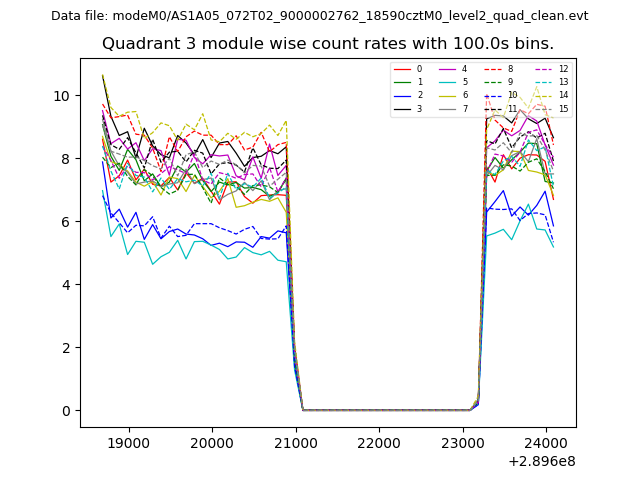
| Module-wise count rates for Quadrant A Data is divided into 100 sec bins |
 |
 |
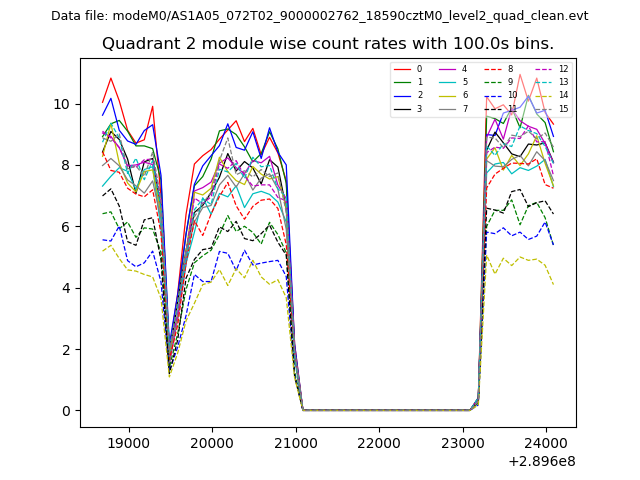
| Module-wise count rates for Quadrant B Data is divided into 100 sec bins |
 |
 |
| Module-wise count rates for Quadrant C Data is divided into 100 sec bins |
 |
 |
| Module-wise count rates for Quadrant D Data is divided into 100 sec bins |
 |
 |
| Parameter | Plot |
|---|---|
| CZT HV Monitor | 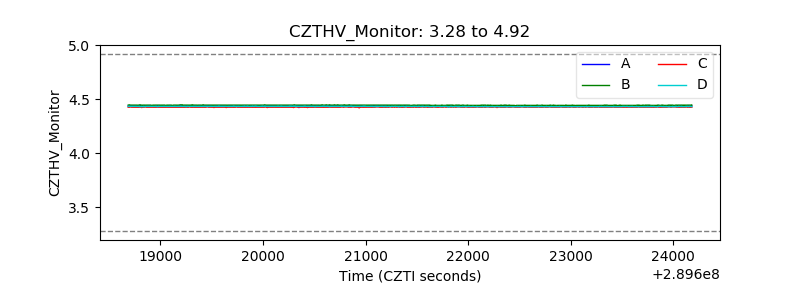 |
| D_VDD | 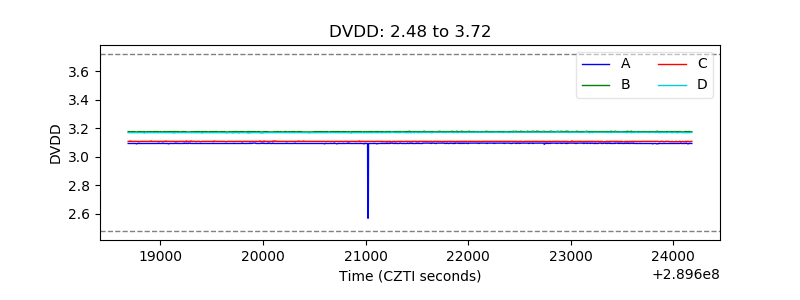 |
| Temperature 1 | 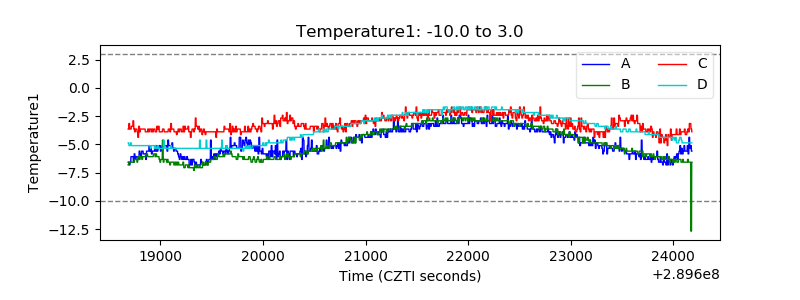 |
| Veto HV Monitor | 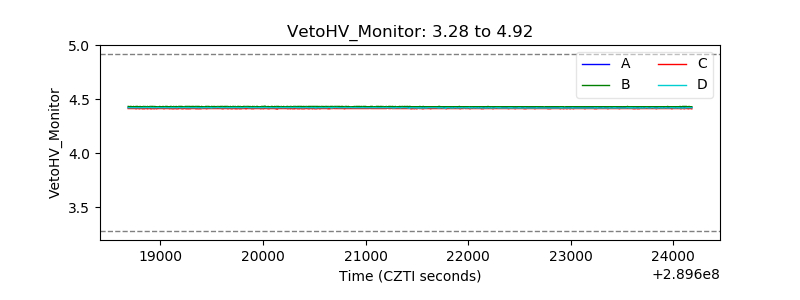 |
| Veto LLD | 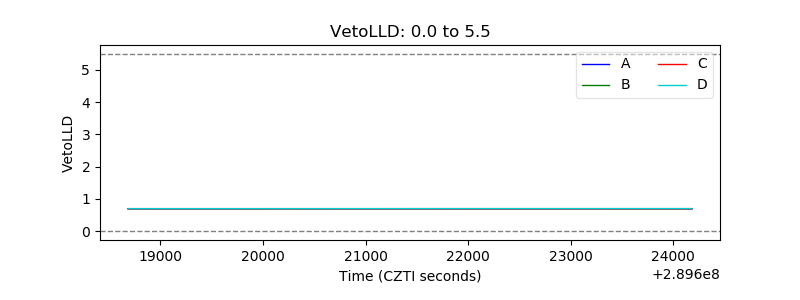 |
| Alpha Counter | 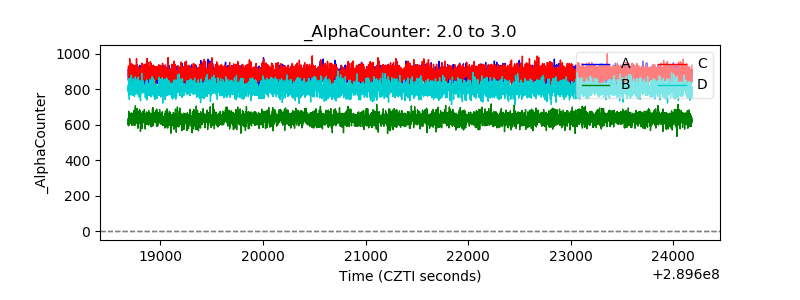 |
| _CPM_Rate | 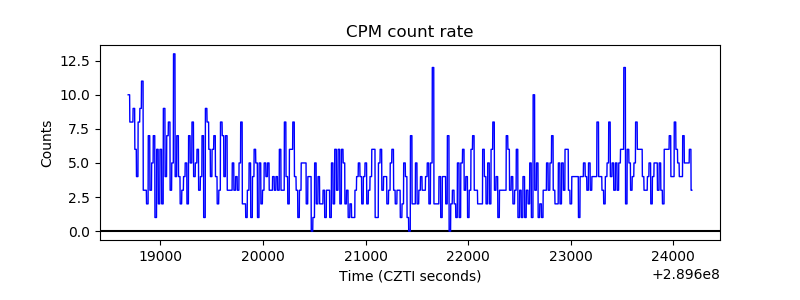 |
| CZT Counter | 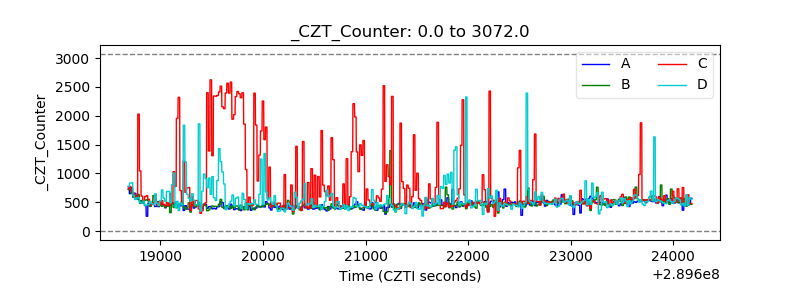 |
| +2.5 Volts monitor |  |
| +5 Volts monitor |  |
| _ROLL_ROT | 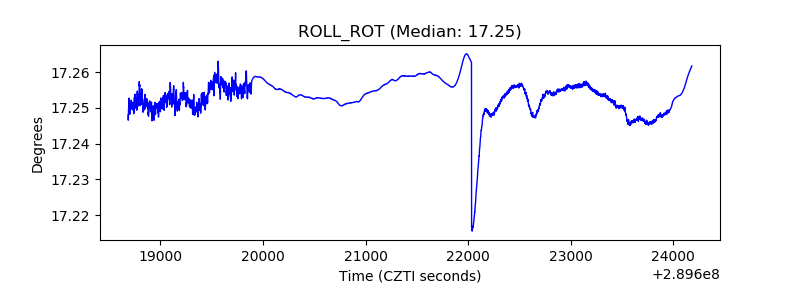 |
| _Roll_DEC | 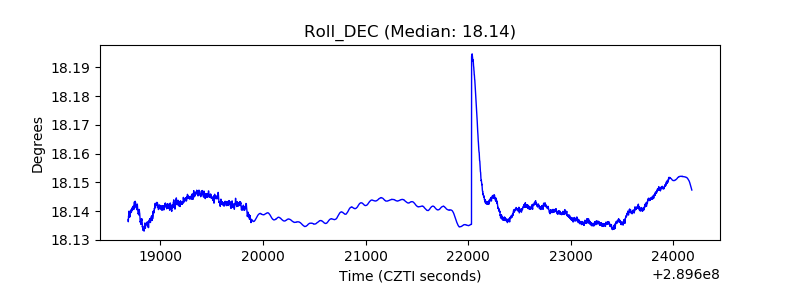 |
| _Roll_RA | 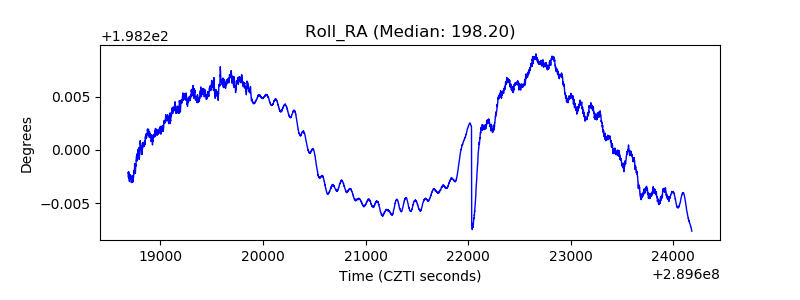 |
| Veto Counter |  |