| Param | Original file | Final file |
|---|---|---|
| Filename | modeM0/AS1A05_072T02_9000002762_18594cztM0_level2.evt | modeM0/AS1A05_072T02_9000002762_18594cztM0_level2_quad_clean.evt |
| Size (bytes) | 819,011,520 | 119,911,680 |
| Size | 781.1 MB | 114.4 MB |
| Events in quadrant A | 4,898,732 | 740,427 |
| Events in quadrant B | 5,028,625 | 764,088 |
| Events in quadrant C | 6,826,324 | 703,919 |
| Events in quadrant D | 7,339,152 | 694,874 |
| Mode SS | |||
|---|---|---|---|
| Quadrant | BADHDUFLAG | Total packets | Discarded packets |
| A | 0 | 212 | 0 |
| B | 0 | 212 | 0 |
| C | 0 | 212 | 0 |
| D | 0 | 212 | 0 |
| Mode M9 | |||
|---|---|---|---|
| Quadrant | BADHDUFLAG | Total packets | Discarded packets |
| A | 0 | 3 | 0 |
| B | 0 | 3 | 0 |
| C | 0 | 3 | 0 |
| D | 0 | 3 | 0 |
| Mode M0 | |||
|---|---|---|---|
| Quadrant | BADHDUFLAG | Total packets | Discarded packets |
| A | 0 | 21449 | 1 |
| B | 0 | 21713 | 1 |
| C | 0 | 26968 | 1 |
| D | 0 | 28662 | 1 |
| Quadrant | Total seconds | Saturated seconds | Saturation percentage |
|---|---|---|---|
| A | 10507 | 37 | 0.352146% |
| B | 10507 | 54 | 0.513943% |
| C | 10507 | 684 | 6.509946% |
| D | 10508 | 499 | 4.748763% |
Noise dominated data is calculated using 1-second bins in cleaned event files. If a bin has >2000 counts, and if more than 50% of those come from <1% of pixels, then it is considered to be noise-dominated and hence unusable.
| Quadrant | # 1 sec bins | Bins with >0 counts | Bins with >2000 counts | High rate bins dominated by noise | Noise dominated (total time) | Noise dominated (detector-on time) | Marked lightcurve |
|---|---|---|---|---|---|---|---|
| A | 10812 | 10508 | 2 | 2 | 0.02% | 0.02% |  |
| B | 10812 | 10507 | 3 | 3 | 0.03% | 0.03% |  |
| C | 10812 | 10507 | 450 | 450 | 4.16% | 4.28% |  |
| D | 10813 | 10509 | 459 | 459 | 4.24% | 4.37% |  |
Top three noisy pixels from each quadrant. If the there are fewer than three noisy pixels in the level2.evt file, extra rows are filled as -1
| Pixel properties | Quadrant properties | ||||||
|---|---|---|---|---|---|---|---|
| Quadrant | DetID | PixID | Counts | Sigma | Mean | Median | Sigma |
| A | 14 | 111 | 23122 | 85.48 | 1263 | 1234 | 256.1 |
| A | 13 | 254 | 16695 | 60.38 | 1263 | 1234 | 256.1 |
| A | 0 | 226 | 11015 | 38.19 | 1263 | 1234 | 256.1 |
| B | 0 | 230 | 41325 | 163.05 | 1263 | 1230 | 245.9 |
| B | 12 | 111 | 29694 | 115.75 | 1263 | 1230 | 245.9 |
| B | 11 | 111 | 26106 | 101.16 | 1263 | 1230 | 245.9 |
| C | 4 | 254 | 1914079 | 6848.73 | 1188 | 1195 | 279.3 |
| C | 14 | 238 | 182756 | 650.05 | 1188 | 1195 | 279.3 |
| C | 9 | 54 | 92788 | 327.93 | 1188 | 1195 | 279.3 |
| D | 1 | 52 | 2350280 | 7982.09 | 1208 | 1170 | 294.3 |
| D | 7 | 238 | 297426 | 1006.65 | 1208 | 1170 | 294.3 |
| D | 5 | 222 | 81026 | 271.34 | 1208 | 1170 | 294.3 |
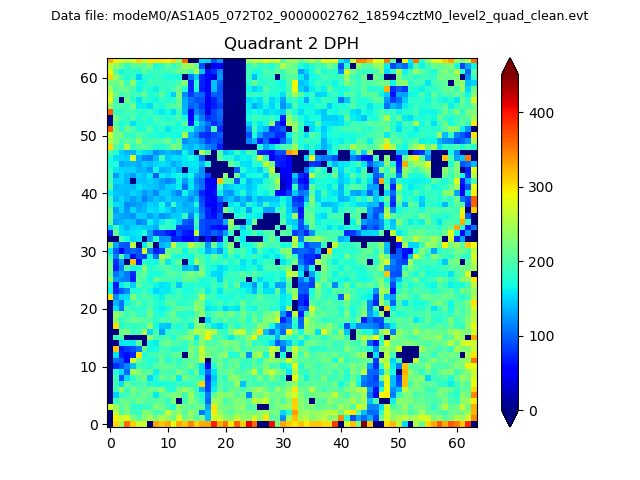
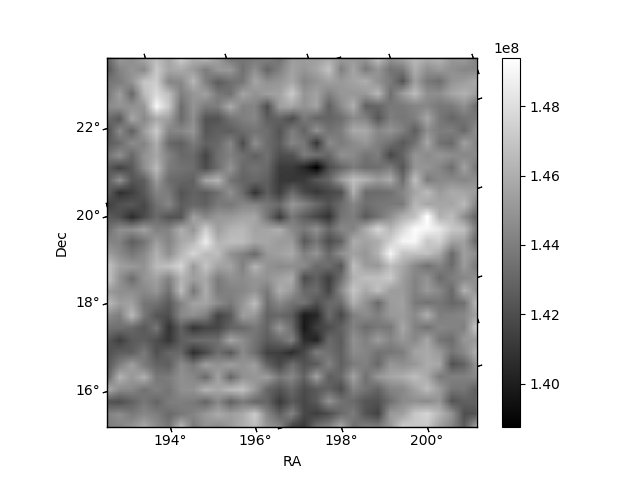
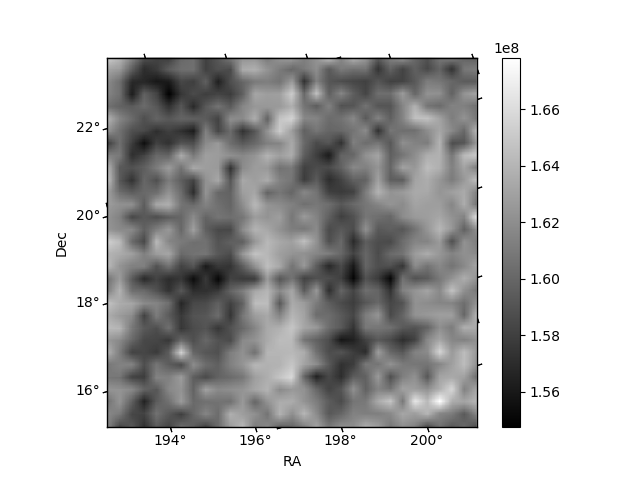
Histogram calculated using DETX and DETY for each event in the final _common_clean file
| Quadrant A | 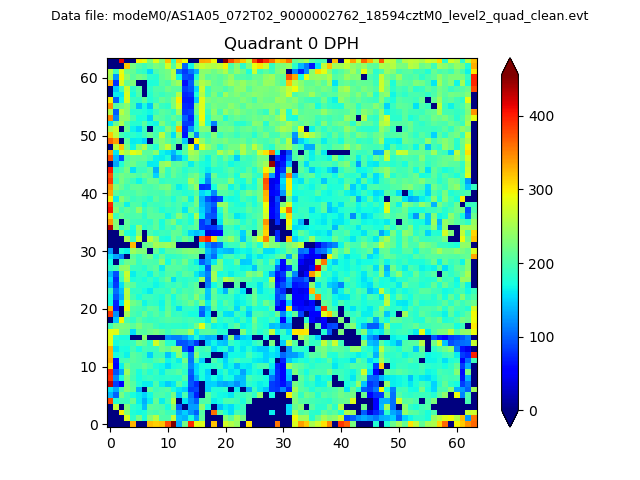 |
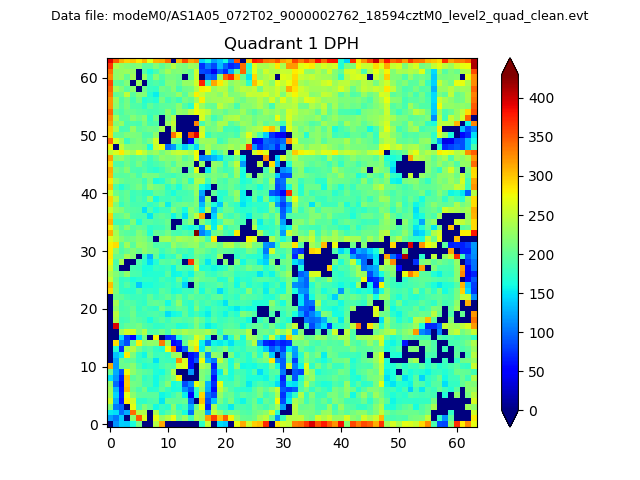 |
Quadrant B |
|---|---|---|---|
| Quadrant D | 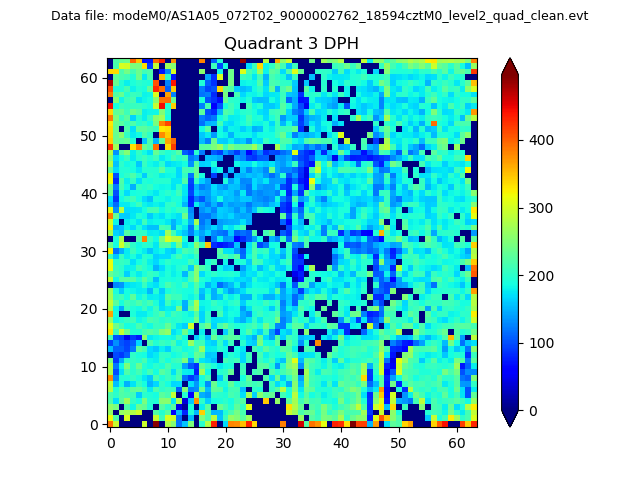 |
 |
Quadrant C |
| Plot type | Count rate plots | Images |
|---|---|---|
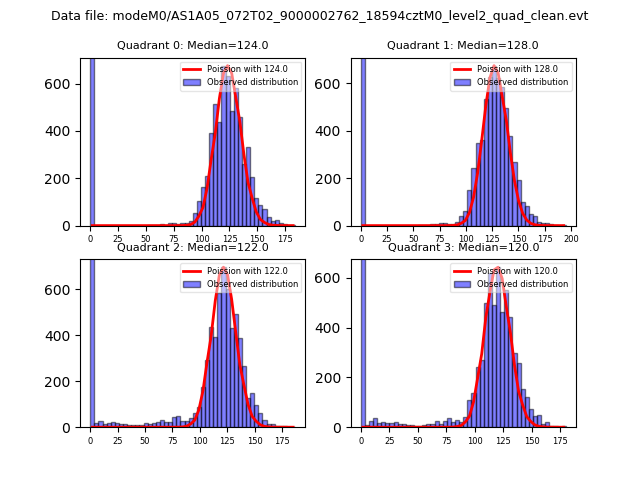
| Comparison with Poisson distribution Blue bars denote a histogram of data divided into 1 sec bins. Red curve is a Poisson curve with rate = median count rate of data. |
 |
 |
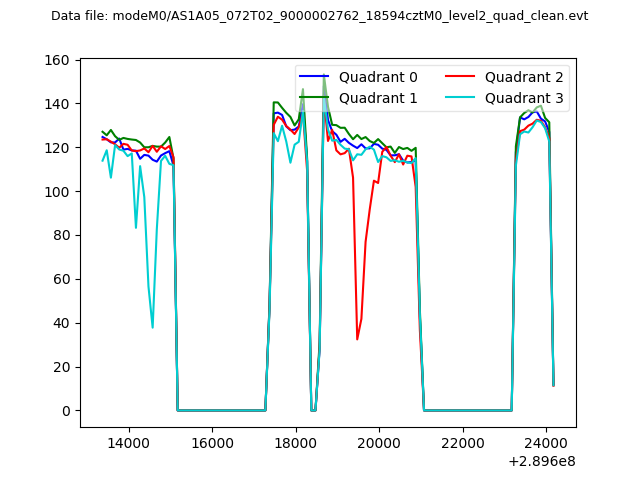
| Quadrant-wise count rates Data is divided into 100 sec bins |
 |
|
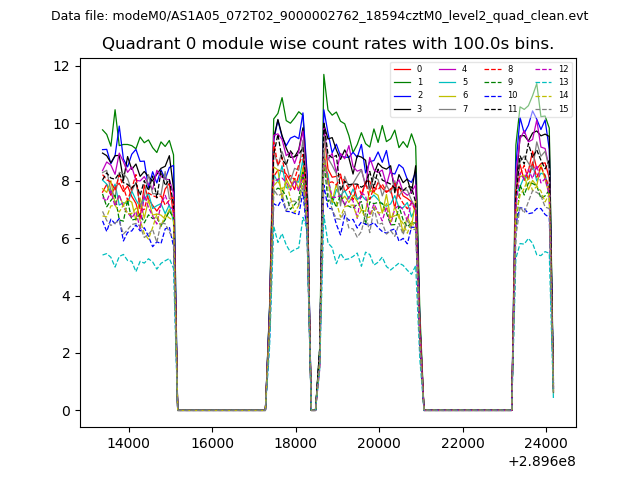
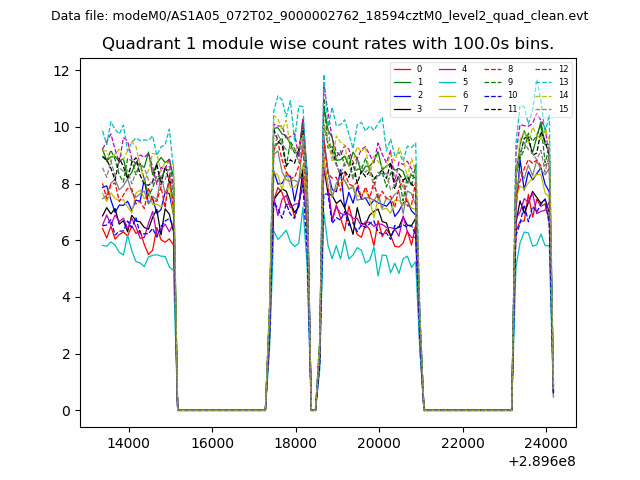
| Module-wise count rates for Quadrant A Data is divided into 100 sec bins |
 |
 |
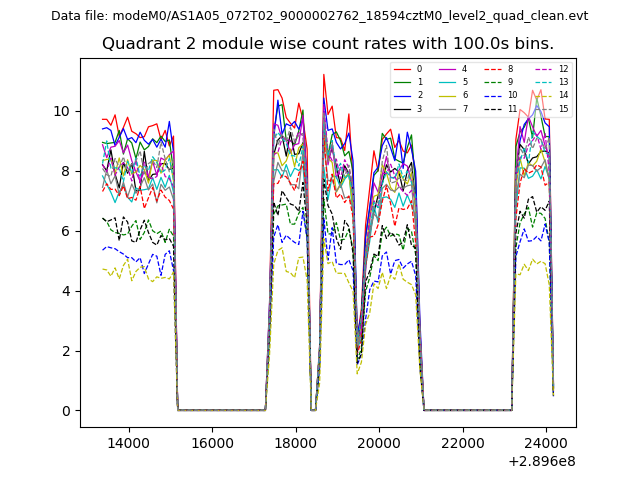
| Module-wise count rates for Quadrant B Data is divided into 100 sec bins |
 |
 |
| Module-wise count rates for Quadrant C Data is divided into 100 sec bins |
 |
 |
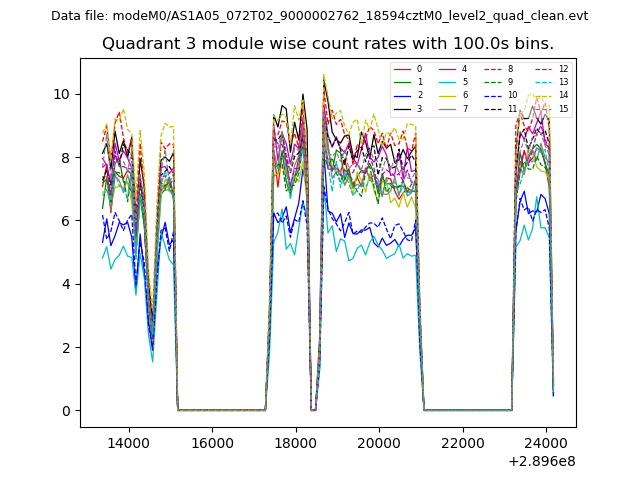
| Module-wise count rates for Quadrant D Data is divided into 100 sec bins |
 |
 |
| Parameter | Plot |
|---|---|
| CZT HV Monitor | 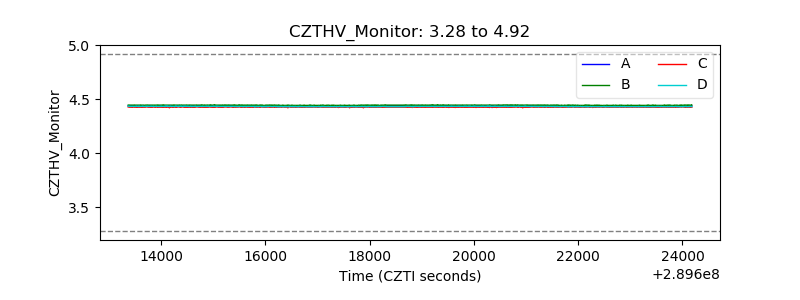 |
| D_VDD | 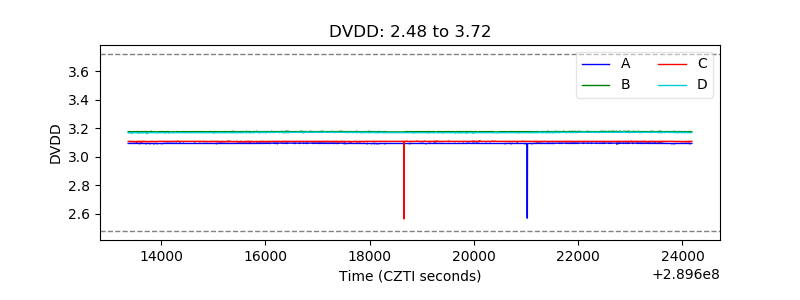 |
| Temperature 1 | 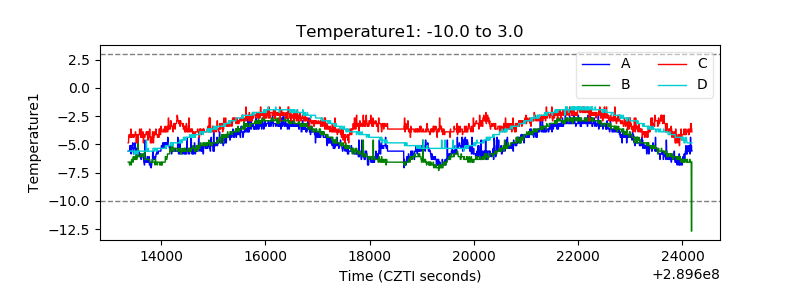 |
| Veto HV Monitor | 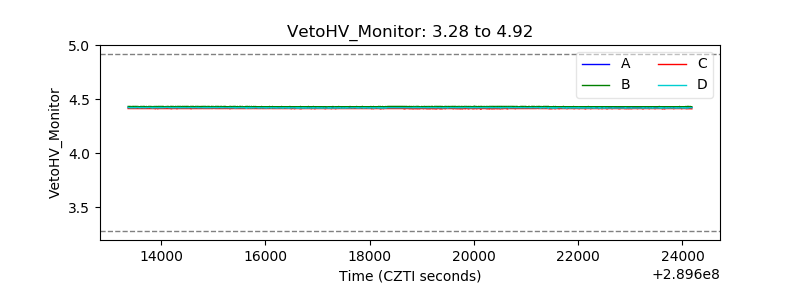 |
| Veto LLD | 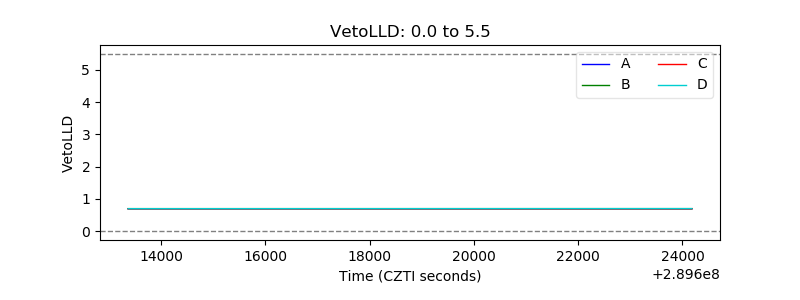 |
| Alpha Counter | 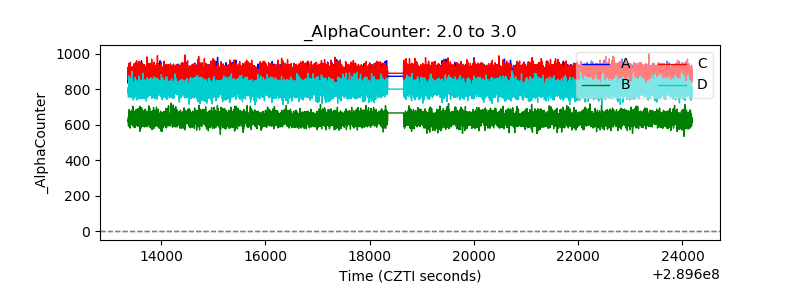 |
| _CPM_Rate | 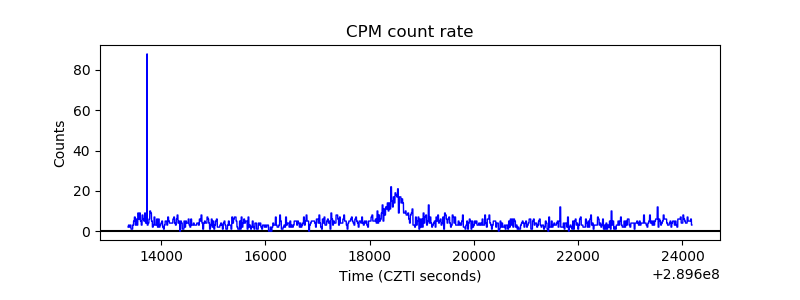 |
| CZT Counter | 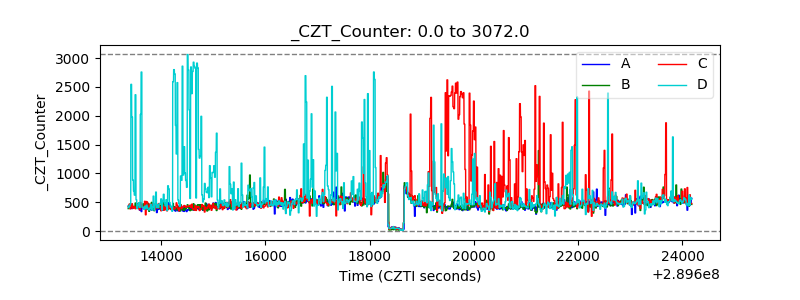 |
| +2.5 Volts monitor |  |
| +5 Volts monitor | 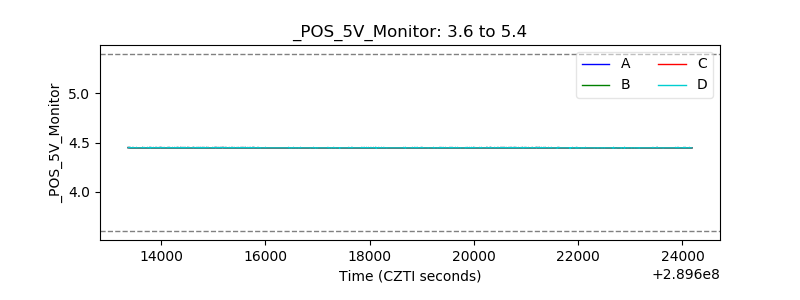 |
| _ROLL_ROT | 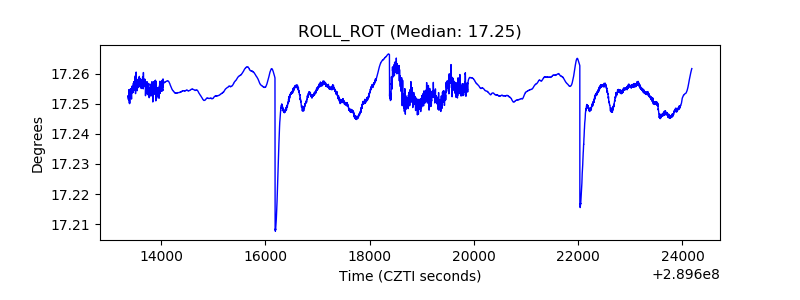 |
| _Roll_DEC | 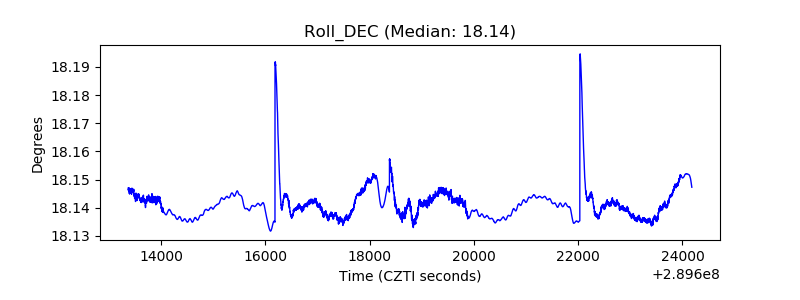 |
| _Roll_RA | 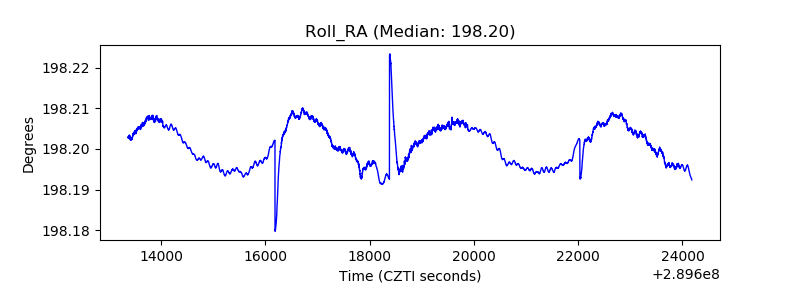 |
| Veto Counter | 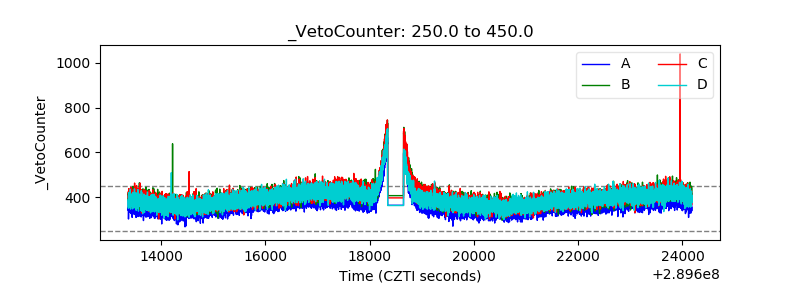 |