| Param | Original file | Final file |
|---|---|---|
| Filename | modeM0/AS1A05_075T01_9000002768cztM0_level2.fits | modeM0/AS1A05_075T01_9000002768cztM0_level2_quad_clean.evt |
| Size (bytes) | 138,251,520 | 99,152,640 |
| Size | 131.8 MB | 94.6 MB |
| Events in quadrant A | 849,468 | 530,560 |
| Events in quadrant B | 826,650 | 539,801 |
| Events in quadrant C | 851,530 | 527,405 |
| Events in quadrant D | 736,430 | 481,005 |
| Mode SS | |||
|---|---|---|---|
| Quadrant | BADHDUFLAG | Total packets | Discarded packets |
| A | 0 | 276 | 0 |
| B | 0 | 276 | 0 |
| C | 0 | 276 | 0 |
| D | 0 | 276 | 0 |
| Mode M0 | |||
|---|---|---|---|
| Quadrant | BADHDUFLAG | Total packets | Discarded packets |
| A | 0 | 28019 | 0 |
| B | 0 | 28318 | 0 |
| C | 0 | 28995 | 0 |
| D | 0 | 33896 | 0 |
| Mode M9 | |||
|---|---|---|---|
| Quadrant | BADHDUFLAG | Total packets | Discarded packets |
| A | 0 | 36 | 0 |
| B | 0 | 36 | 0 |
| C | 0 | 36 | 0 |
| D | 0 | 36 | 0 |
| Quadrant | Total seconds | Saturated seconds | Saturation percentage |
|---|---|---|---|
| A | 13357 | 121 | 0.905892% |
| B | 13357 | 198 | 1.482369% |
| C | 13357 | 244 | 1.826758% |
| D | 13357 | 465 | 3.481321% |
Noise dominated data is calculated using 1-second bins in cleaned event files. If a bin has >2000 counts, and if more than 50% of those come from <1% of pixels, then it is considered to be noise-dominated and hence unusable.
| Quadrant | # 1 sec bins | Bins with >0 counts | Bins with >2000 counts | High rate bins dominated by noise | Noise dominated (total time) | Noise dominated (detector-on time) | Marked lightcurve |
|---|---|---|---|---|---|---|---|
| A | 16952 | 13356 | 0 | 0 | 0.00% | 0.00% |  |
| B | 16952 | 13357 | 0 | 0 | 0.00% | 0.00% |  |
| C | 16952 | 13356 | 0 | 0 | 0.00% | 0.00% |  |
| D | 16952 | 13353 | 0 | 0 | 0.00% | 0.00% |  |
Top three noisy pixels from each quadrant. If the there are fewer than three noisy pixels in the level2.evt file, extra rows are filled as -1
| Pixel properties | Quadrant properties | ||||||
|---|---|---|---|---|---|---|---|
| Quadrant | DetID | PixID | Counts | Sigma | Mean | Median | Sigma |
| A | 0 | 29 | 809 | 10.54 | 221 | 208 | 57.0 |
| A | 15 | 236 | 670 | 8.1 | 221 | 208 | 57.0 |
| A | 7 | 110 | 665 | 8.01 | 221 | 208 | 57.0 |
| B | 2 | 9 | 655 | 9.76 | 218 | 209 | 45.7 |
| B | 2 | 8 | 569 | 7.88 | 218 | 209 | 45.7 |
| B | 5 | 128 | 550 | 7.47 | 218 | 209 | 45.7 |
| C | 1 | 80 | 632 | 7.1 | 224 | 212 | 59.1 |
| C | 1 | 81 | 616 | 6.83 | 224 | 212 | 59.1 |
| C | 2 | 191 | 584 | 6.29 | 224 | 212 | 59.1 |
| D | 7 | 3 | 548 | 6.21 | 210 | 192 | 57.3 |
| D | 10 | 190 | 547 | 6.19 | 210 | 192 | 57.3 |
| D | 3 | 14 | 519 | 5.7 | 210 | 192 | 57.3 |
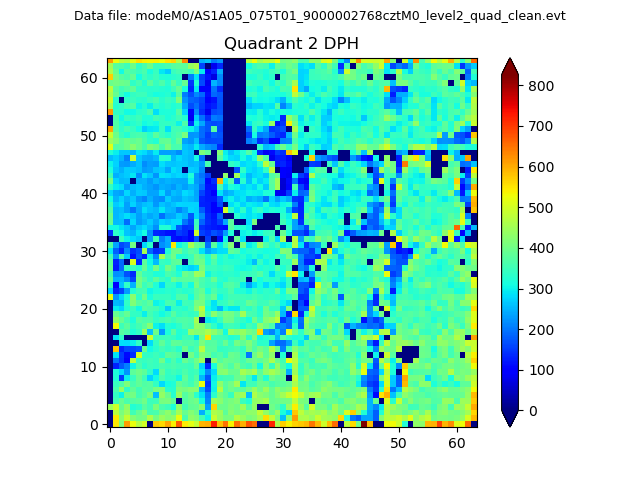
Histogram calculated using DETX and DETY for each event in the final _common_clean file
| Quadrant A |  |
 |
Quadrant B |
|---|---|---|---|
| Quadrant D |  |
 |
Quadrant C |
| Plot type | Count rate plots | Images |
|---|---|---|
| Comparison with Poisson distribution Blue bars denote a histogram of data divided into 1 sec bins. Red curve is a Poisson curve with rate = median count rate of data. |
 |
 |
| Quadrant-wise count rates Data is divided into 100 sec bins |
 |
|
| Module-wise count rates for Quadrant A Data is divided into 100 sec bins |
 |
 |
| Module-wise count rates for Quadrant B Data is divided into 100 sec bins |
 |
 |
| Module-wise count rates for Quadrant C Data is divided into 100 sec bins |
 |
 |
| Module-wise count rates for Quadrant D Data is divided into 100 sec bins |
 |
 |
| Parameter | Plot |
|---|---|
| CZT HV Monitor |  |
| D_VDD | 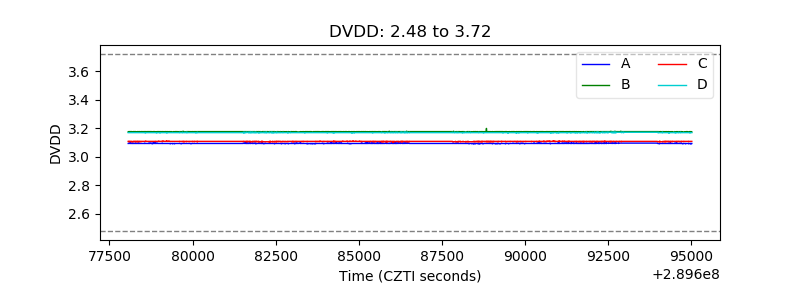 |
| Temperature 1 |  |
| Veto HV Monitor |  |
| Veto LLD |  |
| Alpha Counter |  |
| _CPM_Rate |  |
| CZT Counter |  |
| +2.5 Volts monitor |  |
| +5 Volts monitor |  |
| _ROLL_ROT |  |
| _Roll_DEC |  |
| _Roll_RA |  |
| Veto Counter |  |