| Param | Original file | Final file |
|---|---|---|
| Filename | modeM0/AS1A05_075T01_9000002768_18600cztM0_level2.evt | modeM0/AS1A05_075T01_9000002768_18600cztM0_level2_quad_clean.evt |
| Size (bytes) | 245,505,600 | 58,489,920 |
| Size | 234.1 MB | 55.8 MB |
| Events in quadrant A | 1,749,456 | 380,649 |
| Events in quadrant B | 1,789,593 | 394,749 |
| Events in quadrant C | 1,821,579 | 385,295 |
| Events in quadrant D | 1,846,107 | 373,542 |
| Mode SS | |||
|---|---|---|---|
| Quadrant | BADHDUFLAG | Total packets | Discarded packets |
| A | 0 | 68 | 0 |
| B | 0 | 68 | 0 |
| C | 0 | 68 | 0 |
| D | 0 | 68 | 0 |
| Mode M0 | |||
|---|---|---|---|
| Quadrant | BADHDUFLAG | Total packets | Discarded packets |
| A | 0 | 7282 | 1 |
| B | 0 | 7404 | 1 |
| C | 0 | 7526 | 1 |
| D | 0 | 7693 | 1 |
| Mode M9 | |||
|---|---|---|---|
| Quadrant | BADHDUFLAG | Total packets | Discarded packets |
| A | 0 | 14 | 0 |
| B | 0 | 14 | 0 |
| C | 0 | 14 | 0 |
| D | 0 | 14 | 0 |
| Quadrant | Total seconds | Saturated seconds | Saturation percentage |
|---|---|---|---|
| A | 3340 | 58 | 1.736527% |
| B | 3340 | 75 | 2.245509% |
| C | 3340 | 82 | 2.455090% |
| D | 3340 | 82 | 2.455090% |
Noise dominated data is calculated using 1-second bins in cleaned event files. If a bin has >2000 counts, and if more than 50% of those come from <1% of pixels, then it is considered to be noise-dominated and hence unusable.
| Quadrant | # 1 sec bins | Bins with >0 counts | Bins with >2000 counts | High rate bins dominated by noise | Noise dominated (total time) | Noise dominated (detector-on time) | Marked lightcurve |
|---|---|---|---|---|---|---|---|
| A | 4705 | 3341 | 0 | 0 | 0.00% | 0.00% | 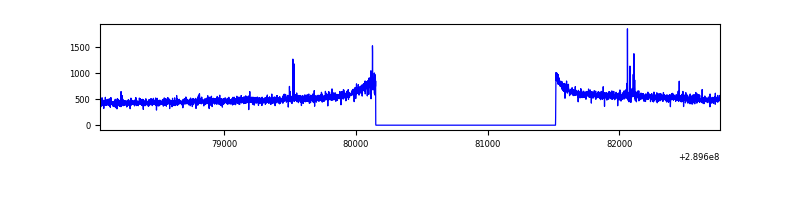 |
| B | 4705 | 3341 | 2 | 2 | 0.04% | 0.06% | 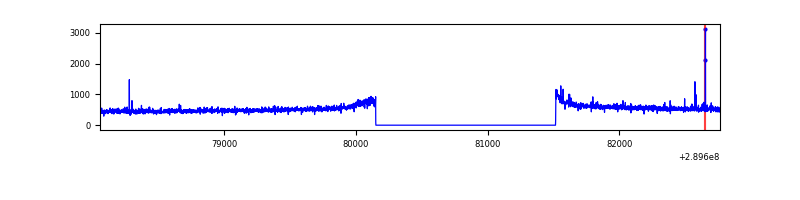 |
| C | 4705 | 3341 | 0 | 0 | 0.00% | 0.00% | 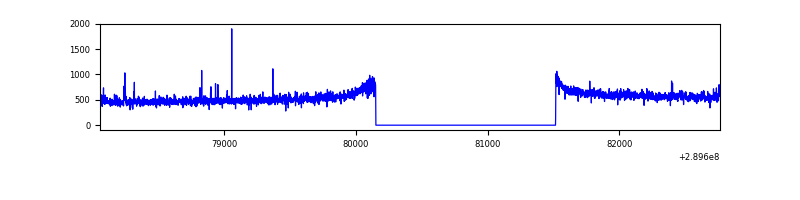 |
| D | 4705 | 3341 | 18 | 18 | 0.38% | 0.54% | 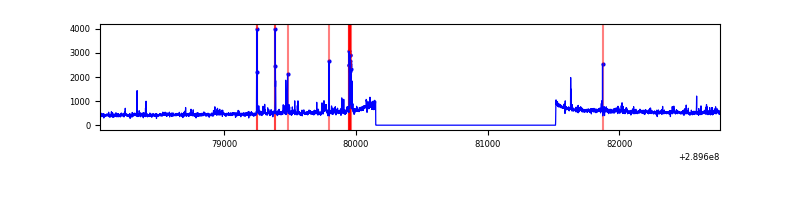 |
Top three noisy pixels from each quadrant. If the there are fewer than three noisy pixels in the level2.evt file, extra rows are filled as -1
| Pixel properties | Quadrant properties | ||||||
|---|---|---|---|---|---|---|---|
| Quadrant | DetID | PixID | Counts | Sigma | Mean | Median | Sigma |
| A | 12 | 96 | 15309 | 163.4 | 448 | 440 | 91.0 |
| A | 15 | 192 | 6856 | 70.51 | 448 | 440 | 91.0 |
| A | 13 | 254 | 4658 | 46.35 | 448 | 440 | 91.0 |
| B | 0 | 229 | 11718 | 131.26 | 451 | 440 | 85.9 |
| B | 0 | 244 | 10509 | 117.19 | 451 | 440 | 85.9 |
| B | 12 | 111 | 10023 | 111.53 | 451 | 440 | 85.9 |
| C | 14 | 238 | 67780 | 655.86 | 440 | 445 | 102.7 |
| C | 9 | 221 | 20639 | 196.7 | 440 | 445 | 102.7 |
| C | 3 | 233 | 9530 | 88.49 | 440 | 445 | 102.7 |
| D | 1 | 52 | 138124 | 1292.83 | 442 | 429 | 106.5 |
| D | 7 | 238 | 35517 | 329.44 | 442 | 429 | 106.5 |
| D | 2 | 234 | 12722 | 115.42 | 442 | 429 | 106.5 |
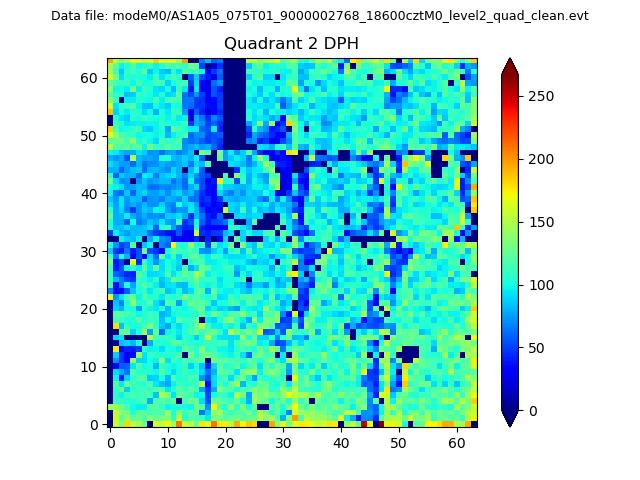
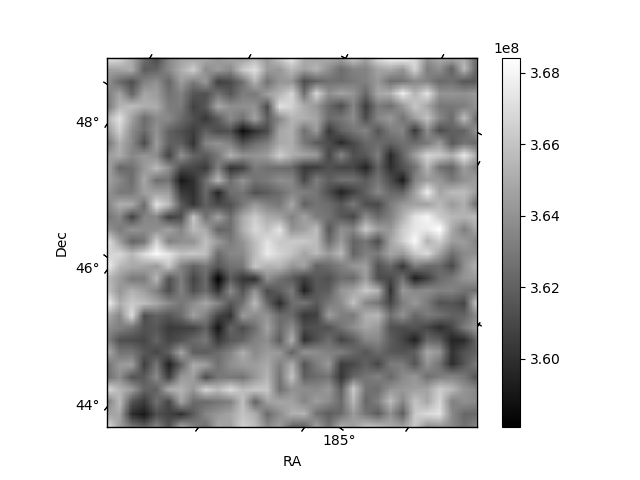
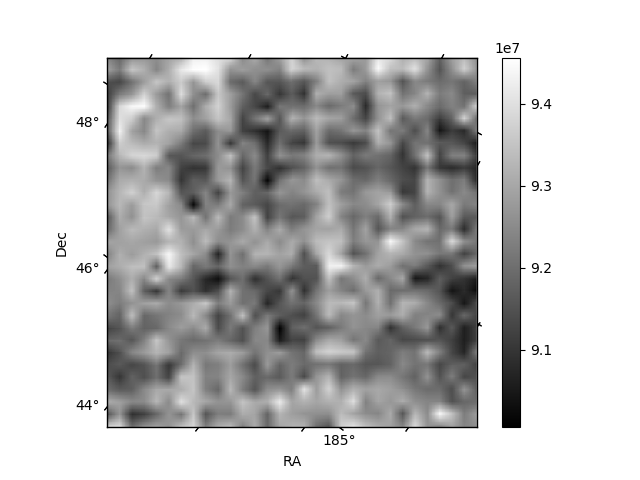
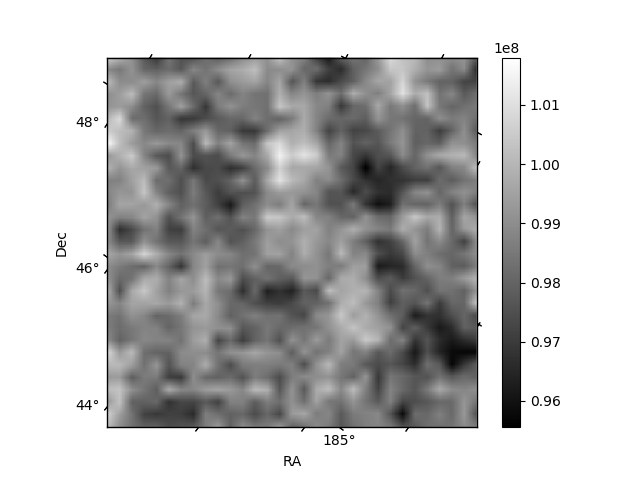
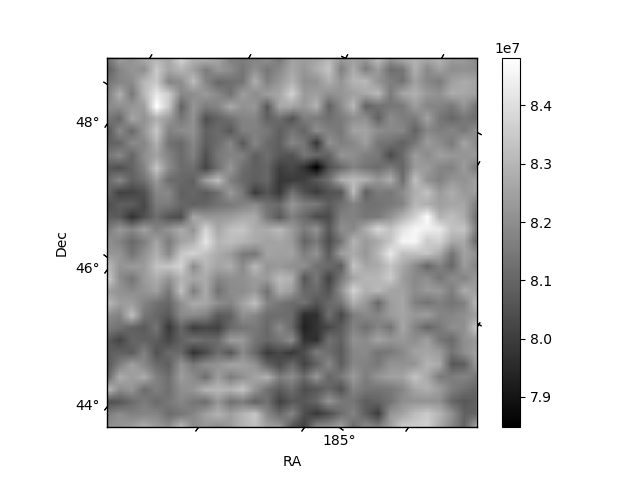
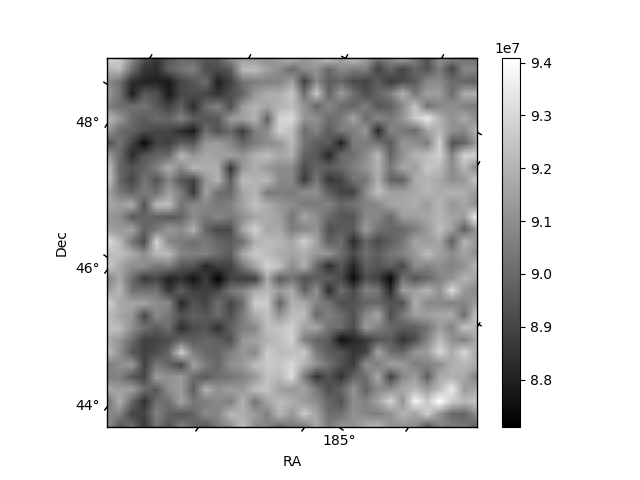
Histogram calculated using DETX and DETY for each event in the final _common_clean file
| Quadrant A | 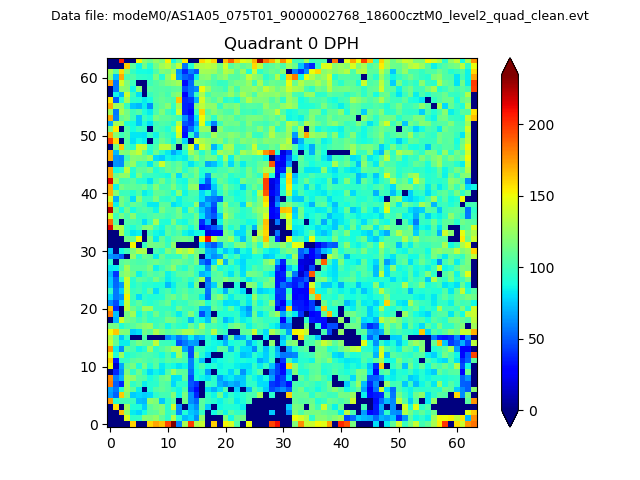 |
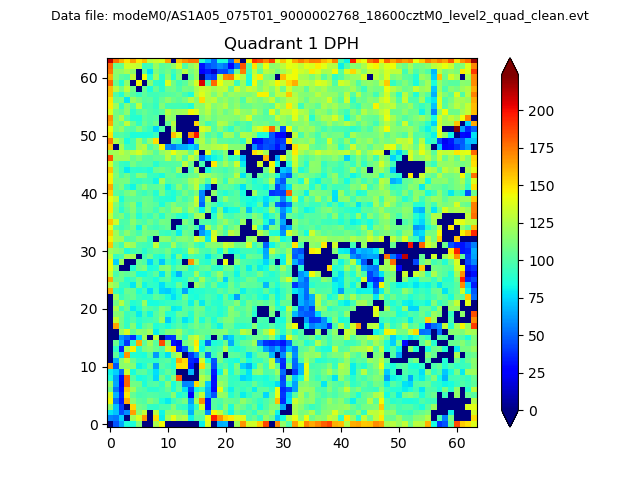 |
Quadrant B |
|---|---|---|---|
| Quadrant D | 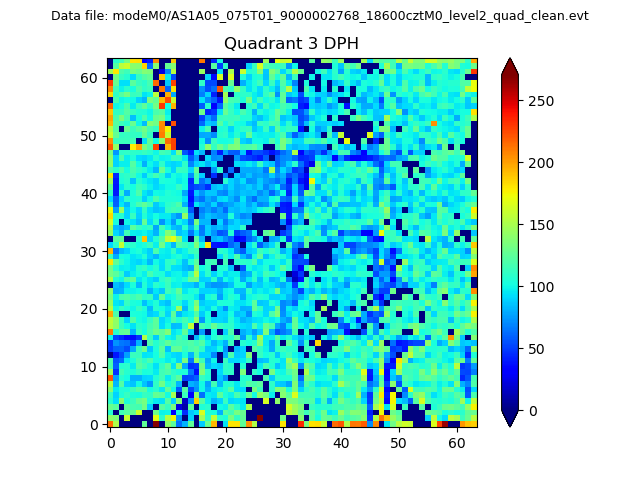 |
 |
Quadrant C |
| Plot type | Count rate plots | Images |
|---|---|---|
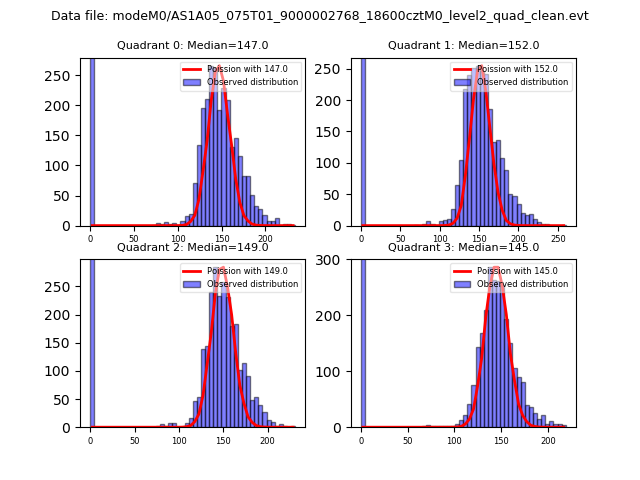
| Comparison with Poisson distribution Blue bars denote a histogram of data divided into 1 sec bins. Red curve is a Poisson curve with rate = median count rate of data. |
 |
 |
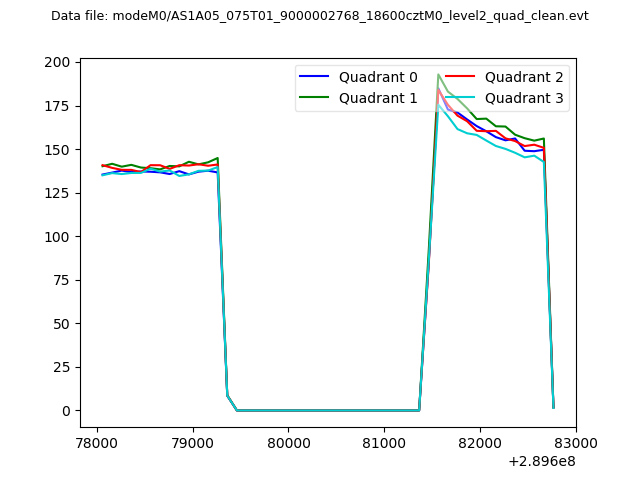
| Quadrant-wise count rates Data is divided into 100 sec bins |
 |
|
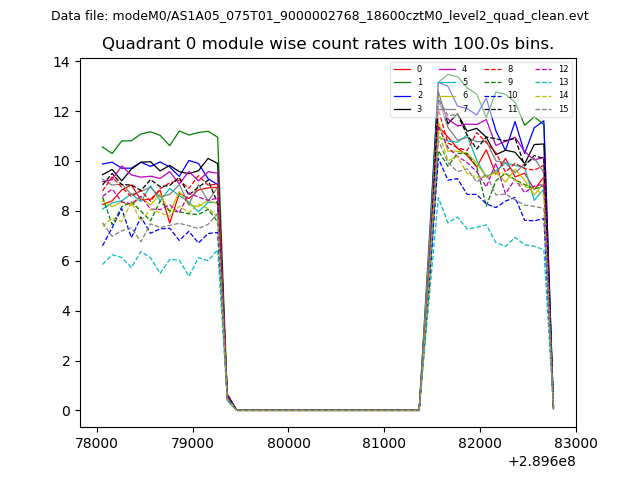
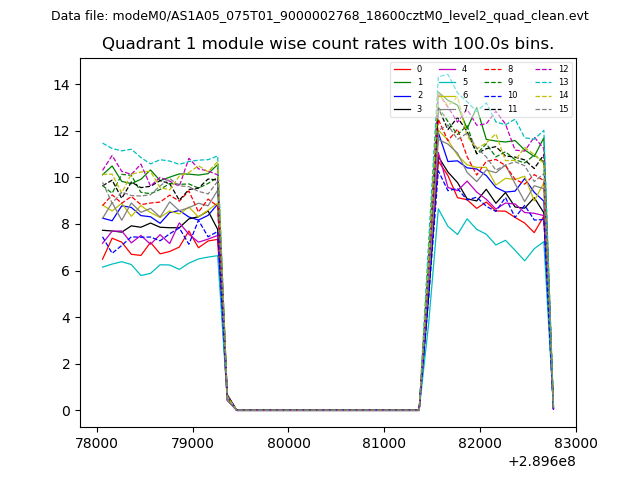
| Module-wise count rates for Quadrant A Data is divided into 100 sec bins |
 |
 |
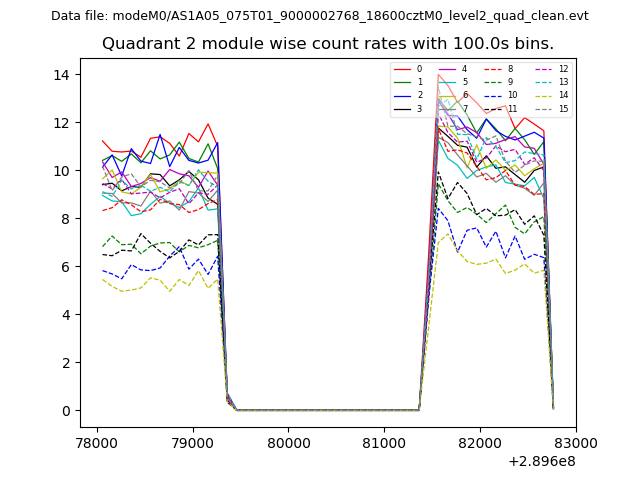
| Module-wise count rates for Quadrant B Data is divided into 100 sec bins |
 |
 |
| Module-wise count rates for Quadrant C Data is divided into 100 sec bins |
 |
 |
| Module-wise count rates for Quadrant D Data is divided into 100 sec bins |
 |
 |
| Parameter | Plot |
|---|---|
| CZT HV Monitor |  |
| D_VDD | 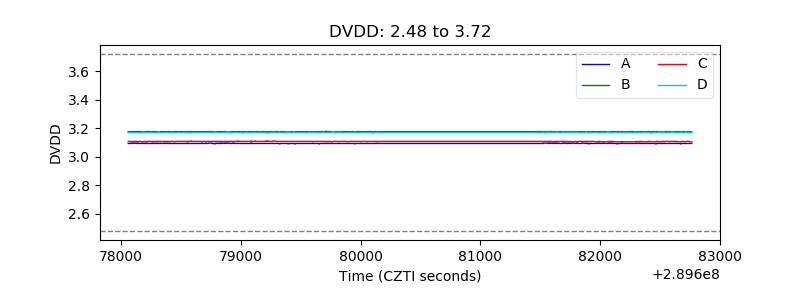 |
| Temperature 1 | 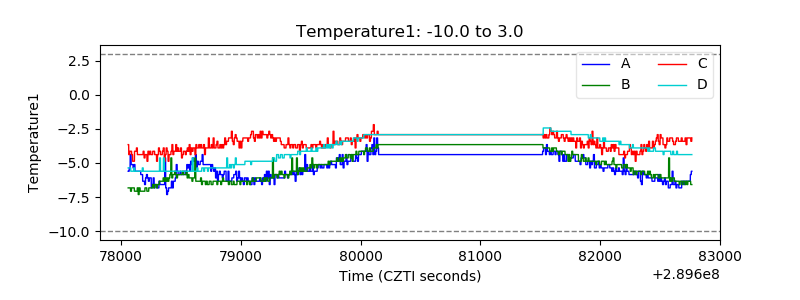 |
| Veto HV Monitor | 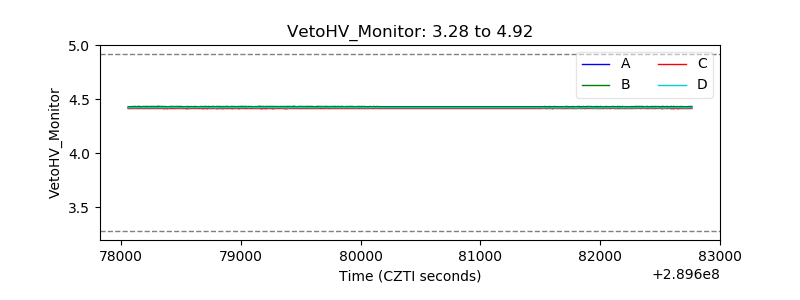 |
| Veto LLD | 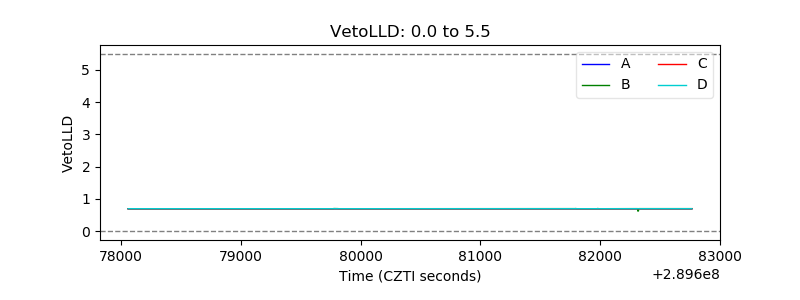 |
| Alpha Counter | 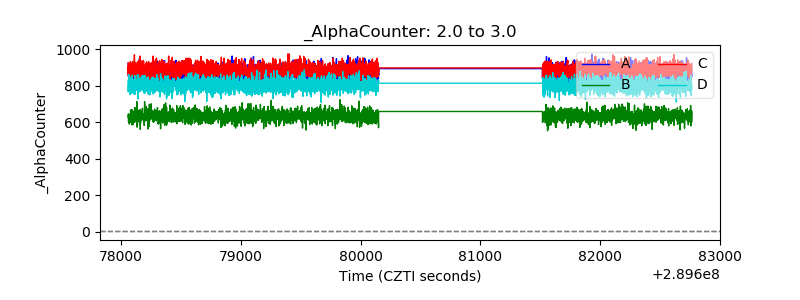 |
| _CPM_Rate | 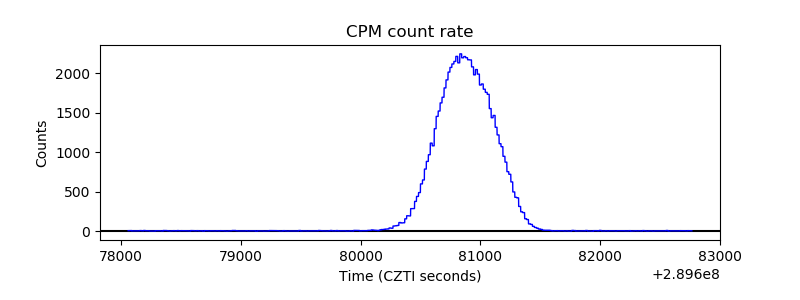 |
| CZT Counter | 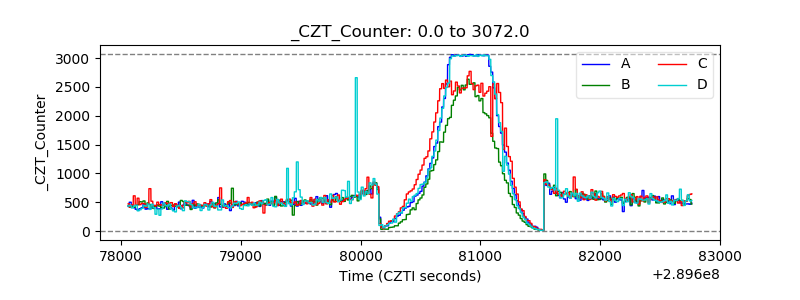 |
| +2.5 Volts monitor |  |
| +5 Volts monitor |  |
| _ROLL_ROT |  |
| _Roll_DEC | 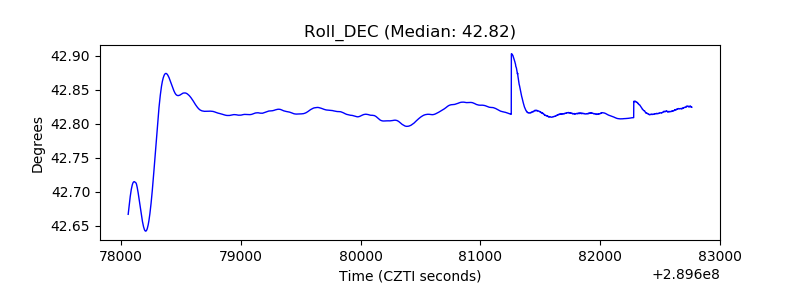 |
| _Roll_RA | 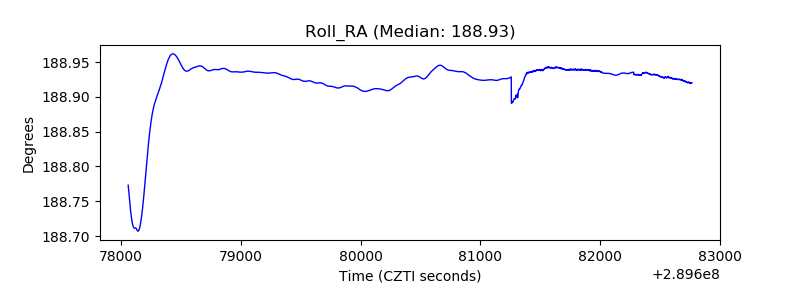 |
| Veto Counter | 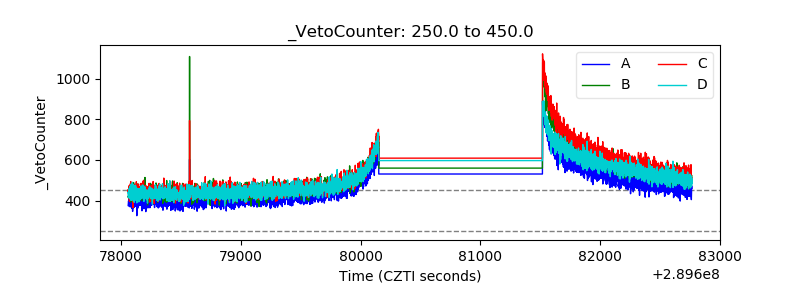 |