| Param | Original file | Final file |
|---|---|---|
| Filename | modeM0/AS1A05_075T01_9000002768_18601cztM0_level2.evt | modeM0/AS1A05_075T01_9000002768_18601cztM0_level2_quad_clean.evt |
| Size (bytes) | 468,080,640 | 109,376,640 |
| Size | 446.4 MB | 104.3 MB |
| Events in quadrant A | 3,275,469 | 712,390 |
| Events in quadrant B | 3,355,343 | 736,114 |
| Events in quadrant C | 3,440,653 | 717,319 |
| Events in quadrant D | 3,661,769 | 692,653 |
| Mode SS | |||
|---|---|---|---|
| Quadrant | BADHDUFLAG | Total packets | Discarded packets |
| A | 0 | 134 | 0 |
| B | 0 | 134 | 0 |
| C | 0 | 134 | 0 |
| D | 0 | 134 | 0 |
| Mode M0 | |||
|---|---|---|---|
| Quadrant | BADHDUFLAG | Total packets | Discarded packets |
| A | 0 | 13969 | 2 |
| B | 0 | 14164 | 2 |
| C | 0 | 14344 | 2 |
| D | 0 | 15228 | 2 |
| Mode M9 | |||
|---|---|---|---|
| Quadrant | BADHDUFLAG | Total packets | Discarded packets |
| A | 0 | 26 | 0 |
| B | 0 | 26 | 0 |
| C | 0 | 26 | 0 |
| D | 0 | 26 | 0 |
| Quadrant | Total seconds | Saturated seconds | Saturation percentage |
|---|---|---|---|
| A | 6513 | 101 | 1.550745% |
| B | 6513 | 146 | 2.241671% |
| C | 6514 | 161 | 2.471600% |
| D | 6514 | 202 | 3.101013% |
Noise dominated data is calculated using 1-second bins in cleaned event files. If a bin has >2000 counts, and if more than 50% of those come from <1% of pixels, then it is considered to be noise-dominated and hence unusable.
| Quadrant | # 1 sec bins | Bins with >0 counts | Bins with >2000 counts | High rate bins dominated by noise | Noise dominated (total time) | Noise dominated (detector-on time) | Marked lightcurve |
|---|---|---|---|---|---|---|---|
| A | 9143 | 6515 | 0 | 0 | 0.00% | 0.00% | 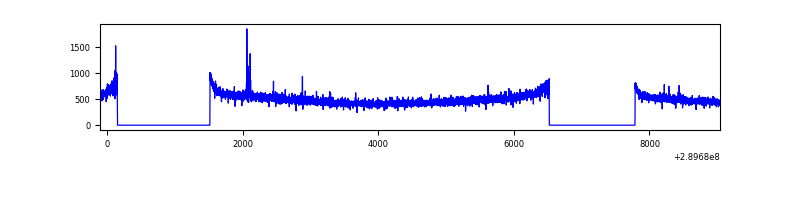 |
| B | 9143 | 6515 | 2 | 2 | 0.02% | 0.03% | 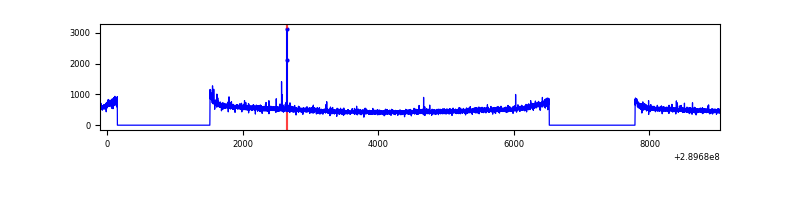 |
| C | 9144 | 6515 | 1 | 1 | 0.01% | 0.02% | 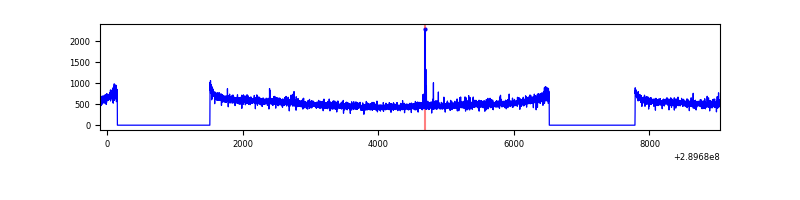 |
| D | 9144 | 6516 | 45 | 45 | 0.49% | 0.69% | 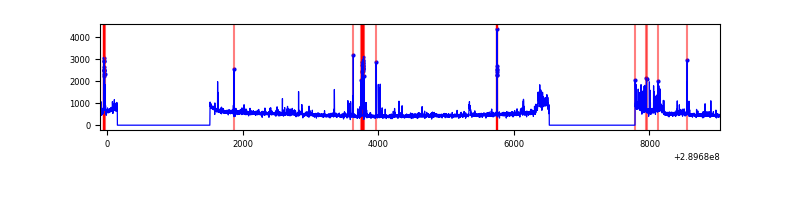 |
Top three noisy pixels from each quadrant. If the there are fewer than three noisy pixels in the level2.evt file, extra rows are filled as -1
| Pixel properties | Quadrant properties | ||||||
|---|---|---|---|---|---|---|---|
| Quadrant | DetID | PixID | Counts | Sigma | Mean | Median | Sigma |
| A | 15 | 192 | 13884 | 77.77 | 844 | 826 | 167.9 |
| A | 12 | 96 | 12173 | 67.58 | 844 | 826 | 167.9 |
| A | 13 | 254 | 9207 | 49.91 | 844 | 826 | 167.9 |
| B | 12 | 111 | 18884 | 113.41 | 850 | 829 | 159.2 |
| B | 11 | 111 | 16647 | 99.36 | 850 | 829 | 159.2 |
| B | 0 | 229 | 14929 | 88.57 | 850 | 829 | 159.2 |
| C | 14 | 238 | 129019 | 667.11 | 833 | 842 | 192.1 |
| C | 3 | 233 | 33772 | 171.39 | 833 | 842 | 192.1 |
| C | 9 | 221 | 18328 | 91.01 | 833 | 842 | 192.1 |
| D | 1 | 52 | 458172 | 2328.34 | 832 | 810 | 196.4 |
| D | 7 | 238 | 32012 | 158.84 | 832 | 810 | 196.4 |
| D | 2 | 234 | 24631 | 121.27 | 832 | 810 | 196.4 |
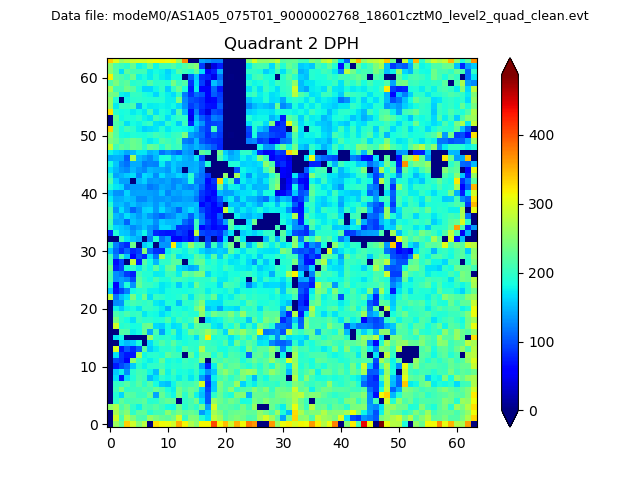
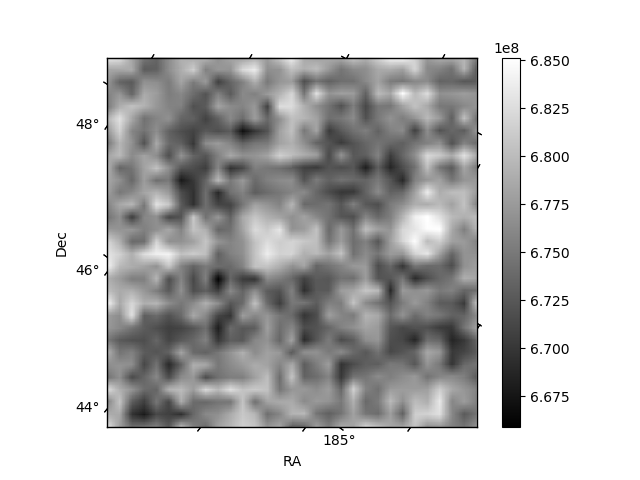
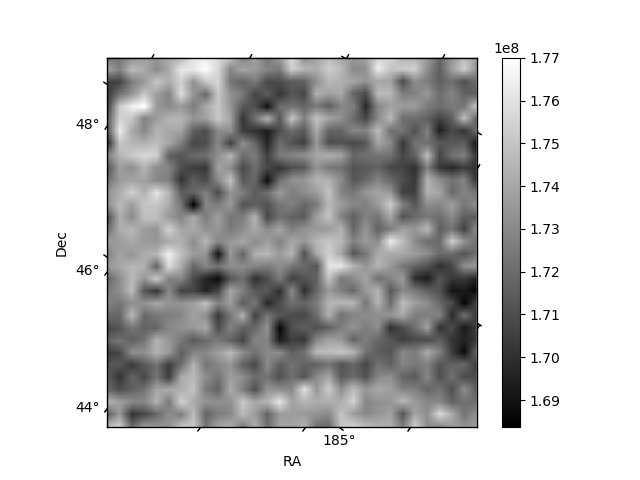
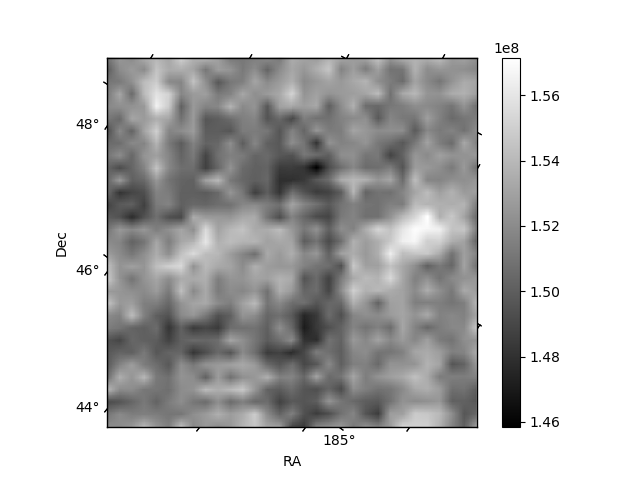
Histogram calculated using DETX and DETY for each event in the final _common_clean file
| Quadrant A | 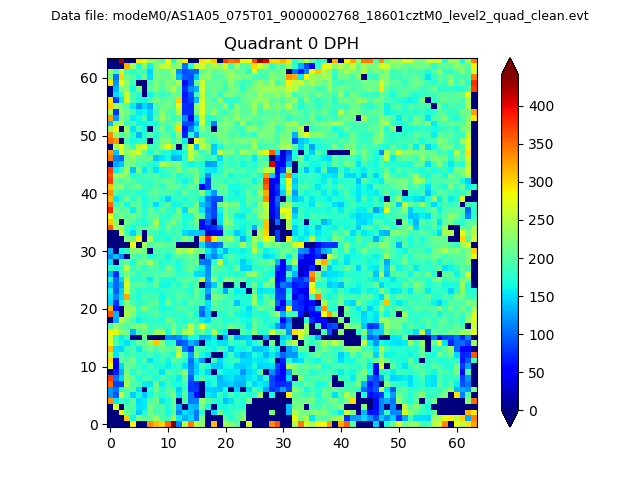 |
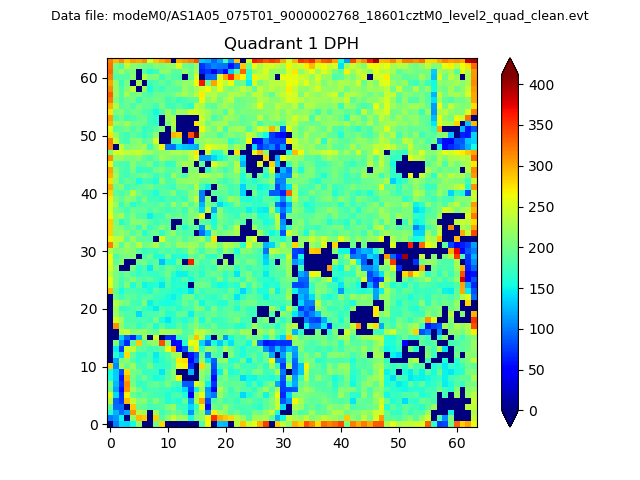 |
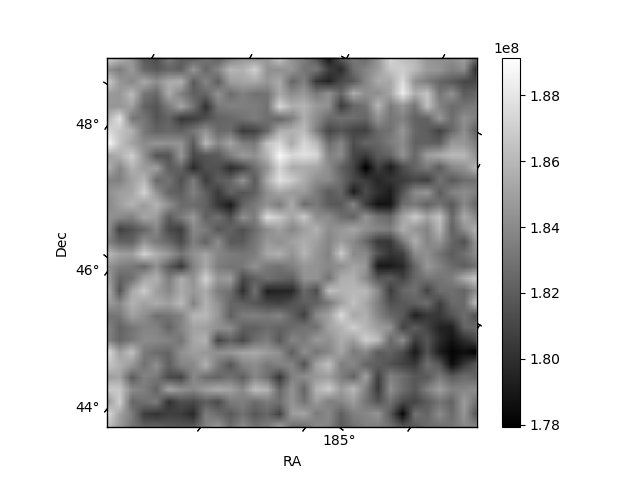
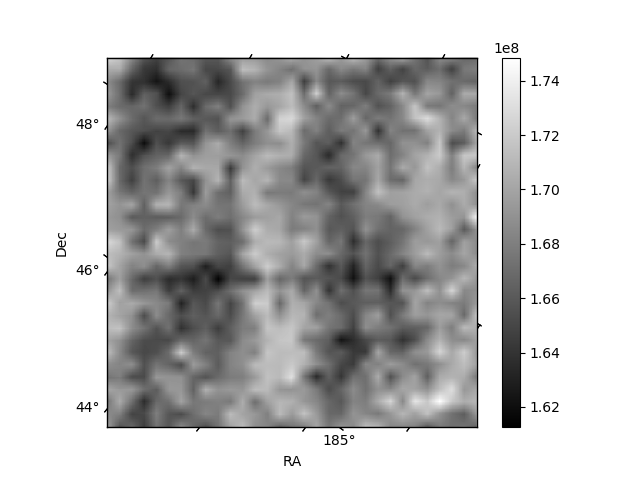
Quadrant B |
|---|---|---|---|
| Quadrant D | 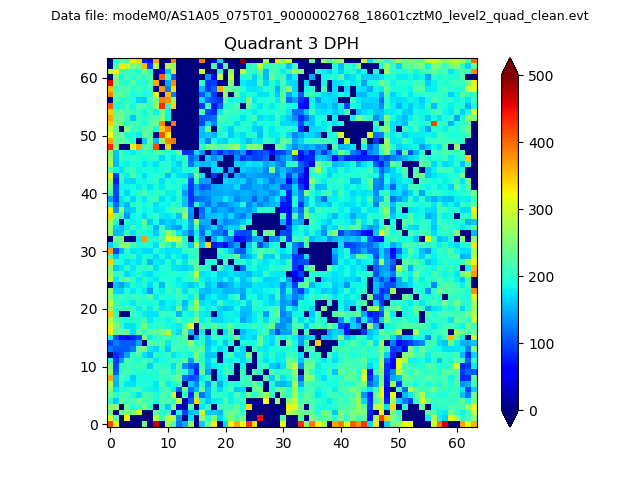 |
 |
Quadrant C |
| Plot type | Count rate plots | Images |
|---|---|---|
| Comparison with Poisson distribution Blue bars denote a histogram of data divided into 1 sec bins. Red curve is a Poisson curve with rate = median count rate of data. |
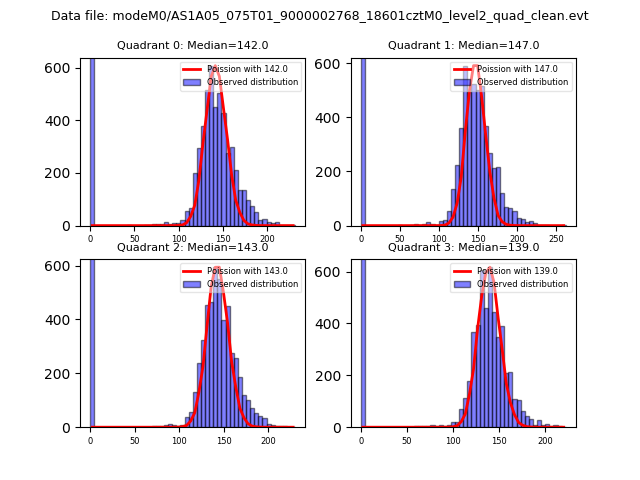 |
 |
| Quadrant-wise count rates Data is divided into 100 sec bins |
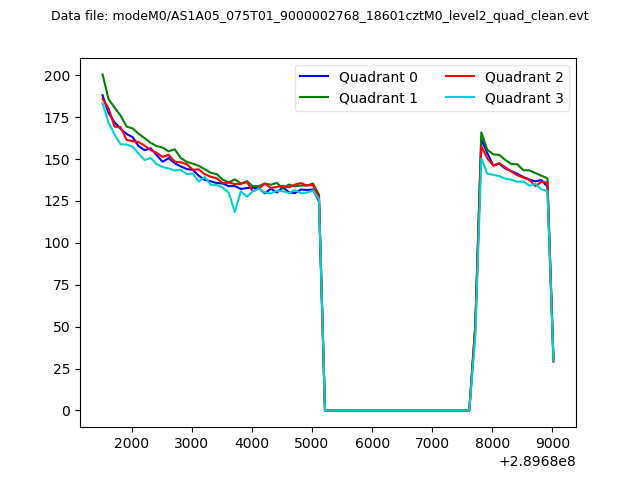 |
|
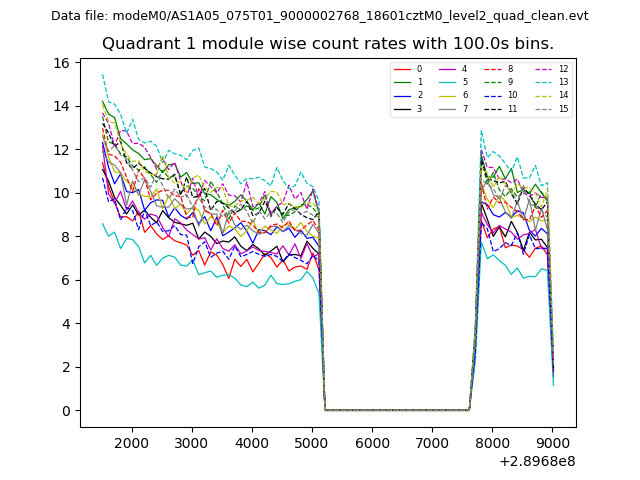
| Module-wise count rates for Quadrant A Data is divided into 100 sec bins |
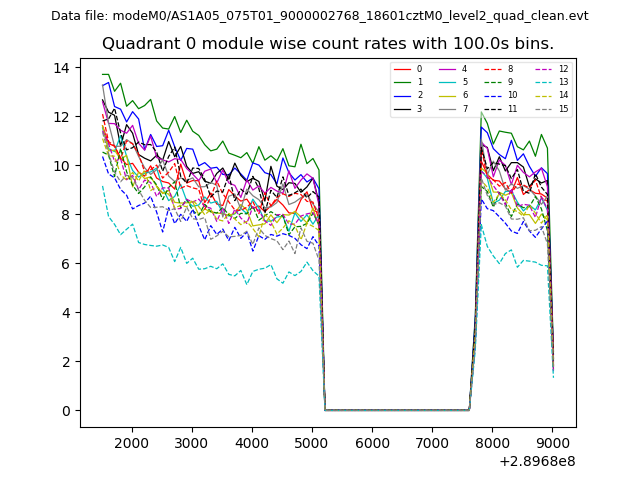 |
 |
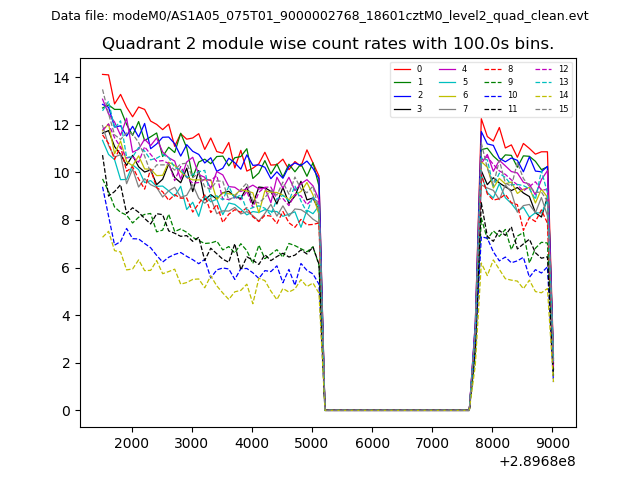
| Module-wise count rates for Quadrant B Data is divided into 100 sec bins |
 |
 |
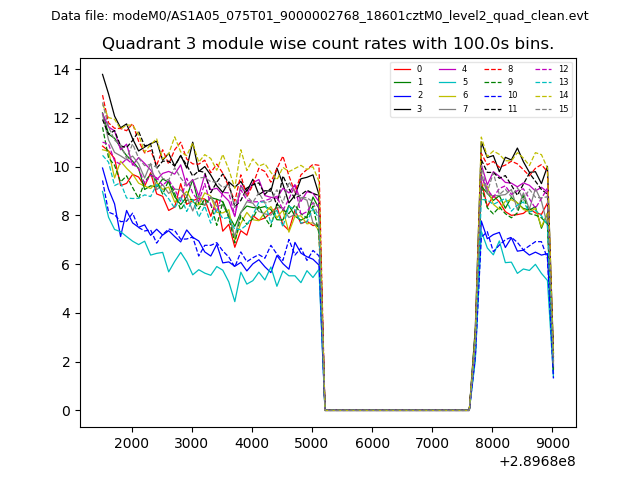
| Module-wise count rates for Quadrant C Data is divided into 100 sec bins |
 |
 |
| Module-wise count rates for Quadrant D Data is divided into 100 sec bins |
 |
 |
| Parameter | Plot |
|---|---|
| CZT HV Monitor | 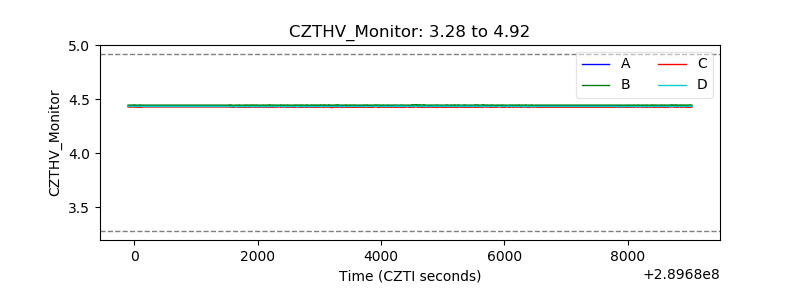 |
| D_VDD | 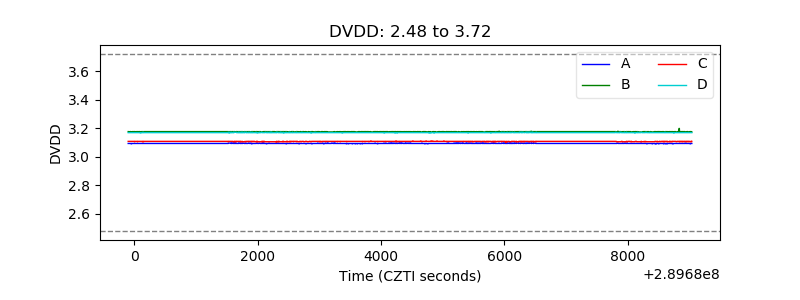 |
| Temperature 1 | 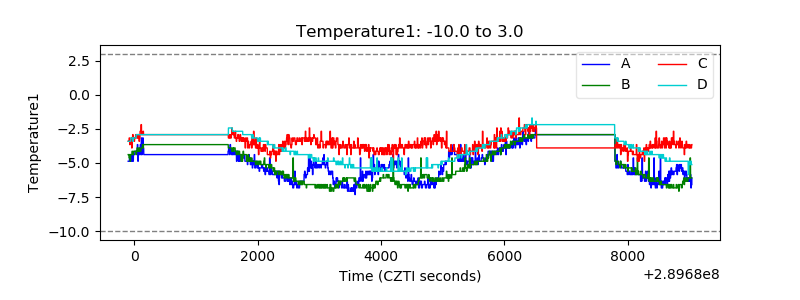 |
| Veto HV Monitor | 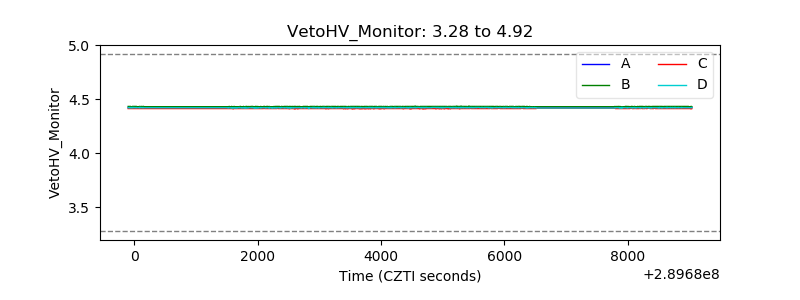 |
| Veto LLD | 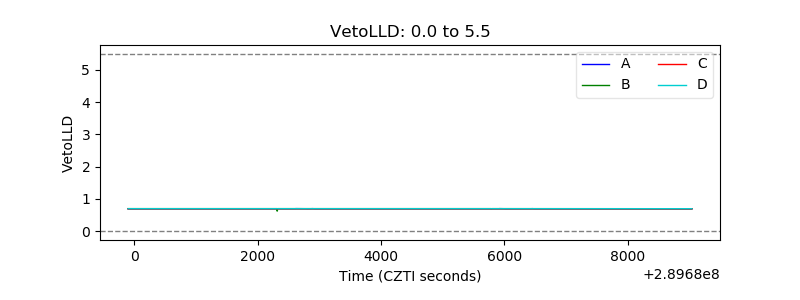 |
| Alpha Counter | 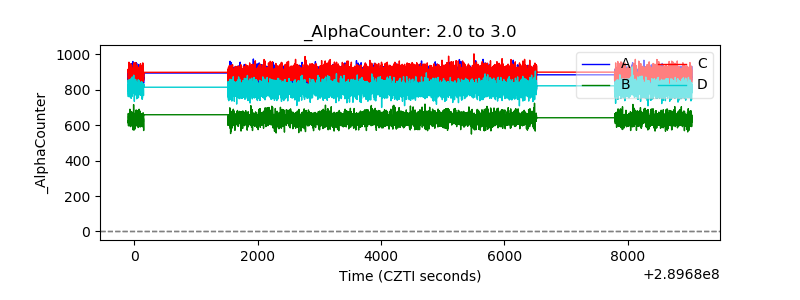 |
| _CPM_Rate | 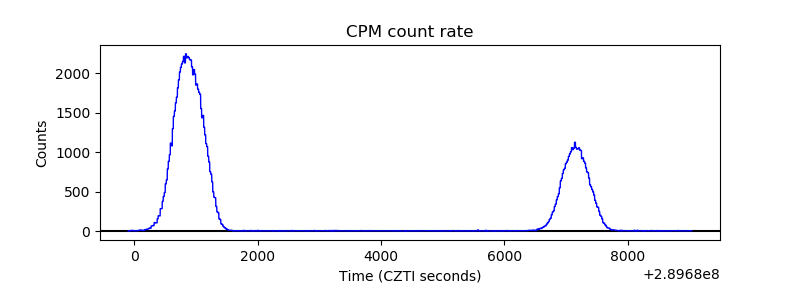 |
| CZT Counter | 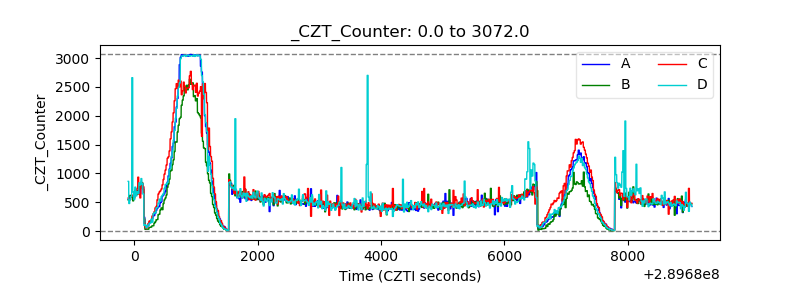 |
| +2.5 Volts monitor |  |
| +5 Volts monitor |  |
| _ROLL_ROT | 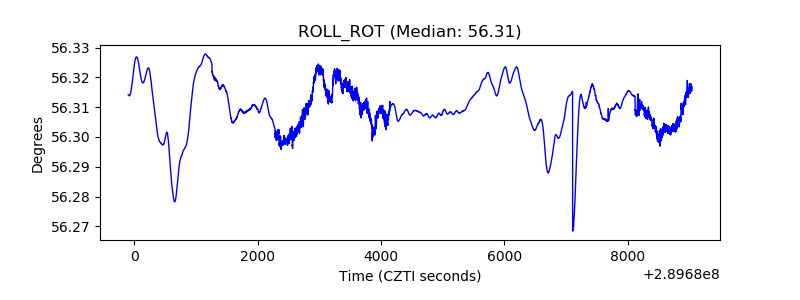 |
| _Roll_DEC | 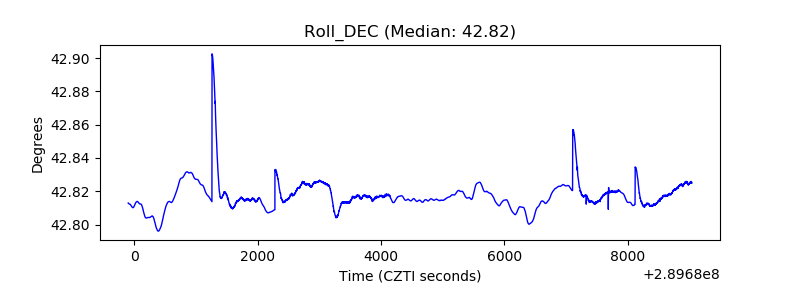 |
| _Roll_RA | 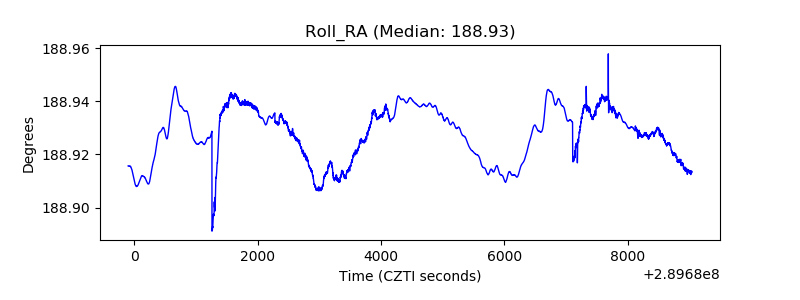 |
| Veto Counter | 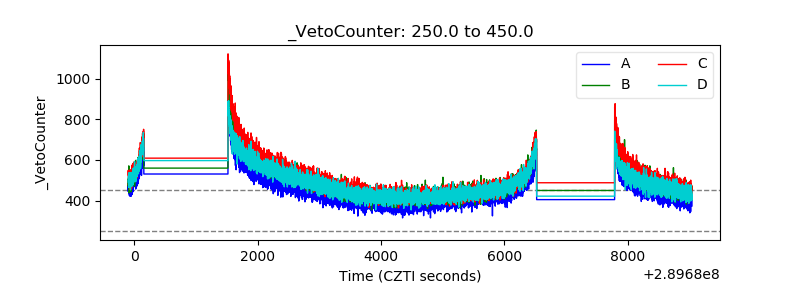 |