| Param | Original file | Final file |
|---|---|---|
| Filename | modeM0/AS1A05_075T05_9000002764cztM0_level2.fits | modeM0/AS1A05_075T05_9000002764cztM0_level2_quad_clean.evt |
| Size (bytes) | 237,412,800 | 227,566,080 |
| Size | 226.4 MB | 217.0 MB |
| Events in quadrant A | 1,430,954 | 1,339,679 |
| Events in quadrant B | 1,396,654 | 1,364,382 |
| Events in quadrant C | 1,354,478 | 1,208,082 |
| Events in quadrant D | 1,231,180 | 1,203,291 |
| Mode M9 | |||
|---|---|---|---|
| Quadrant | BADHDUFLAG | Total packets | Discarded packets |
| A | 0 | 20 | 0 |
| B | 0 | 20 | 0 |
| C | 0 | 20 | 0 |
| D | 0 | 20 | 0 |
| Mode M0 | |||
|---|---|---|---|
| Quadrant | BADHDUFLAG | Total packets | Discarded packets |
| A | 0 | 54981 | 0 |
| B | 0 | 52734 | 0 |
| C | 0 | 64690 | 0 |
| D | 0 | 63224 | 0 |
| Mode SS | |||
|---|---|---|---|
| Quadrant | BADHDUFLAG | Total packets | Discarded packets |
| A | 0 | 524 | 0 |
| B | 0 | 524 | 0 |
| C | 0 | 524 | 0 |
| D | 0 | 524 | 0 |
| Quadrant | Total seconds | Saturated seconds | Saturation percentage |
|---|---|---|---|
| A | 25820 | 412 | 1.595662% |
| B | 25820 | 174 | 0.673896% |
| C | 25820 | 2004 | 7.761425% |
| D | 25820 | 582 | 2.254067% |
Noise dominated data is calculated using 1-second bins in cleaned event files. If a bin has >2000 counts, and if more than 50% of those come from <1% of pixels, then it is considered to be noise-dominated and hence unusable.
| Quadrant | # 1 sec bins | Bins with >0 counts | Bins with >2000 counts | High rate bins dominated by noise | Noise dominated (total time) | Noise dominated (detector-on time) | Marked lightcurve |
|---|---|---|---|---|---|---|---|
| A | 29328 | 25815 | 0 | 0 | 0.00% | 0.00% |  |
| B | 29328 | 25818 | 0 | 0 | 0.00% | 0.00% |  |
| C | 29328 | 25640 | 0 | 0 | 0.00% | 0.00% |  |
| D | 29328 | 25818 | 0 | 0 | 0.00% | 0.00% | 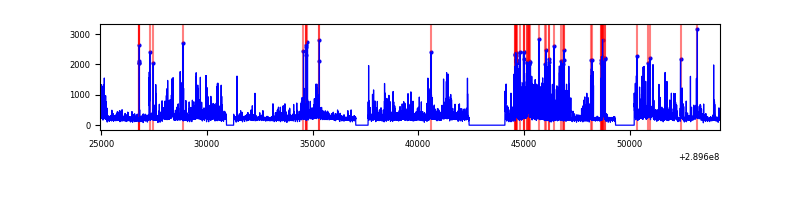 |
Top three noisy pixels from each quadrant. If the there are fewer than three noisy pixels in the level2.evt file, extra rows are filled as -1
| Pixel properties | Quadrant properties | ||||||
|---|---|---|---|---|---|---|---|
| Quadrant | DetID | PixID | Counts | Sigma | Mean | Median | Sigma |
| A | 0 | 29 | 1272 | 9.67 | 373 | 348 | 95.5 |
| A | 7 | 110 | 1192 | 8.83 | 373 | 348 | 95.5 |
| A | 9 | 19 | 1080 | 7.66 | 373 | 348 | 95.5 |
| B | 2 | 9 | 1141 | 10.62 | 368 | 350 | 74.5 |
| B | 3 | 17 | 949 | 8.04 | 368 | 350 | 74.5 |
| B | 2 | 8 | 944 | 7.97 | 368 | 350 | 74.5 |
| C | 9 | 242 | 943 | 6.52 | 358 | 333 | 93.5 |
| C | 3 | 126 | 940 | 6.49 | 358 | 333 | 93.5 |
| C | 12 | 241 | 938 | 6.47 | 358 | 333 | 93.5 |
| D | 10 | 190 | 943 | 6.54 | 351 | 319 | 95.5 |
| D | 3 | 14 | 922 | 6.32 | 351 | 319 | 95.5 |
| D | 15 | 46 | 869 | 5.76 | 351 | 319 | 95.5 |
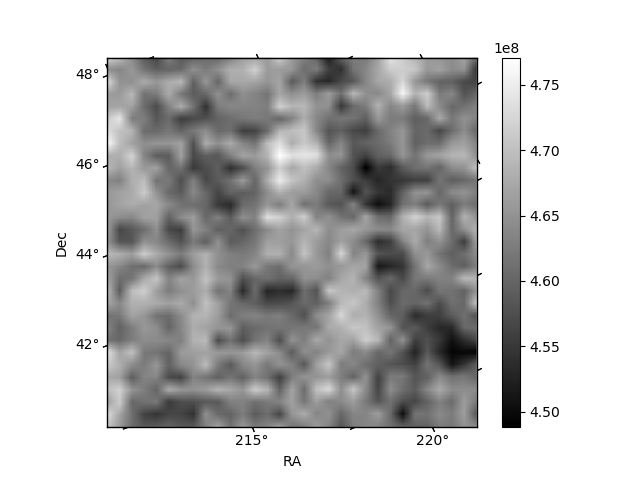
Histogram calculated using DETX and DETY for each event in the final _common_clean file
| Quadrant A | 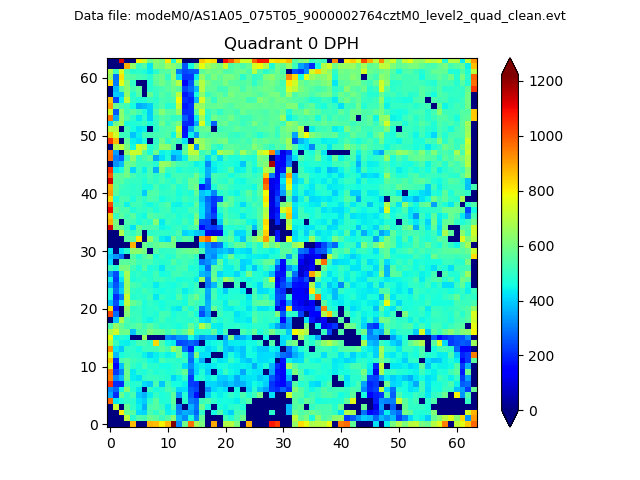 |
 |
Quadrant B |
|---|---|---|---|
| Quadrant D | 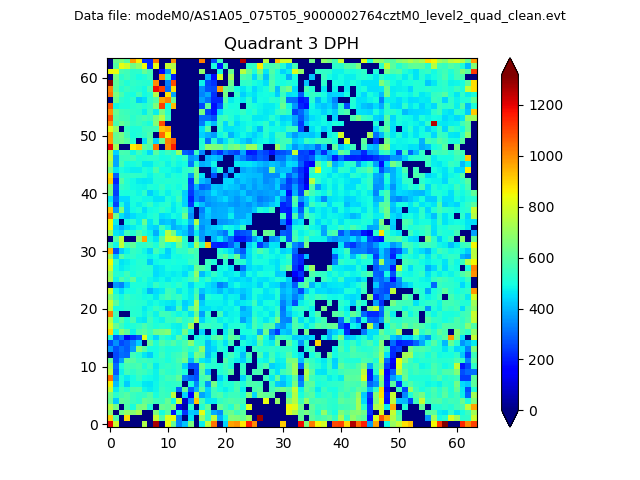 |
 |
Quadrant C |
| Plot type | Count rate plots | Images |
|---|---|---|
| Comparison with Poisson distribution Blue bars denote a histogram of data divided into 1 sec bins. Red curve is a Poisson curve with rate = median count rate of data. |
 |
 |
| Quadrant-wise count rates Data is divided into 100 sec bins |
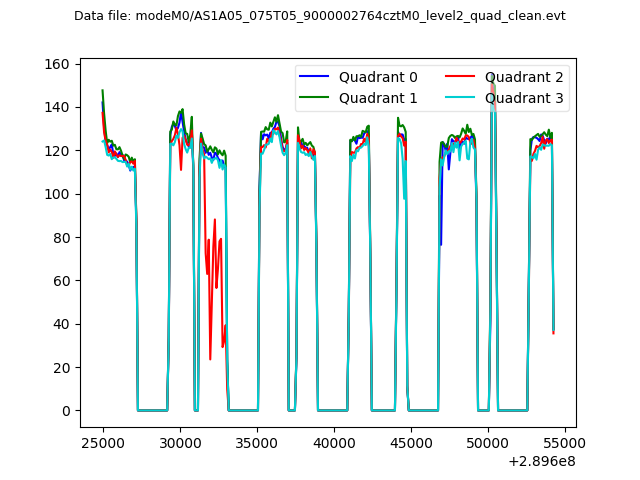 |
|
| Module-wise count rates for Quadrant A Data is divided into 100 sec bins |
 |
 |
| Module-wise count rates for Quadrant B Data is divided into 100 sec bins |
 |
 |
| Module-wise count rates for Quadrant C Data is divided into 100 sec bins |
 |
 |
| Module-wise count rates for Quadrant D Data is divided into 100 sec bins |
 |
 |
| Parameter | Plot |
|---|---|
| CZT HV Monitor |  |
| D_VDD |  |
| Temperature 1 | 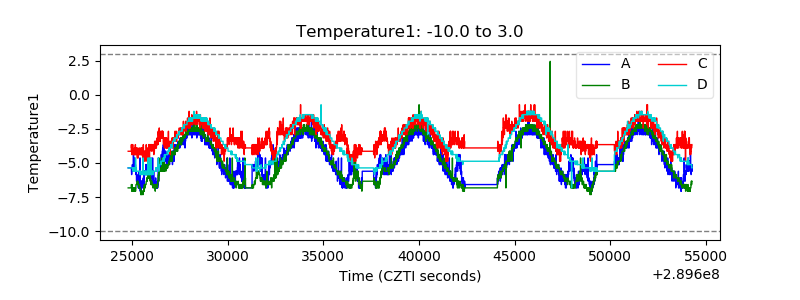 |
| Veto HV Monitor |  |
| Veto LLD | 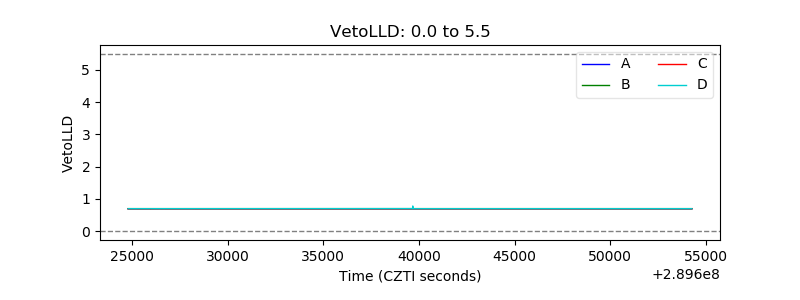 |
| Alpha Counter | 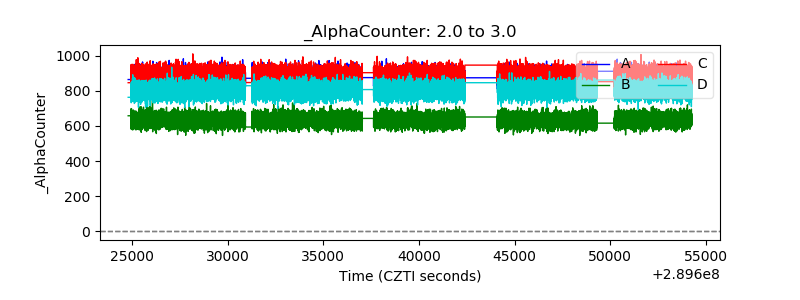 |
| _CPM_Rate |  |
| CZT Counter |  |
| +2.5 Volts monitor |  |
| +5 Volts monitor |  |
| _ROLL_ROT |  |
| _Roll_DEC | 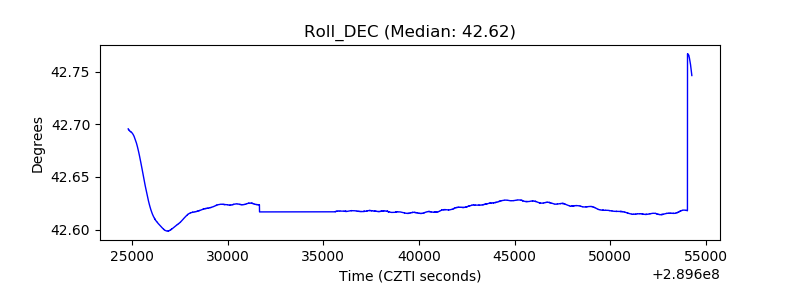 |
| _Roll_RA |  |
| Veto Counter |  |