| Param | Original file | Final file |
|---|---|---|
| Filename | modeM0/AS1A05_075T05_9000002764_18590cztM0_level2.evt | modeM0/AS1A05_075T05_9000002764_18590cztM0_level2_quad_clean.evt |
| Size (bytes) | 111,533,760 | 32,417,280 |
| Size | 106.4 MB | 30.9 MB |
| Events in quadrant A | 756,963 | 213,771 |
| Events in quadrant B | 787,127 | 218,653 |
| Events in quadrant C | 849,882 | 211,572 |
| Events in quadrant D | 860,423 | 207,576 |
| Mode M9 | |||
|---|---|---|---|
| Quadrant | BADHDUFLAG | Total packets | Discarded packets |
| A | 0 | 2 | 0 |
| B | 0 | 2 | 0 |
| C | 0 | 2 | 0 |
| D | 0 | 2 | 0 |
| Mode M0 | |||
|---|---|---|---|
| Quadrant | BADHDUFLAG | Total packets | Discarded packets |
| A | 0 | 3613 | 1 |
| B | 0 | 3635 | 1 |
| C | 0 | 3799 | 1 |
| D | 0 | 3911 | 1 |
| Mode SS | |||
|---|---|---|---|
| Quadrant | BADHDUFLAG | Total packets | Discarded packets |
| A | 0 | 38 | 0 |
| B | 0 | 38 | 0 |
| C | 0 | 38 | 0 |
| D | 0 | 38 | 0 |
| Quadrant | Total seconds | Saturated seconds | Saturation percentage |
|---|---|---|---|
| A | 1768 | 3 | 0.169683% |
| B | 1768 | 5 | 0.282805% |
| C | 1768 | 25 | 1.414027% |
| D | 1768 | 25 | 1.414027% |
Noise dominated data is calculated using 1-second bins in cleaned event files. If a bin has >2000 counts, and if more than 50% of those come from <1% of pixels, then it is considered to be noise-dominated and hence unusable.
| Quadrant | # 1 sec bins | Bins with >0 counts | Bins with >2000 counts | High rate bins dominated by noise | Noise dominated (total time) | Noise dominated (detector-on time) | Marked lightcurve |
|---|---|---|---|---|---|---|---|
| A | 1768 | 1768 | 0 | 0 | 0.00% | 0.00% | 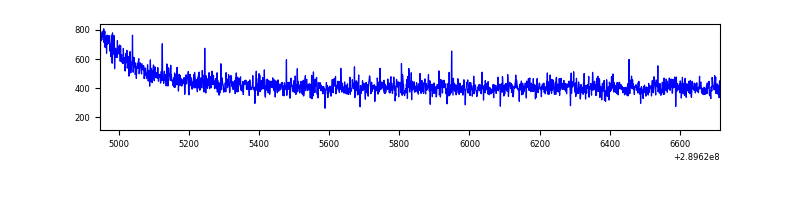 |
| B | 1768 | 1768 | 0 | 0 | 0.00% | 0.00% | 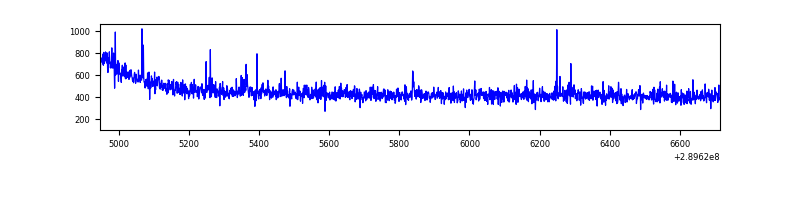 |
| C | 1768 | 1768 | 0 | 0 | 0.00% | 0.00% | 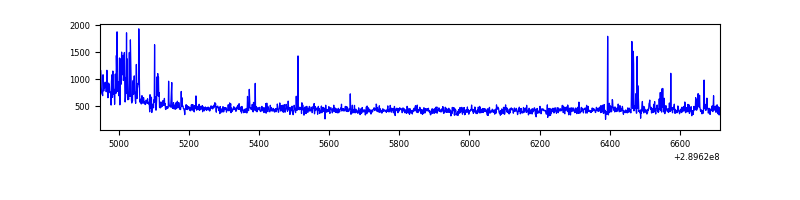 |
| D | 1768 | 1768 | 8 | 8 | 0.45% | 0.45% | 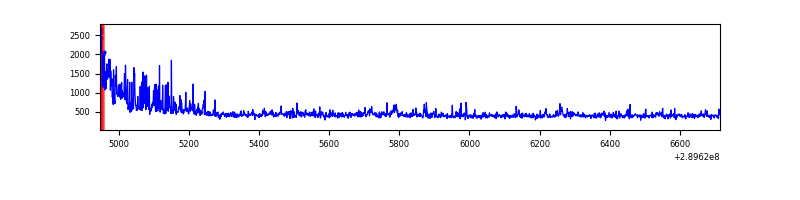 |
Top three noisy pixels from each quadrant. If the there are fewer than three noisy pixels in the level2.evt file, extra rows are filled as -1
| Pixel properties | Quadrant properties | ||||||
|---|---|---|---|---|---|---|---|
| Quadrant | DetID | PixID | Counts | Sigma | Mean | Median | Sigma |
| A | 13 | 254 | 2797 | 61.89 | 196 | 192 | 42.1 |
| A | 0 | 226 | 1727 | 36.47 | 196 | 192 | 42.1 |
| A | 3 | 137 | 1677 | 35.28 | 196 | 192 | 42.1 |
| B | 0 | 229 | 6457 | 155.32 | 198 | 193 | 40.3 |
| B | 12 | 111 | 4745 | 112.87 | 198 | 193 | 40.3 |
| B | 11 | 111 | 4153 | 98.19 | 198 | 193 | 40.3 |
| C | 4 | 254 | 66762 | 1426.58 | 190 | 191 | 46.7 |
| C | 14 | 238 | 29356 | 624.99 | 190 | 191 | 46.7 |
| C | 8 | 128 | 4484 | 92.0 | 190 | 191 | 46.7 |
| D | 1 | 52 | 123458 | 2668.97 | 187 | 181 | 46.2 |
| D | 10 | 50 | 12033 | 256.59 | 187 | 181 | 46.2 |
| D | 7 | 238 | 10786 | 229.59 | 187 | 181 | 46.2 |
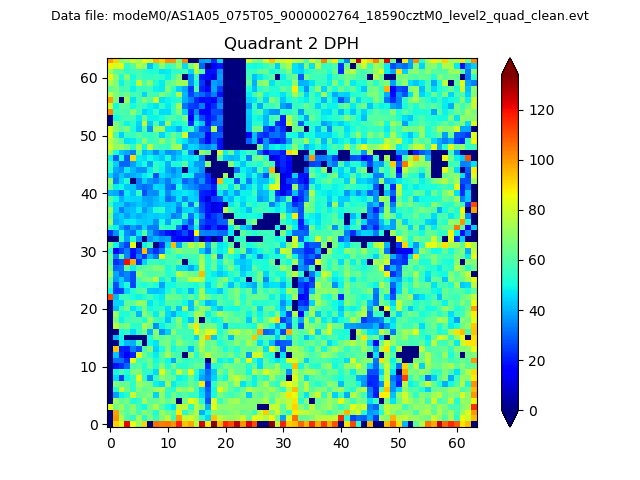
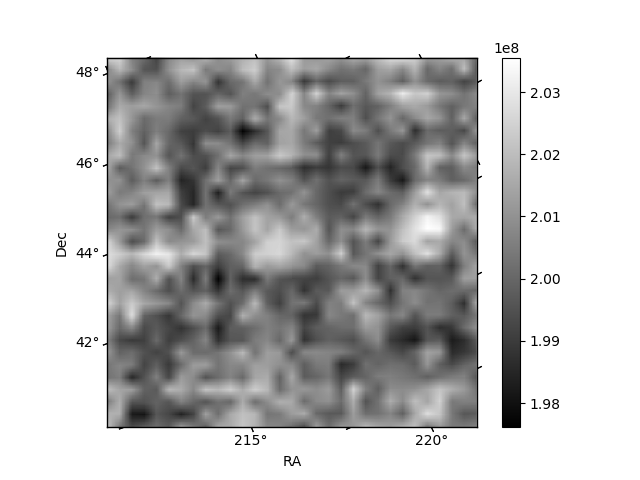
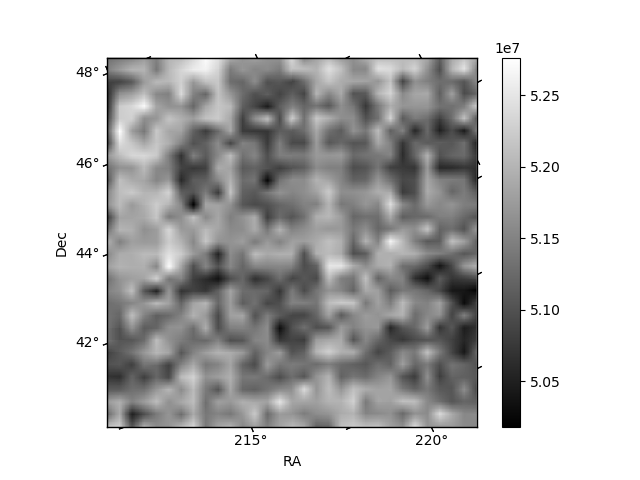
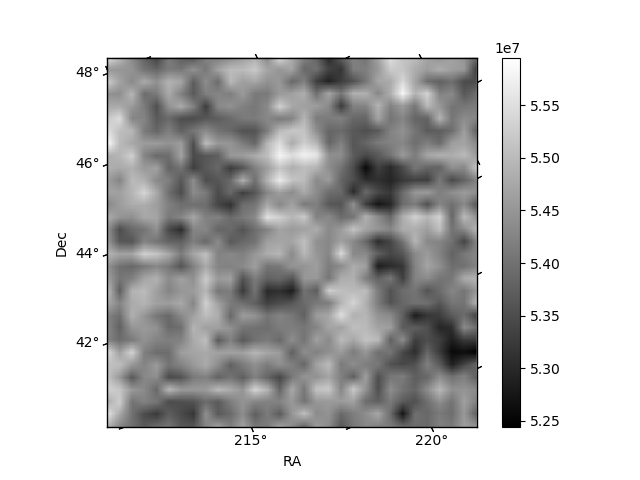
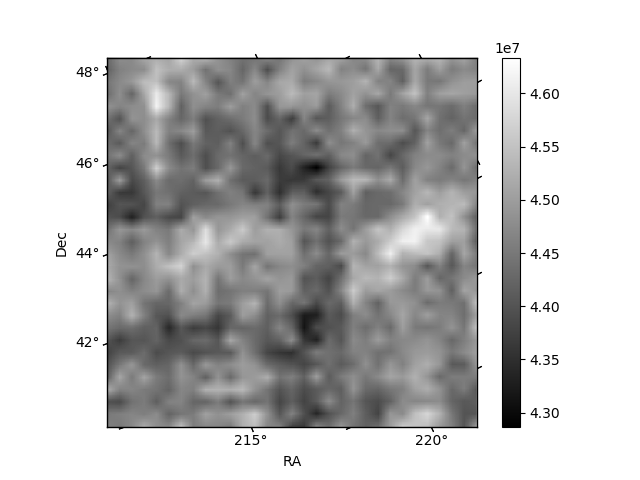
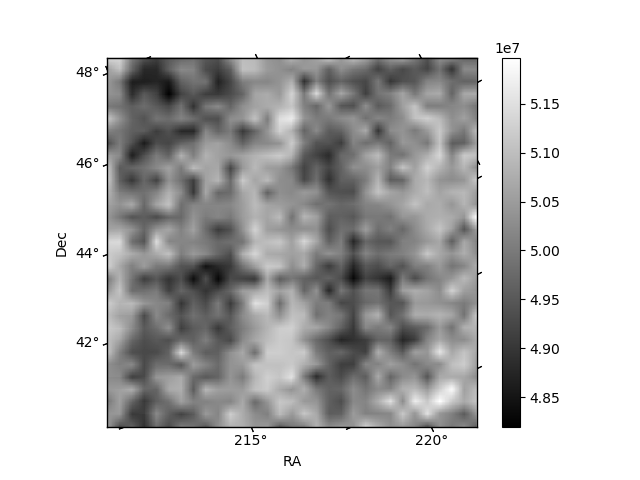
Histogram calculated using DETX and DETY for each event in the final _common_clean file
| Quadrant A | 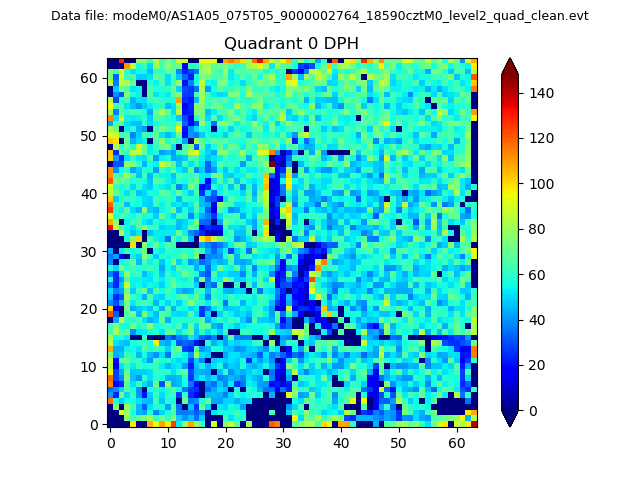 |
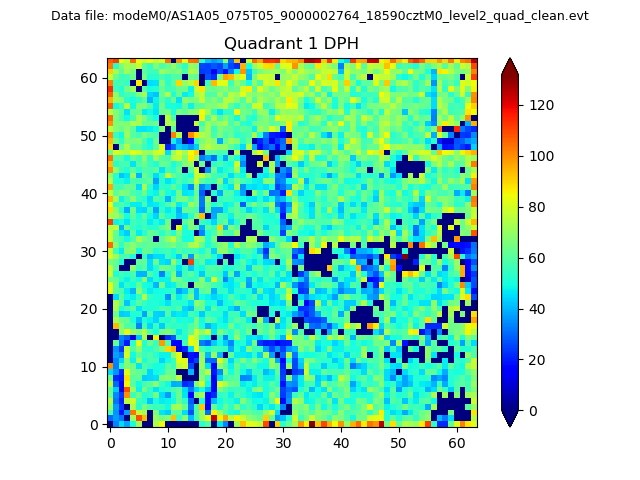 |
Quadrant B |
|---|---|---|---|
| Quadrant D | 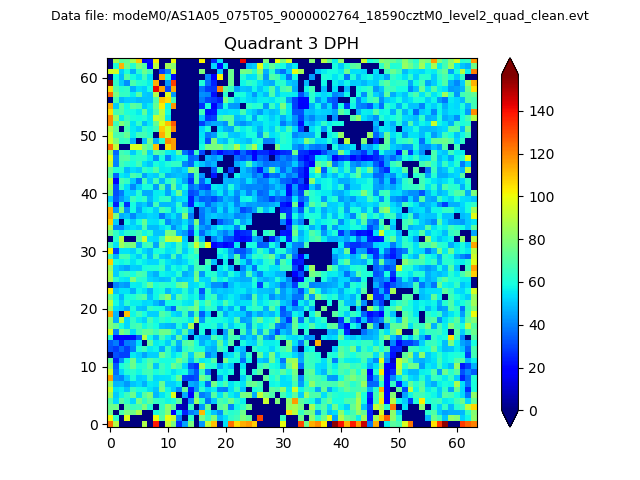 |
 |
Quadrant C |
| Plot type | Count rate plots | Images |
|---|---|---|
| Comparison with Poisson distribution Blue bars denote a histogram of data divided into 1 sec bins. Red curve is a Poisson curve with rate = median count rate of data. |
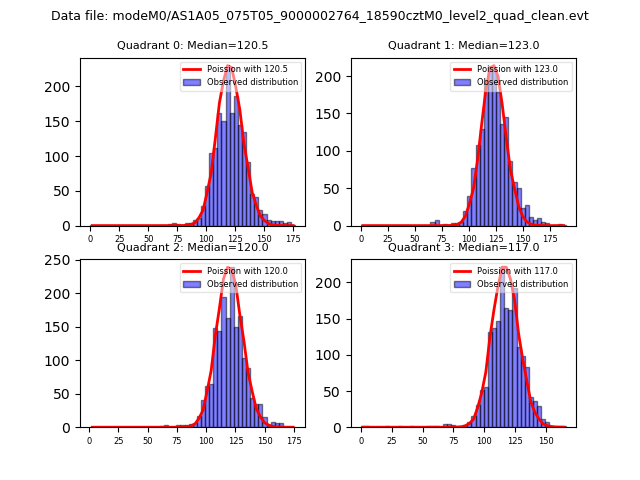 |
 |
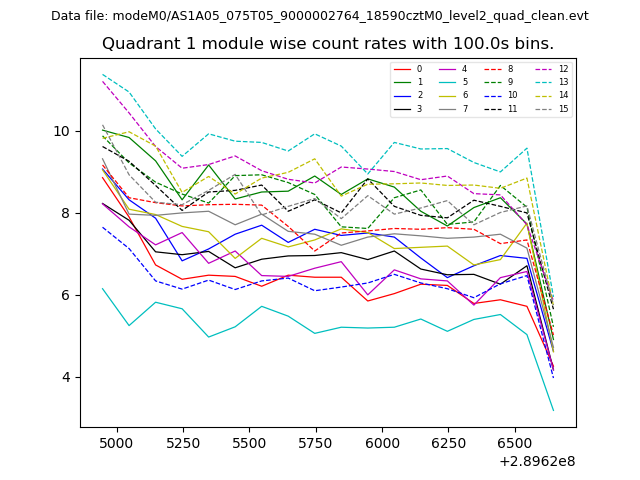
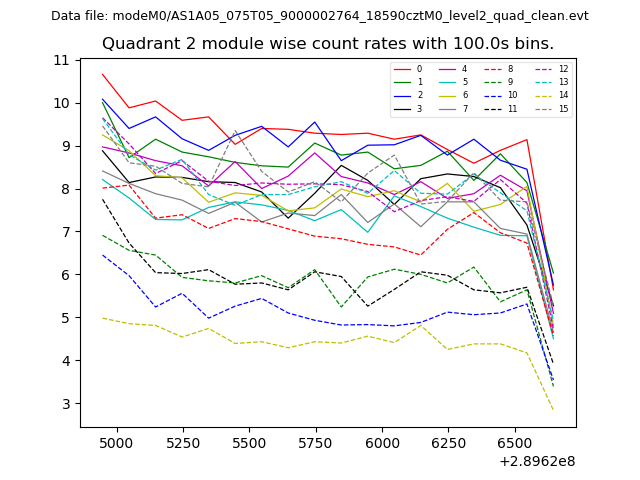
| Quadrant-wise count rates Data is divided into 100 sec bins |
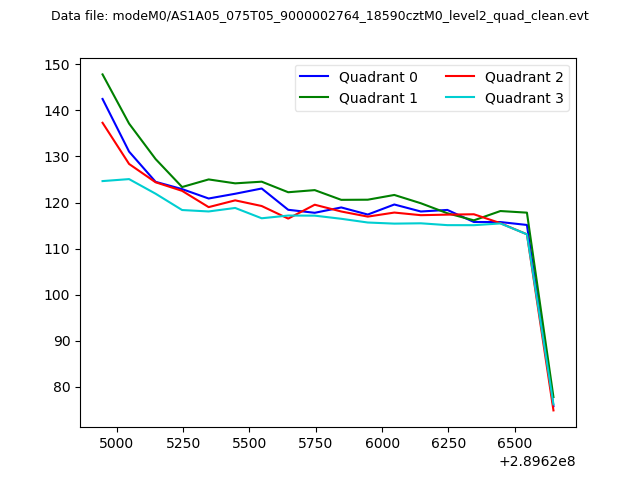 |
|
| Module-wise count rates for Quadrant A Data is divided into 100 sec bins |
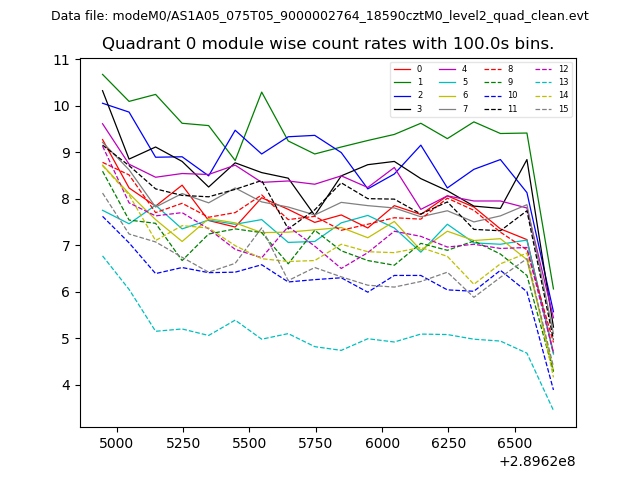 |
 |
| Module-wise count rates for Quadrant B Data is divided into 100 sec bins |
 |
 |
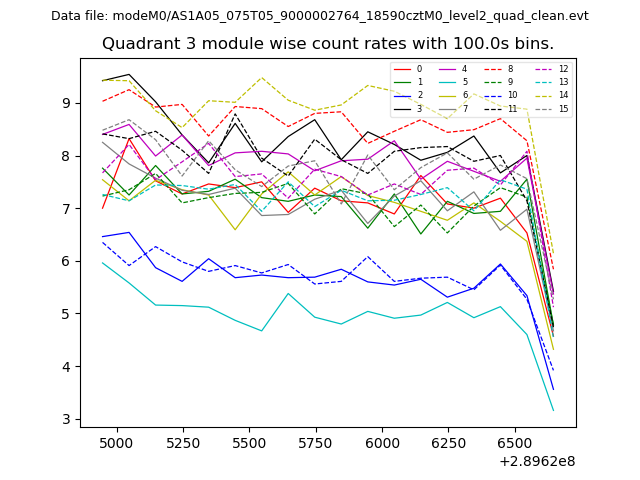
| Module-wise count rates for Quadrant C Data is divided into 100 sec bins |
 |
 |
| Module-wise count rates for Quadrant D Data is divided into 100 sec bins |
 |
 |
| Parameter | Plot |
|---|---|
| CZT HV Monitor | 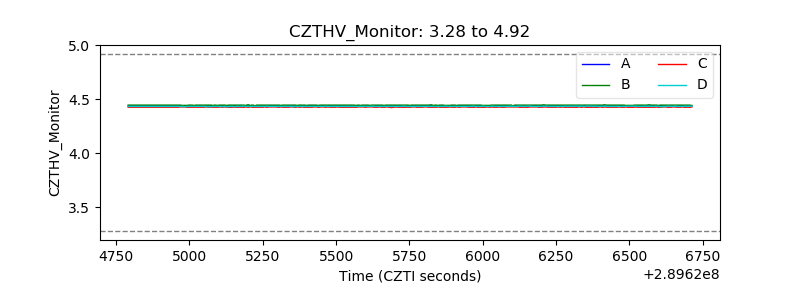 |
| D_VDD | 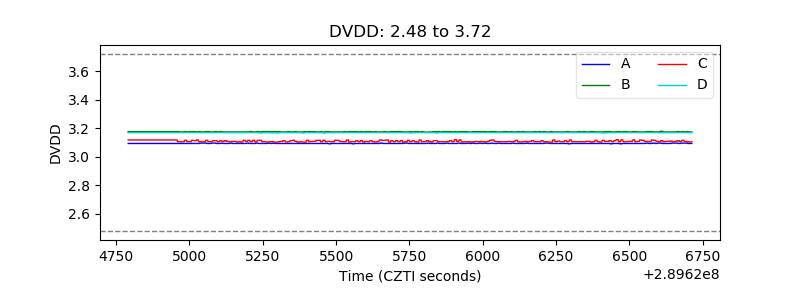 |
| Temperature 1 | 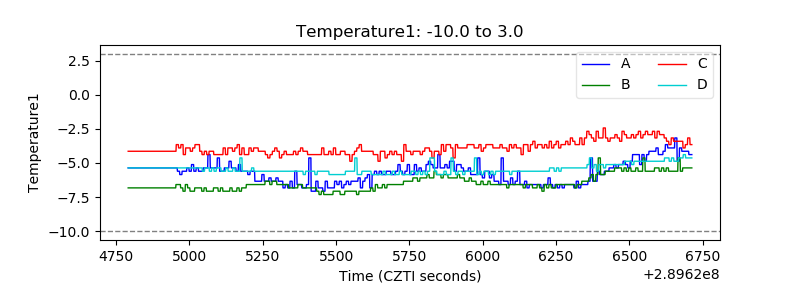 |
| Veto HV Monitor | 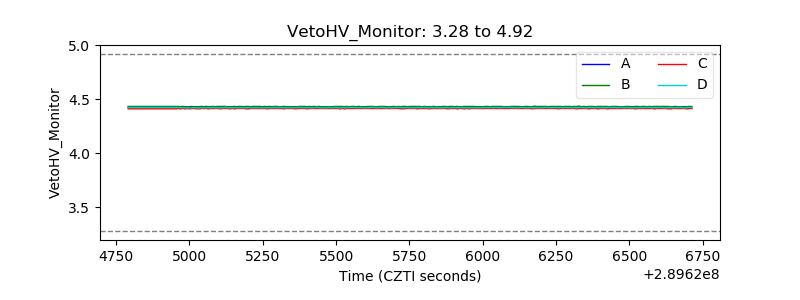 |
| Veto LLD | 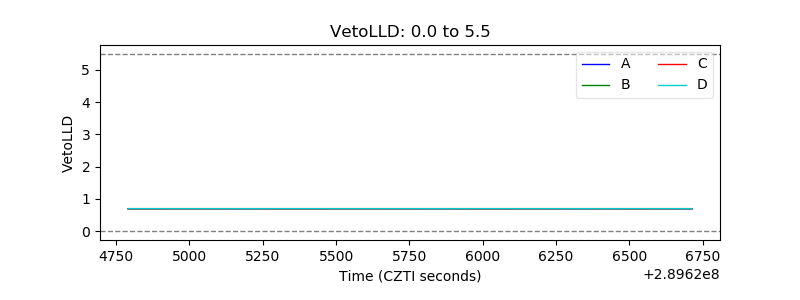 |
| Alpha Counter | 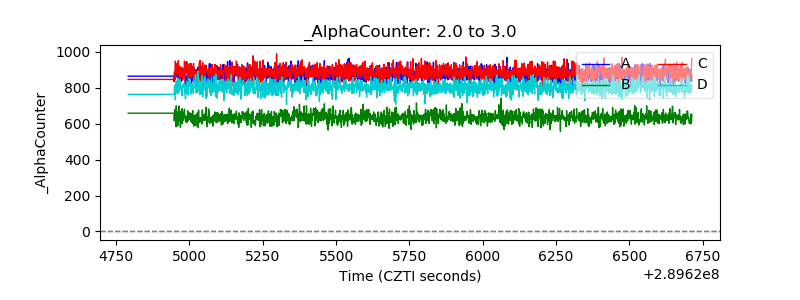 |
| _CPM_Rate | 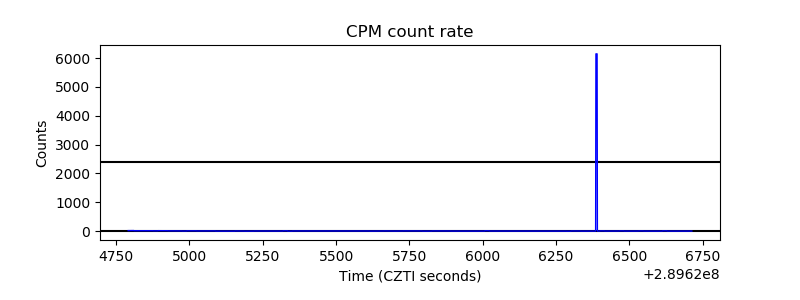 |
| CZT Counter | 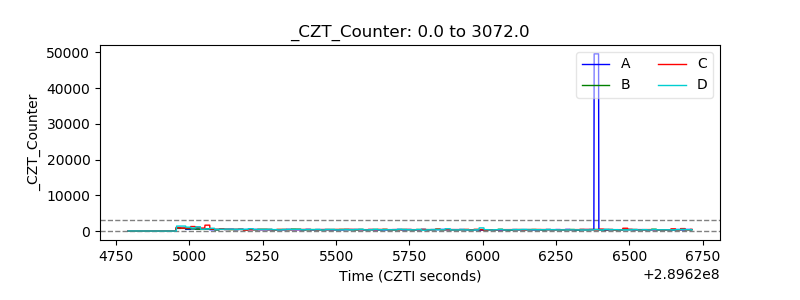 |
| +2.5 Volts monitor |  |
| +5 Volts monitor |  |
| _ROLL_ROT | 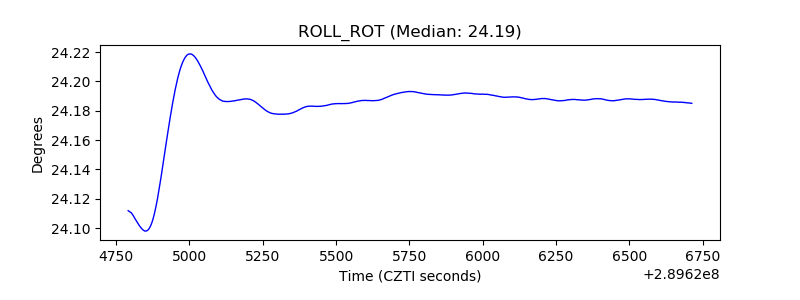 |
| _Roll_DEC | 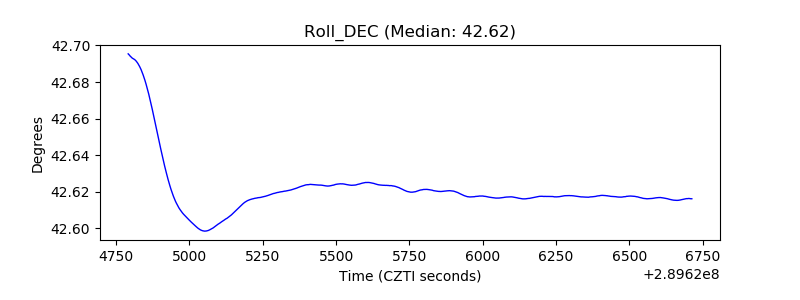 |
| _Roll_RA | 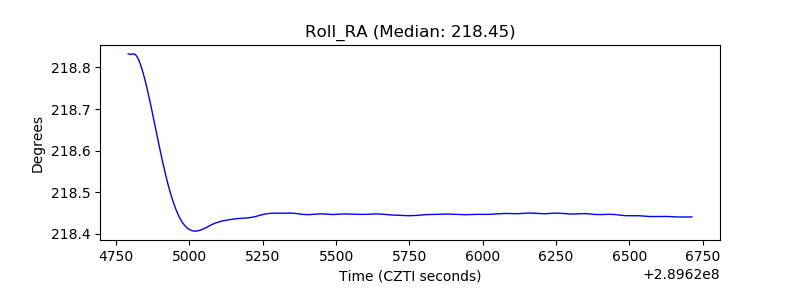 |
| Veto Counter |  |