| Param | Original file | Final file |
|---|---|---|
| Filename | modeM0/AS1A05_075T05_9000002764_18591cztM0_level2.evt | modeM0/AS1A05_075T05_9000002764_18591cztM0_level2_quad_clean.evt |
| Size (bytes) | 535,584,960 | 94,052,160 |
| Size | 510.8 MB | 89.7 MB |
| Events in quadrant A | 3,183,203 | 605,886 |
| Events in quadrant B | 3,264,955 | 621,519 |
| Events in quadrant C | 5,547,017 | 531,640 |
| Events in quadrant D | 3,742,478 | 594,032 |
| Mode M9 | |||
|---|---|---|---|
| Quadrant | BADHDUFLAG | Total packets | Discarded packets |
| A | 0 | 3 | 0 |
| B | 0 | 3 | 0 |
| C | 0 | 3 | 0 |
| D | 0 | 3 | 0 |
| Mode M0 | |||
|---|---|---|---|
| Quadrant | BADHDUFLAG | Total packets | Discarded packets |
| A | 0 | 14398 | 1 |
| B | 0 | 14496 | 1 |
| C | 0 | 21214 | 1 |
| D | 0 | 16015 | 1 |
| Mode SS | |||
|---|---|---|---|
| Quadrant | BADHDUFLAG | Total packets | Discarded packets |
| A | 0 | 146 | 0 |
| B | 0 | 146 | 0 |
| C | 0 | 146 | 0 |
| D | 0 | 146 | 0 |
| Quadrant | Total seconds | Saturated seconds | Saturation percentage |
|---|---|---|---|
| A | 7096 | 59 | 0.831454% |
| B | 7097 | 64 | 0.901789% |
| C | 7097 | 1061 | 14.949979% |
| D | 7097 | 73 | 1.028604% |
Noise dominated data is calculated using 1-second bins in cleaned event files. If a bin has >2000 counts, and if more than 50% of those come from <1% of pixels, then it is considered to be noise-dominated and hence unusable.
| Quadrant | # 1 sec bins | Bins with >0 counts | Bins with >2000 counts | High rate bins dominated by noise | Noise dominated (total time) | Noise dominated (detector-on time) | Marked lightcurve |
|---|---|---|---|---|---|---|---|
| A | 7436 | 7097 | 0 | 0 | 0.00% | 0.00% | 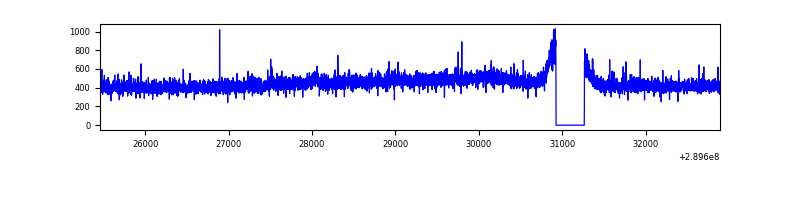 |
| B | 7437 | 7098 | 2 | 2 | 0.03% | 0.03% | 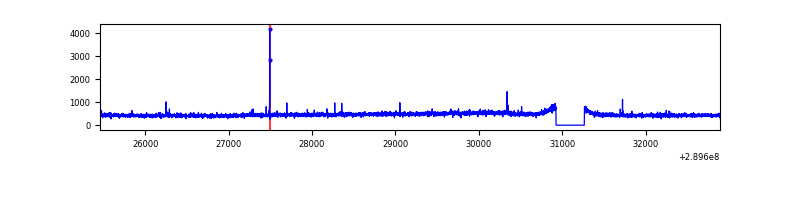 |
| C | 7436 | 7097 | 683 | 683 | 9.19% | 9.62% | 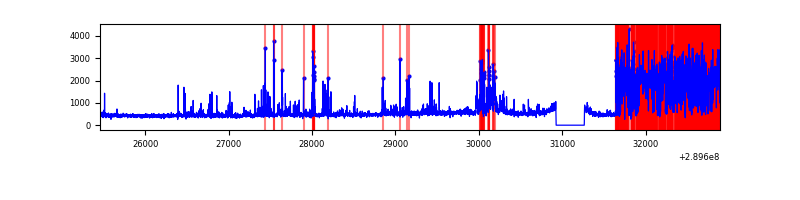 |
| D | 7437 | 7098 | 23 | 23 | 0.31% | 0.32% | 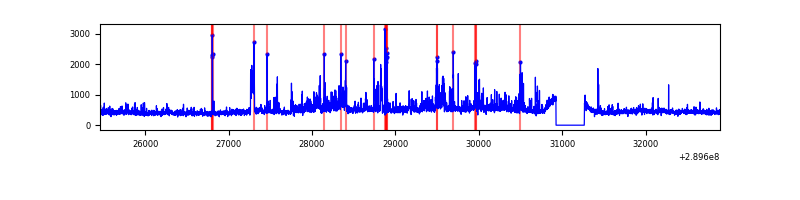 |
Top three noisy pixels from each quadrant. If the there are fewer than three noisy pixels in the level2.evt file, extra rows are filled as -1
| Pixel properties | Quadrant properties | ||||||
|---|---|---|---|---|---|---|---|
| Quadrant | DetID | PixID | Counts | Sigma | Mean | Median | Sigma |
| A | 13 | 254 | 11477 | 63.4 | 823 | 805 | 168.3 |
| A | 15 | 191 | 7289 | 38.52 | 823 | 805 | 168.3 |
| A | 0 | 226 | 7080 | 37.28 | 823 | 805 | 168.3 |
| B | 12 | 111 | 19354 | 117.13 | 823 | 802 | 158.4 |
| B | 11 | 111 | 17083 | 102.79 | 823 | 802 | 158.4 |
| B | 14 | 111 | 14986 | 89.55 | 823 | 802 | 158.4 |
| C | 4 | 254 | 2455931 | 14255.21 | 734 | 739 | 172.2 |
| C | 14 | 238 | 113184 | 652.87 | 734 | 739 | 172.2 |
| C | 3 | 233 | 80311 | 462.01 | 734 | 739 | 172.2 |
| D | 1 | 52 | 385567 | 1970.76 | 800 | 775 | 195.3 |
| D | 5 | 222 | 112657 | 573.02 | 800 | 775 | 195.3 |
| D | 7 | 238 | 104850 | 533.03 | 800 | 775 | 195.3 |
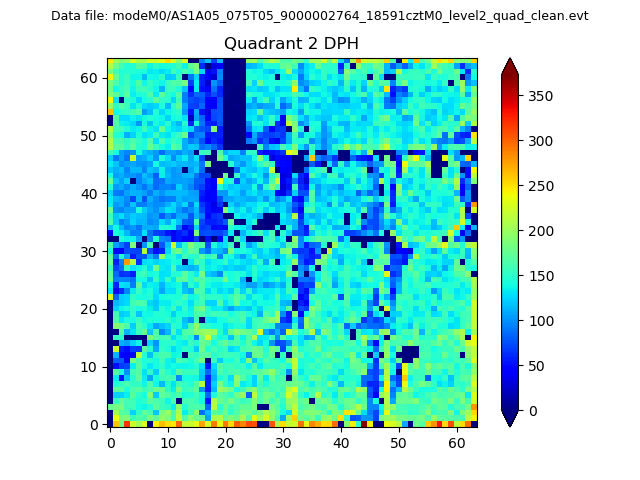
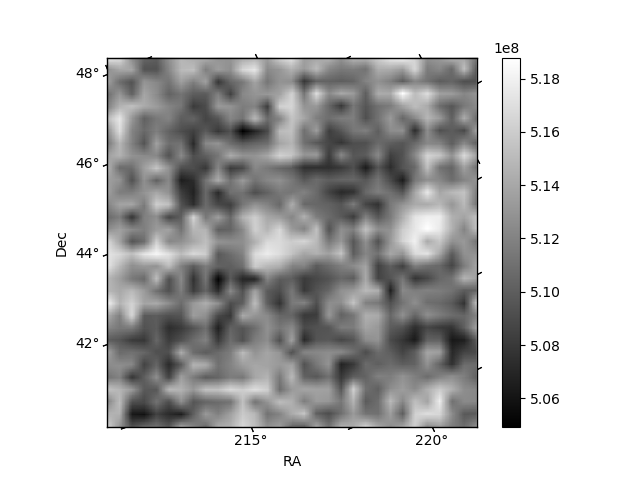
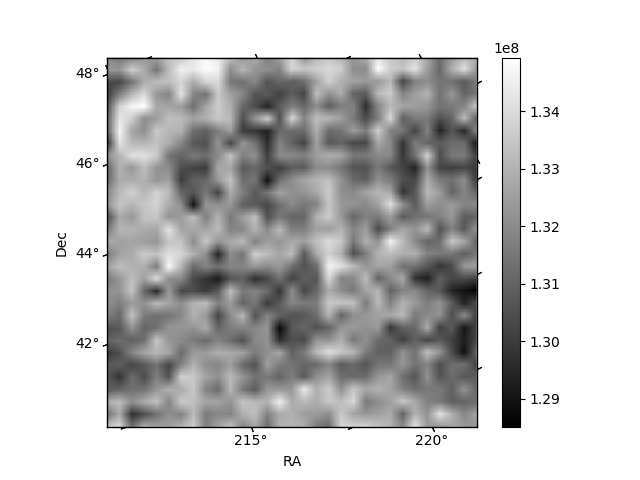
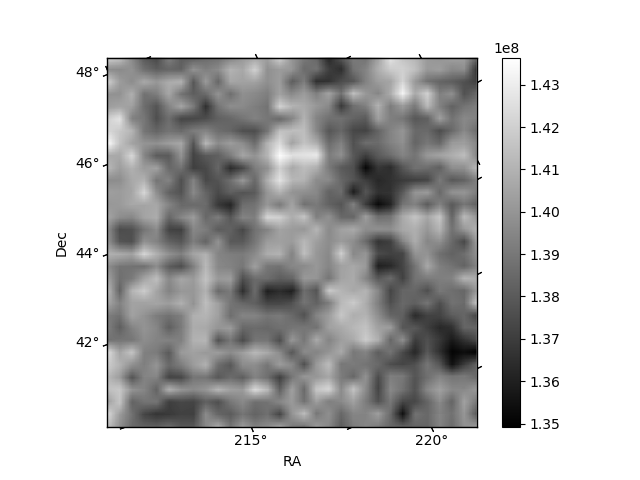
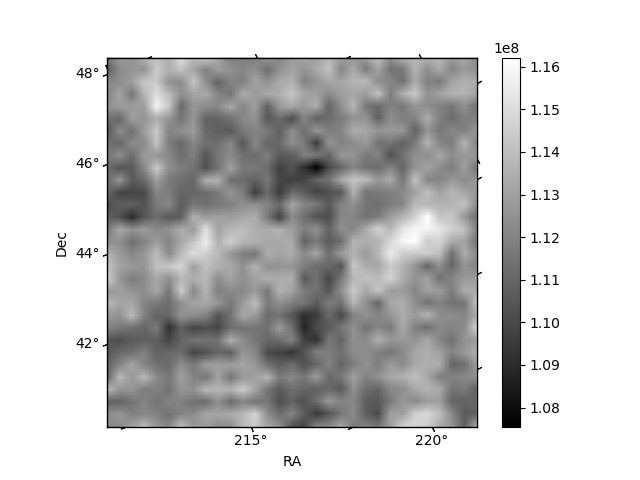
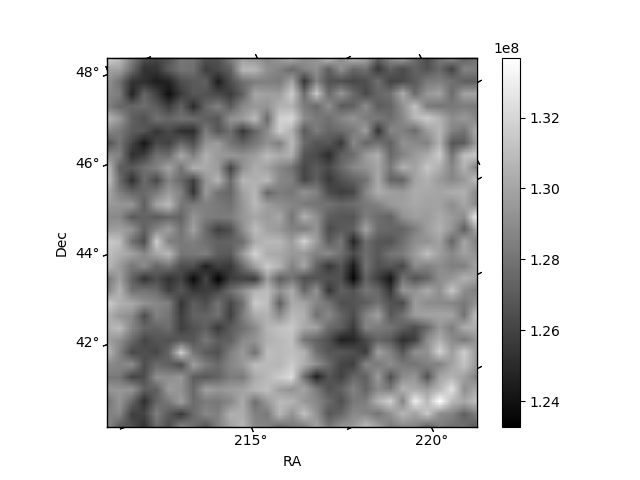
Histogram calculated using DETX and DETY for each event in the final _common_clean file
| Quadrant A | 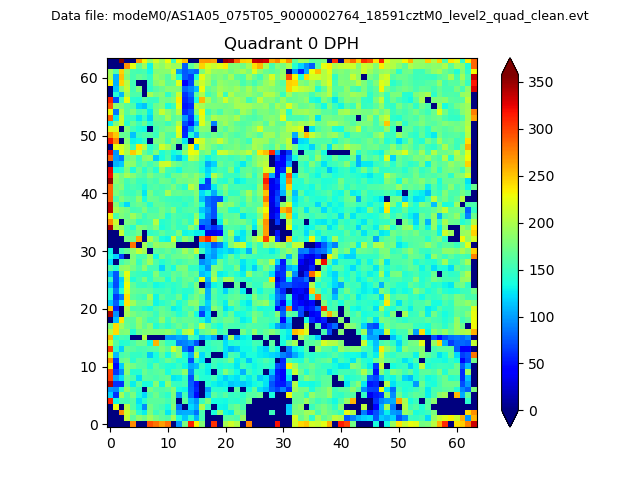 |
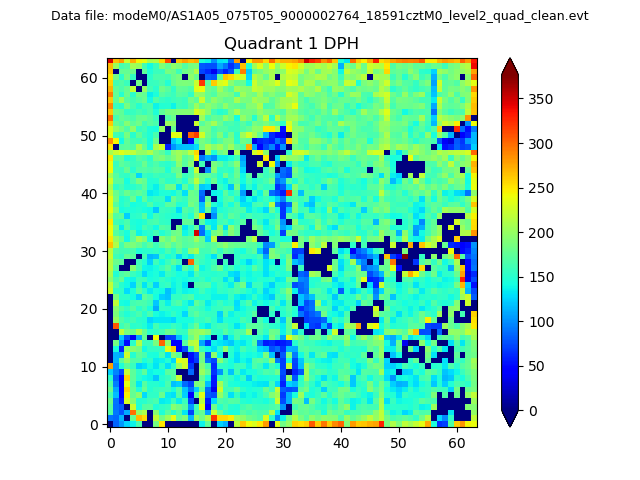 |
Quadrant B |
|---|---|---|---|
| Quadrant D | 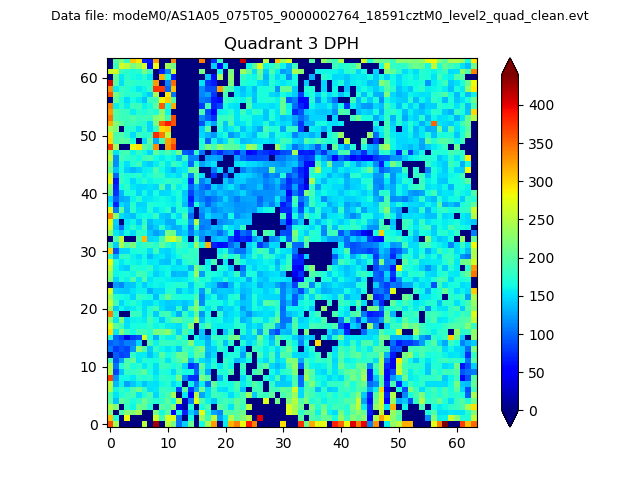 |
 |
Quadrant C |
| Plot type | Count rate plots | Images |
|---|---|---|
| Comparison with Poisson distribution Blue bars denote a histogram of data divided into 1 sec bins. Red curve is a Poisson curve with rate = median count rate of data. |
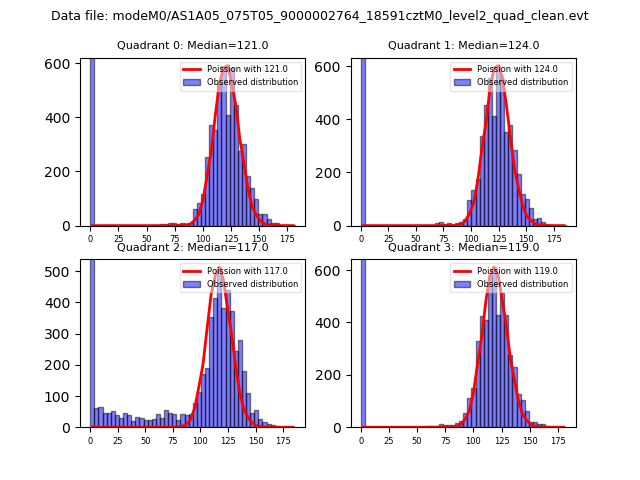 |
 |
| Quadrant-wise count rates Data is divided into 100 sec bins |
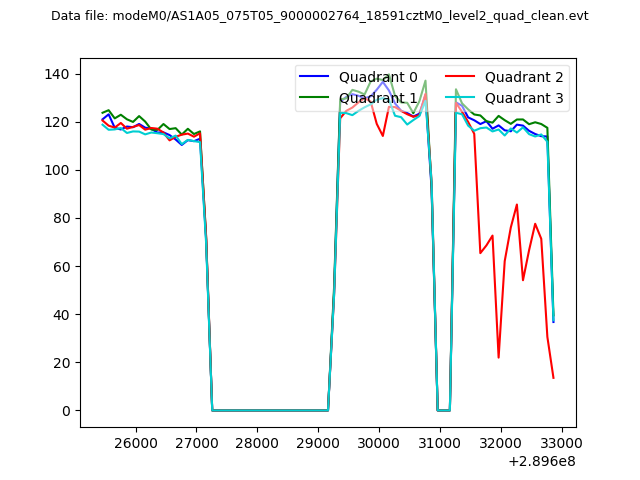 |
|
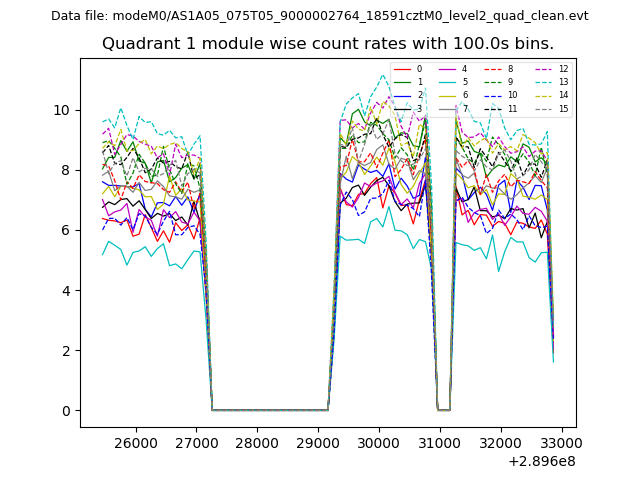
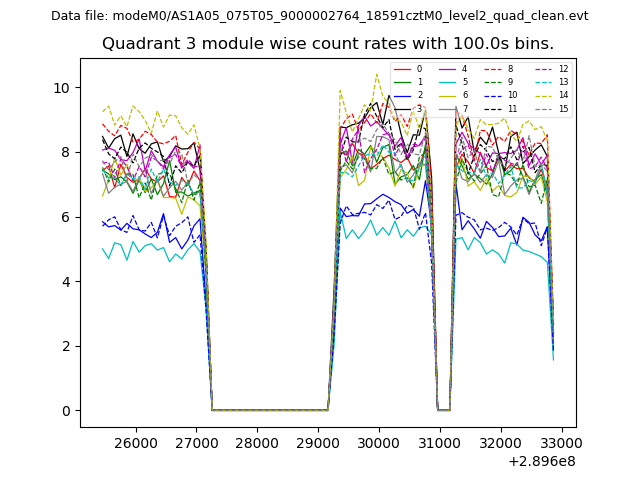
| Module-wise count rates for Quadrant A Data is divided into 100 sec bins |
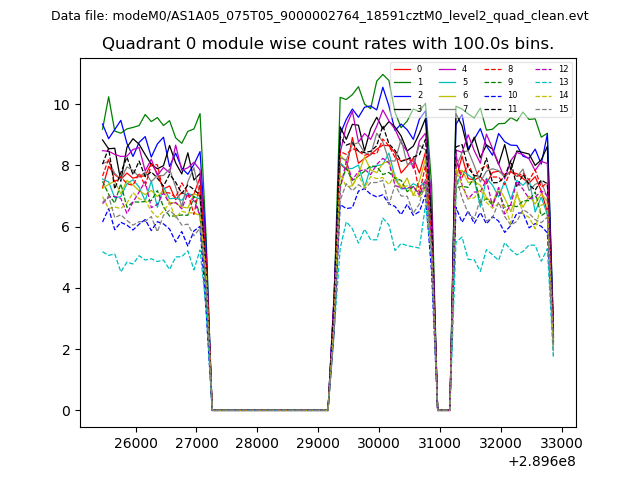 |
 |
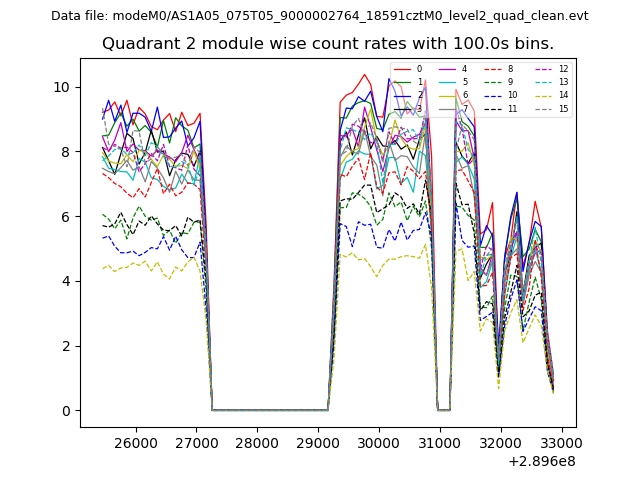
| Module-wise count rates for Quadrant B Data is divided into 100 sec bins |
 |
 |
| Module-wise count rates for Quadrant C Data is divided into 100 sec bins |
 |
 |
| Module-wise count rates for Quadrant D Data is divided into 100 sec bins |
 |
 |
| Parameter | Plot |
|---|---|
| CZT HV Monitor | 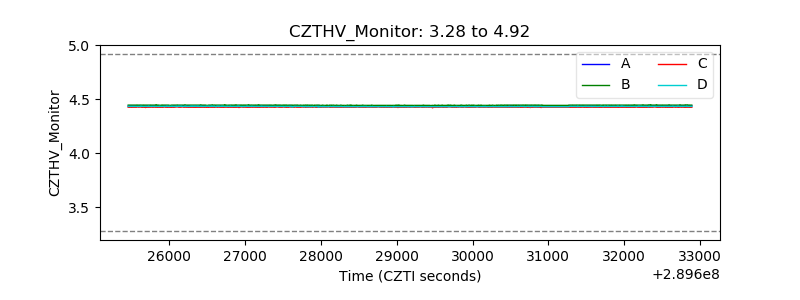 |
| D_VDD | 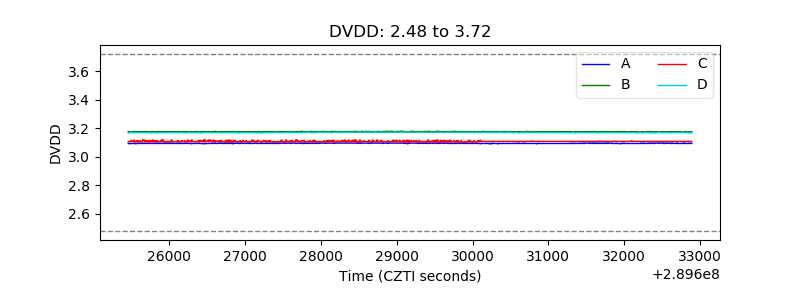 |
| Temperature 1 | 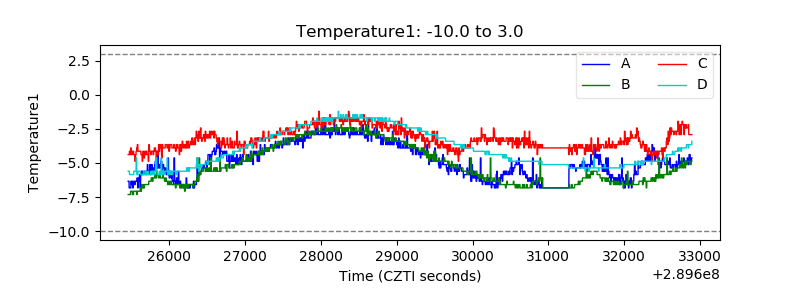 |
| Veto HV Monitor | 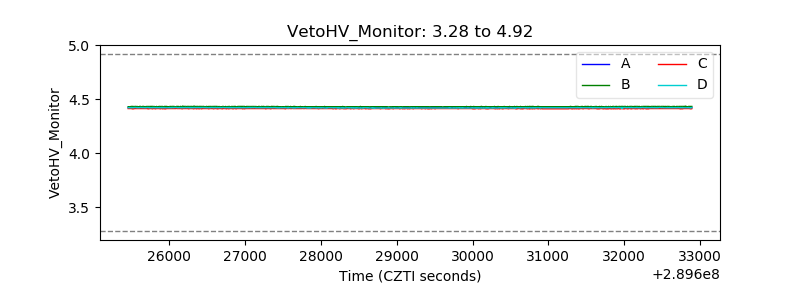 |
| Veto LLD | 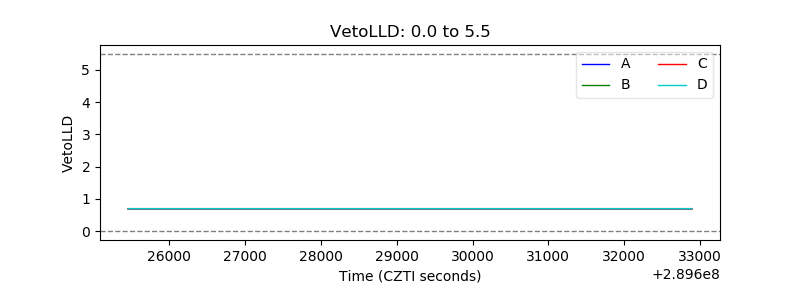 |
| Alpha Counter | 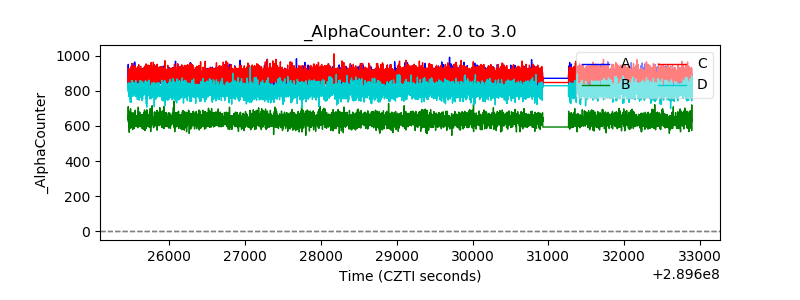 |
| _CPM_Rate | 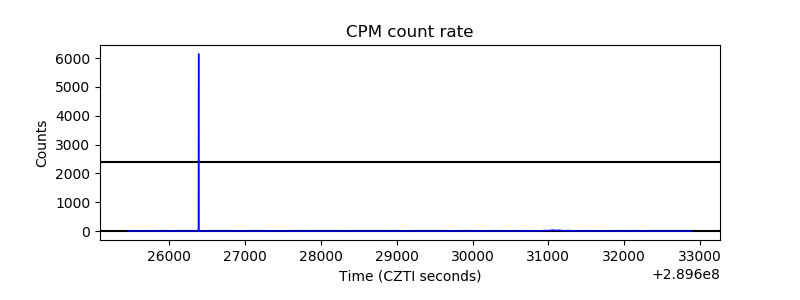 |
| CZT Counter | 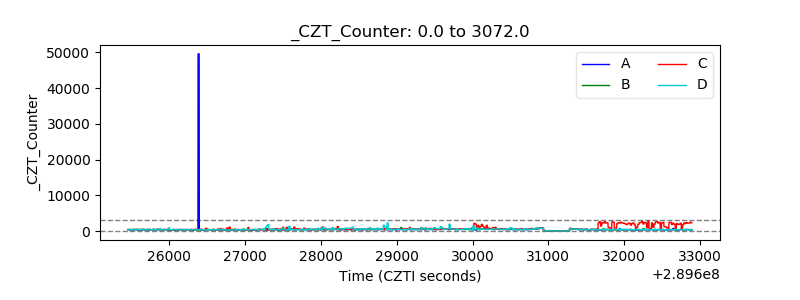 |
| +2.5 Volts monitor | 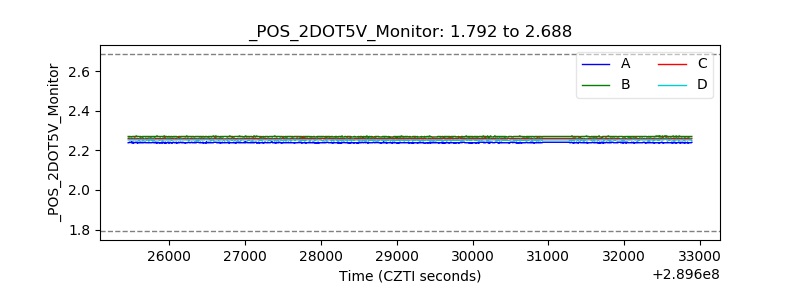 |
| +5 Volts monitor |  |
| _ROLL_ROT | 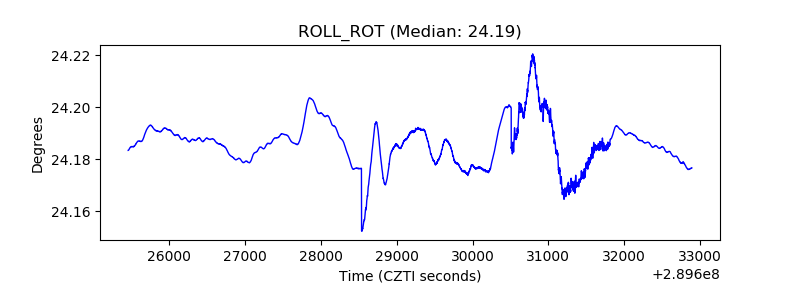 |
| _Roll_DEC | 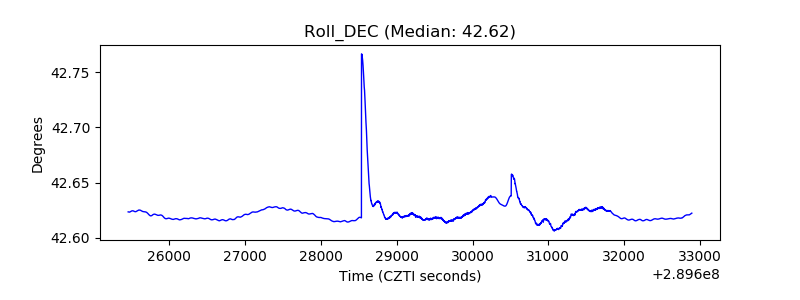 |
| _Roll_RA | 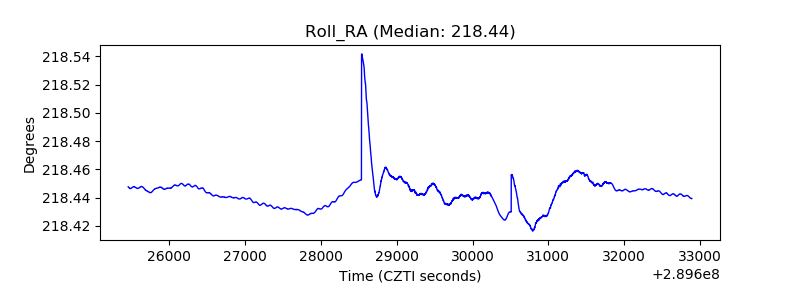 |
| Veto Counter |  |