| Param | Original file | Final file |
|---|---|---|
| Filename | modeM0/AS1A05_075T05_9000002764_18593cztM0_level2.evt | modeM0/AS1A05_075T05_9000002764_18593cztM0_level2_quad_clean.evt |
| Size (bytes) | 956,485,440 | 146,517,120 |
| Size | 912.2 MB | 139.7 MB |
| Events in quadrant A | 5,638,831 | 918,678 |
| Events in quadrant B | 5,779,123 | 940,921 |
| Events in quadrant C | 9,119,082 | 834,866 |
| Events in quadrant D | 7,592,903 | 887,008 |
| Mode M9 | |||
|---|---|---|---|
| Quadrant | BADHDUFLAG | Total packets | Discarded packets |
| A | 0 | 14 | 0 |
| B | 0 | 14 | 0 |
| C | 0 | 14 | 0 |
| D | 0 | 14 | 0 |
| Mode M0 | |||
|---|---|---|---|
| Quadrant | BADHDUFLAG | Total packets | Discarded packets |
| A | 0 | 24983 | 2 |
| B | 0 | 25172 | 2 |
| C | 0 | 34803 | 2 |
| D | 0 | 30630 | 3 |
| Mode SS | |||
|---|---|---|---|
| Quadrant | BADHDUFLAG | Total packets | Discarded packets |
| A | 0 | 250 | 0 |
| B | 0 | 250 | 0 |
| C | 0 | 250 | 0 |
| D | 0 | 250 | 0 |
| Quadrant | Total seconds | Saturated seconds | Saturation percentage |
|---|---|---|---|
| A | 12378 | 51 | 0.412021% |
| B | 12378 | 52 | 0.420100% |
| C | 12378 | 1620 | 13.087736% |
| D | 12377 | 330 | 2.666236% |
Noise dominated data is calculated using 1-second bins in cleaned event files. If a bin has >2000 counts, and if more than 50% of those come from <1% of pixels, then it is considered to be noise-dominated and hence unusable.
| Quadrant | # 1 sec bins | Bins with >0 counts | Bins with >2000 counts | High rate bins dominated by noise | Noise dominated (total time) | Noise dominated (detector-on time) | Marked lightcurve |
|---|---|---|---|---|---|---|---|
| A | 13708 | 12380 | 0 | 0 | 0.00% | 0.00% | 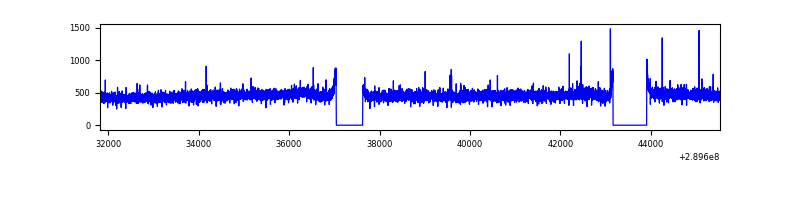 |
| B | 13708 | 12380 | 1 | 1 | 0.01% | 0.01% | 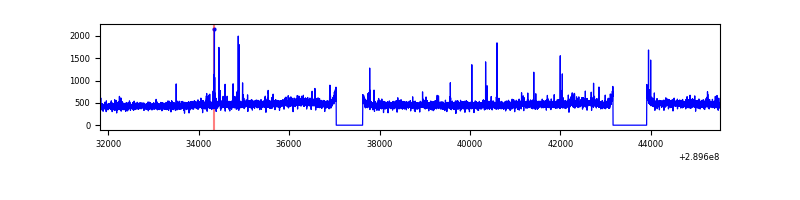 |
| C | 13708 | 12380 | 1226 | 1226 | 8.94% | 9.90% | 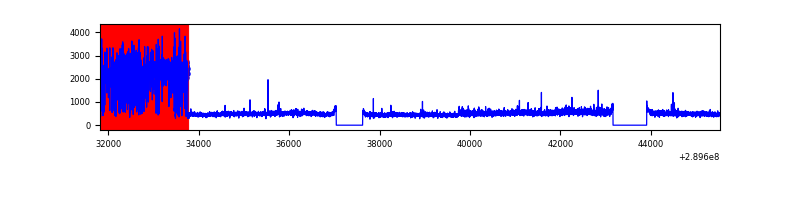 |
| D | 13707 | 12379 | 241 | 241 | 1.76% | 1.95% | 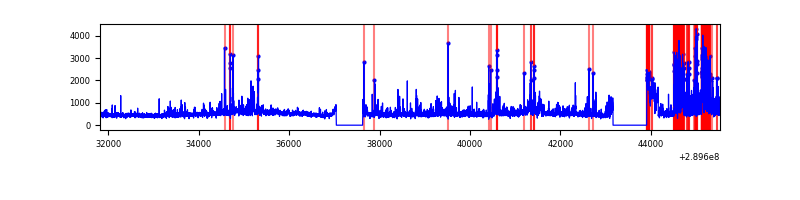 |
Top three noisy pixels from each quadrant. If the there are fewer than three noisy pixels in the level2.evt file, extra rows are filled as -1
| Pixel properties | Quadrant properties | ||||||
|---|---|---|---|---|---|---|---|
| Quadrant | DetID | PixID | Counts | Sigma | Mean | Median | Sigma |
| A | 13 | 254 | 20284 | 63.98 | 1455 | 1421 | 294.8 |
| A | 0 | 13 | 14857 | 45.57 | 1455 | 1421 | 294.8 |
| A | 0 | 226 | 12606 | 37.93 | 1455 | 1421 | 294.8 |
| B | 0 | 229 | 35102 | 121.13 | 1451 | 1410 | 278.2 |
| B | 12 | 111 | 34243 | 118.04 | 1451 | 1410 | 278.2 |
| B | 11 | 111 | 29642 | 101.5 | 1451 | 1410 | 278.2 |
| C | 4 | 254 | 3507629 | 11541.28 | 1293 | 1300 | 303.8 |
| C | 3 | 233 | 354650 | 1163.07 | 1293 | 1300 | 303.8 |
| C | 14 | 238 | 200679 | 656.27 | 1293 | 1300 | 303.8 |
| D | 1 | 52 | 864155 | 2533.15 | 1402 | 1361 | 340.6 |
| D | 7 | 238 | 726951 | 2130.32 | 1402 | 1361 | 340.6 |
| D | 10 | 50 | 397209 | 1162.2 | 1402 | 1361 | 340.6 |
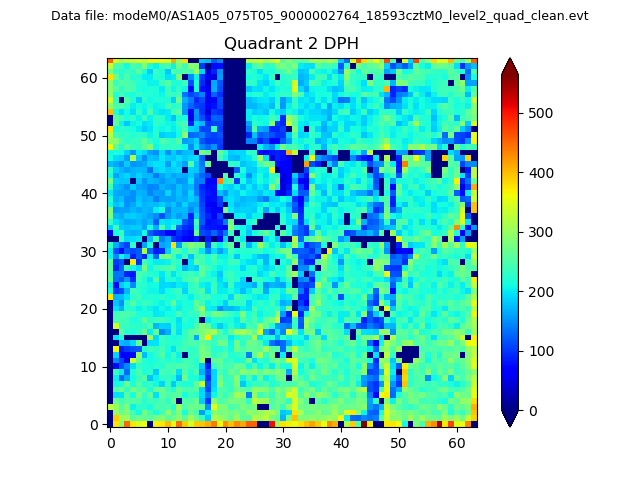
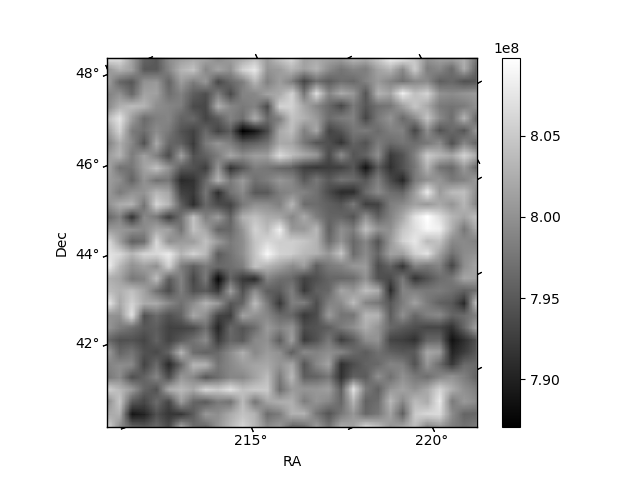
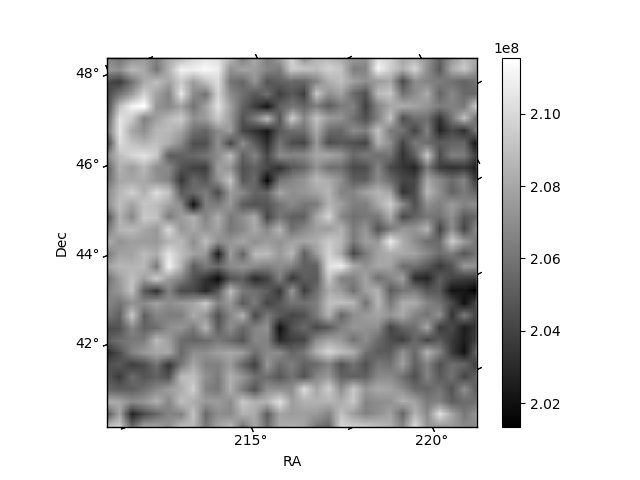
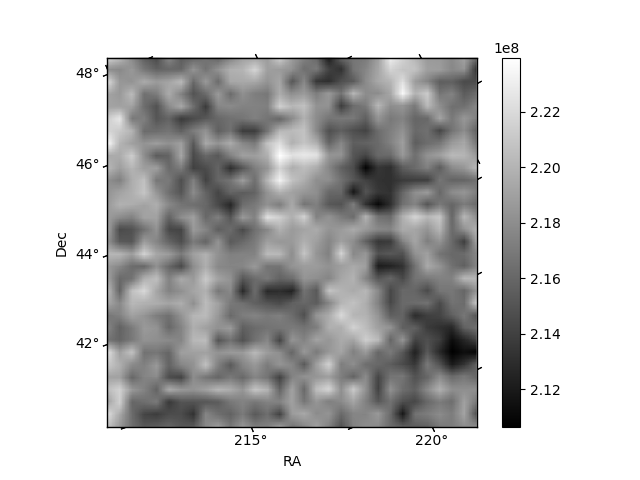
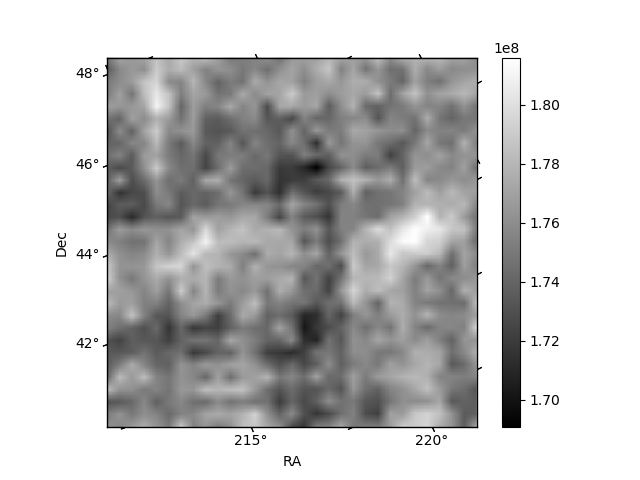
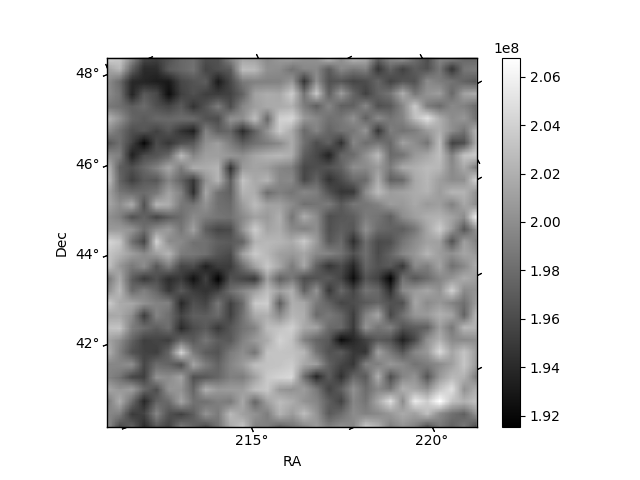
Histogram calculated using DETX and DETY for each event in the final _common_clean file
| Quadrant A | 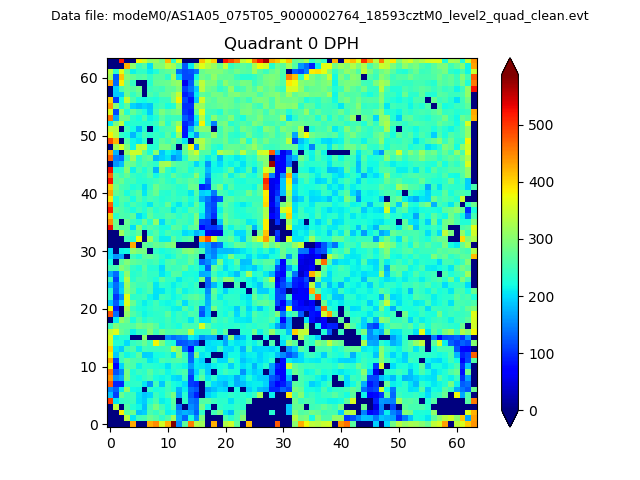 |
 |
Quadrant B |
|---|---|---|---|
| Quadrant D | 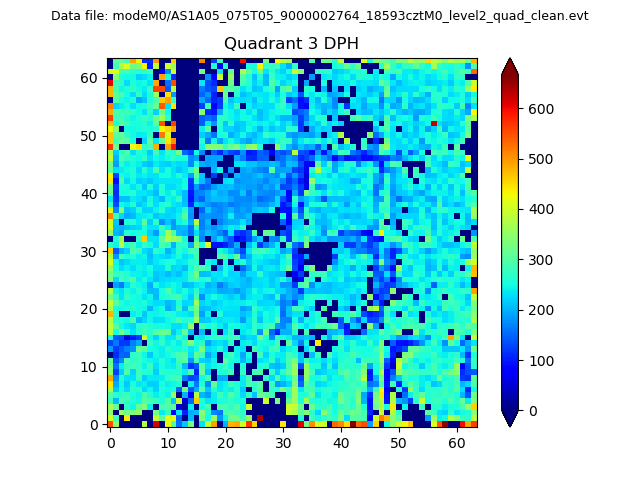 |
 |
Quadrant C |
| Plot type | Count rate plots | Images |
|---|---|---|
| Comparison with Poisson distribution Blue bars denote a histogram of data divided into 1 sec bins. Red curve is a Poisson curve with rate = median count rate of data. |
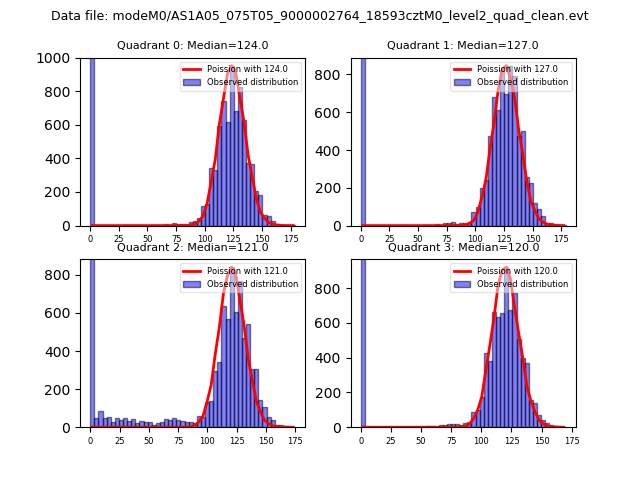 |
 |
| Quadrant-wise count rates Data is divided into 100 sec bins |
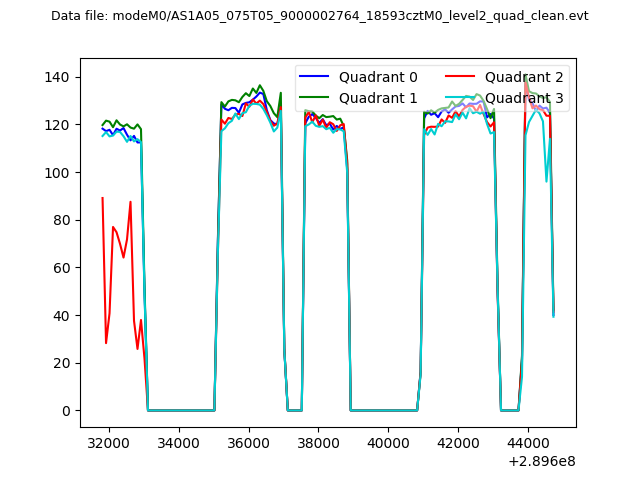 |
|
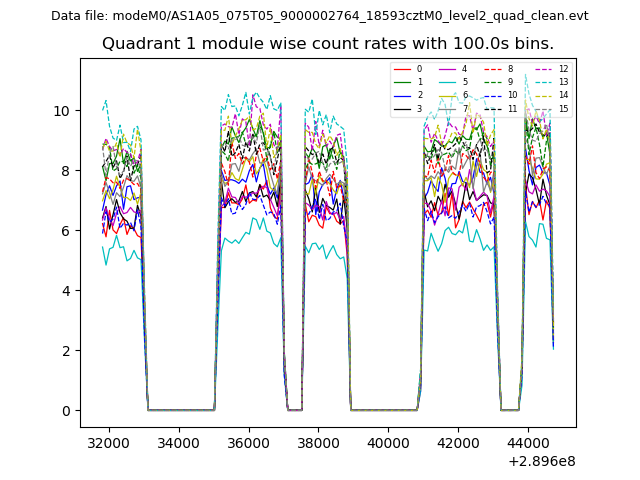
| Module-wise count rates for Quadrant A Data is divided into 100 sec bins |
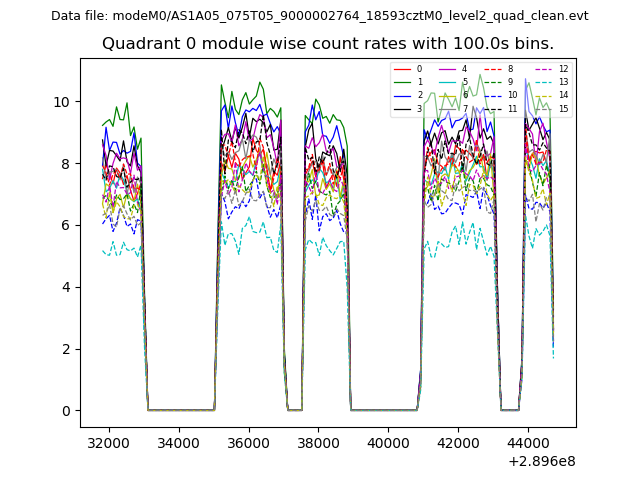 |
 |
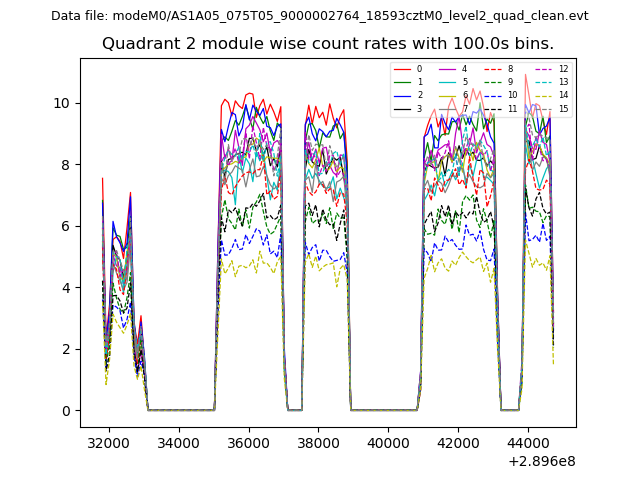
| Module-wise count rates for Quadrant B Data is divided into 100 sec bins |
 |
 |
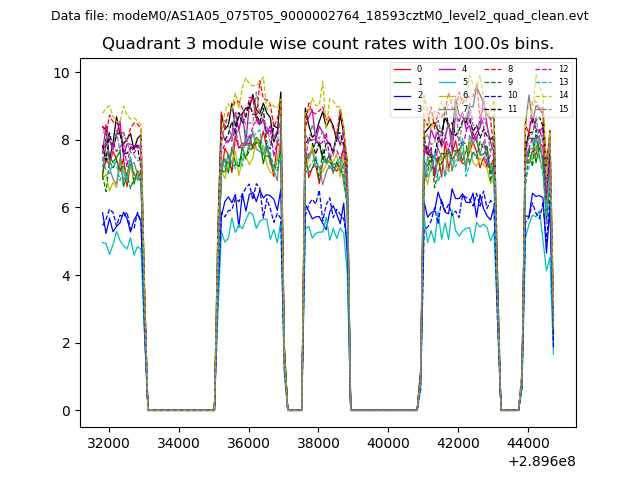
| Module-wise count rates for Quadrant C Data is divided into 100 sec bins |
 |
 |
| Module-wise count rates for Quadrant D Data is divided into 100 sec bins |
 |
 |
| Parameter | Plot |
|---|---|
| CZT HV Monitor | 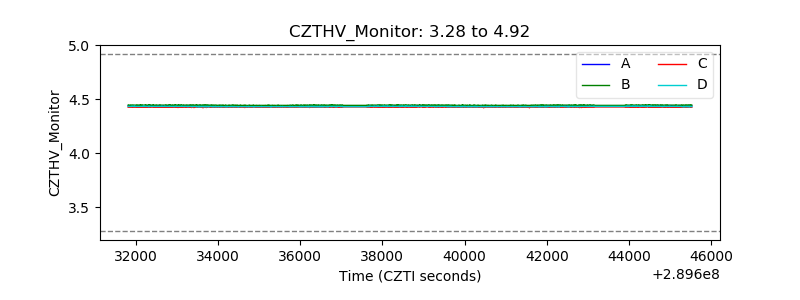 |
| D_VDD | 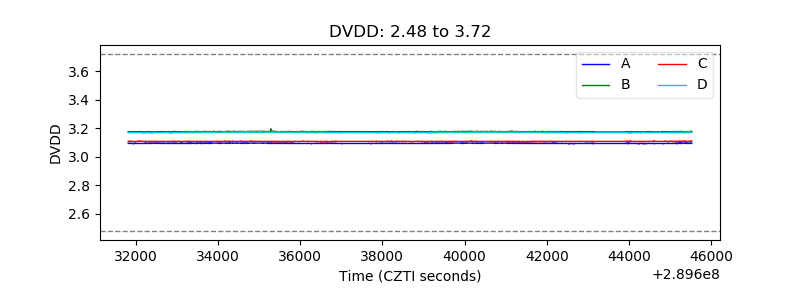 |
| Temperature 1 | 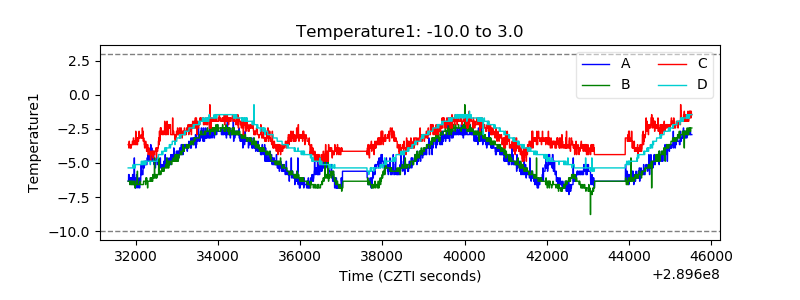 |
| Veto HV Monitor | 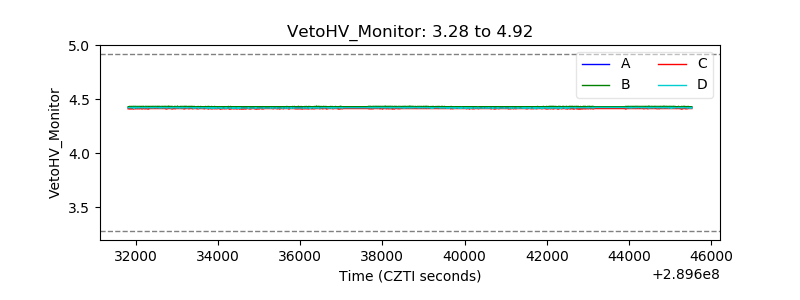 |
| Veto LLD | 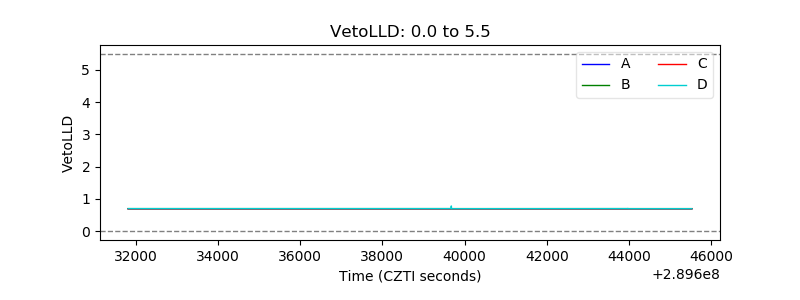 |
| Alpha Counter | 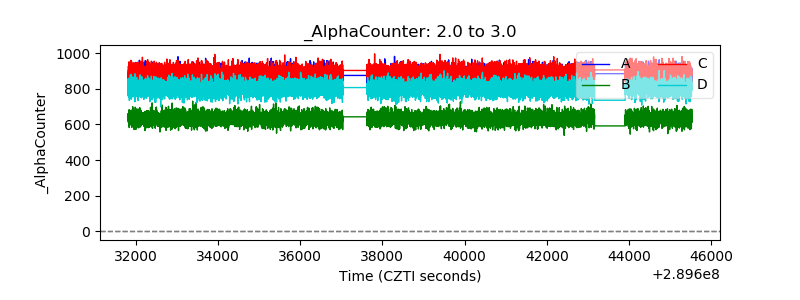 |
| _CPM_Rate | 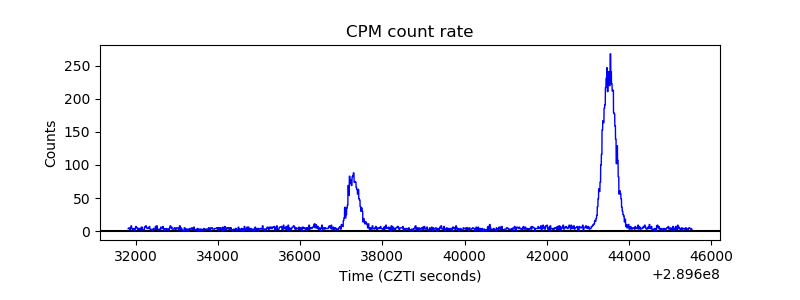 |
| CZT Counter | 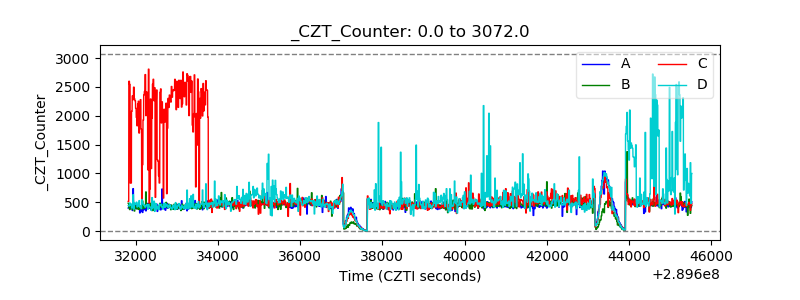 |
| +2.5 Volts monitor |  |
| +5 Volts monitor |  |
| _ROLL_ROT | 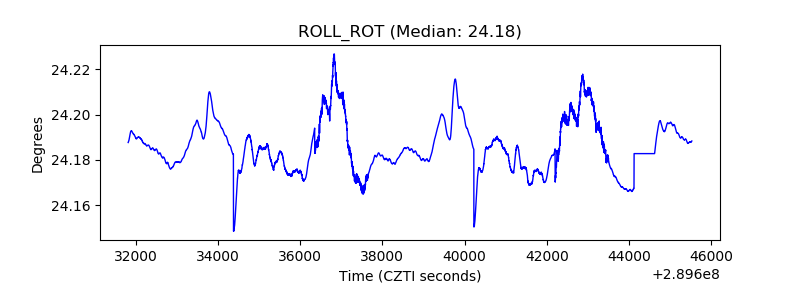 |
| _Roll_DEC |  |
| _Roll_RA | 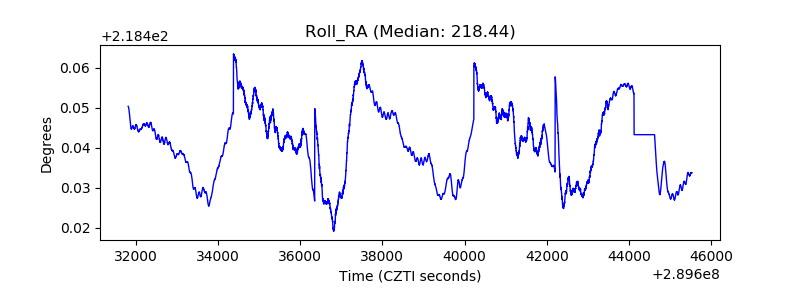 |
| Veto Counter | 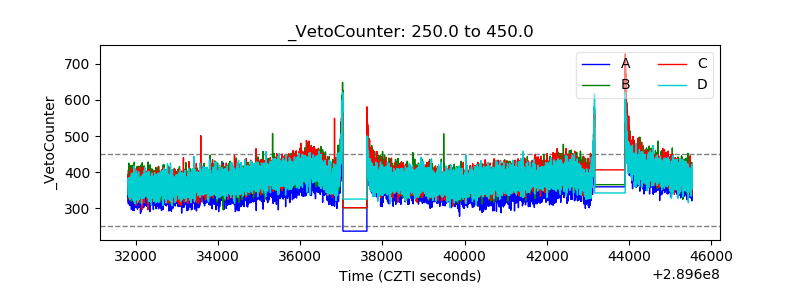 |