| Param | Original file | Final file |
|---|---|---|
| Filename | modeM0/AS1A05_075T05_9000002764_18594cztM0_level2.evt | modeM0/AS1A05_075T05_9000002764_18594cztM0_level2_quad_clean.evt |
| Size (bytes) | 1,747,932,480 | 273,775,680 |
| Size | 1.6 GB | 261.1 MB |
| Events in quadrant A | 11,421,461 | 1,696,630 |
| Events in quadrant B | 10,882,120 | 1,746,595 |
| Events in quadrant C | 15,049,448 | 1,601,978 |
| Events in quadrant D | 14,019,375 | 1,652,378 |
| Mode M9 | |||
|---|---|---|---|
| Quadrant | BADHDUFLAG | Total packets | Discarded packets |
| A | 0 | 20 | 0 |
| B | 0 | 20 | 0 |
| C | 0 | 20 | 0 |
| D | 0 | 20 | 0 |
| Mode M0 | |||
|---|---|---|---|
| Quadrant | BADHDUFLAG | Total packets | Discarded packets |
| A | 0 | 49458 | 4 |
| B | 0 | 47346 | 4 |
| C | 0 | 59346 | 4 |
| D | 0 | 57128 | 4 |
| Mode SS | |||
|---|---|---|---|
| Quadrant | BADHDUFLAG | Total packets | Discarded packets |
| A | 0 | 472 | 0 |
| B | 0 | 472 | 0 |
| C | 0 | 472 | 0 |
| D | 0 | 472 | 0 |
| Quadrant | Total seconds | Saturated seconds | Saturation percentage |
|---|---|---|---|
| A | 23153 | 400 | 1.727638% |
| B | 23153 | 168 | 0.725608% |
| C | 23153 | 1998 | 8.629551% |
| D | 23153 | 565 | 2.440289% |
Noise dominated data is calculated using 1-second bins in cleaned event files. If a bin has >2000 counts, and if more than 50% of those come from <1% of pixels, then it is considered to be noise-dominated and hence unusable.
| Quadrant | # 1 sec bins | Bins with >0 counts | Bins with >2000 counts | High rate bins dominated by noise | Noise dominated (total time) | Noise dominated (detector-on time) | Marked lightcurve |
|---|---|---|---|---|---|---|---|
| A | 26662 | 23156 | 186 | 186 | 0.70% | 0.80% | 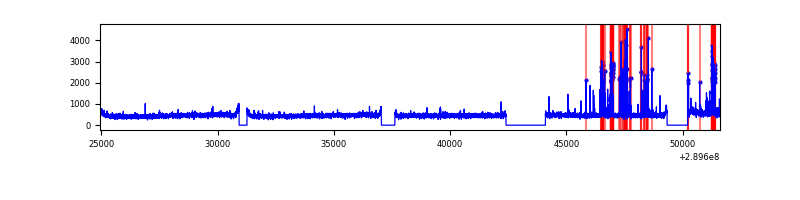 |
| B | 26662 | 23156 | 6 | 6 | 0.02% | 0.03% | 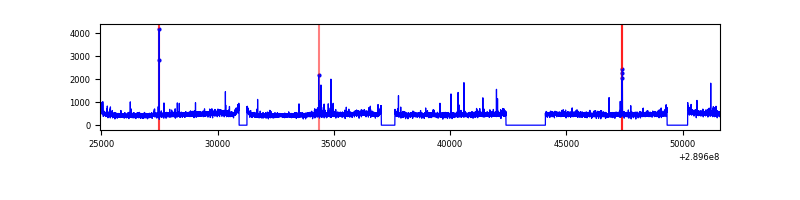 |
| C | 26662 | 23156 | 1343 | 1343 | 5.04% | 5.80% | 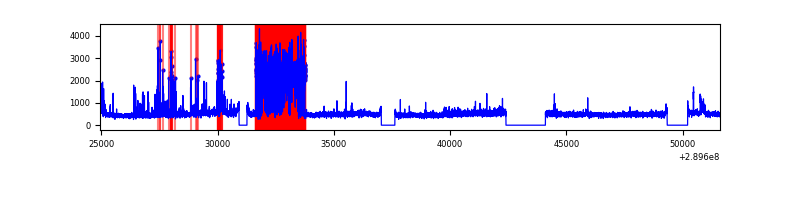 |
| D | 26662 | 23156 | 390 | 390 | 1.46% | 1.68% | 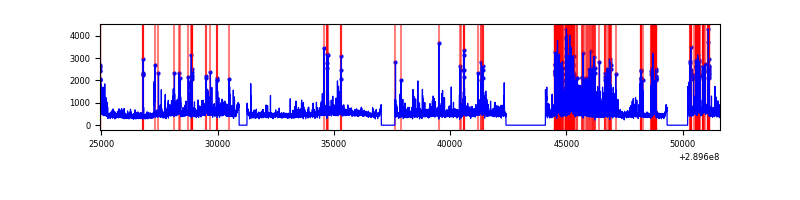 |
Top three noisy pixels from each quadrant. If the there are fewer than three noisy pixels in the level2.evt file, extra rows are filled as -1
| Pixel properties | Quadrant properties | ||||||
|---|---|---|---|---|---|---|---|
| Quadrant | DetID | PixID | Counts | Sigma | Mean | Median | Sigma |
| A | 0 | 13 | 887108 | 1613.2 | 2725 | 2664 | 548.3 |
| A | 13 | 254 | 36519 | 61.75 | 2725 | 2664 | 548.3 |
| A | 0 | 226 | 23573 | 38.14 | 2725 | 2664 | 548.3 |
| B | 12 | 111 | 63872 | 117.42 | 2732 | 2657 | 521.3 |
| B | 0 | 229 | 58962 | 108.0 | 2732 | 2657 | 521.3 |
| B | 11 | 111 | 56169 | 102.65 | 2732 | 2657 | 521.3 |
| C | 4 | 254 | 4281327 | 7280.28 | 2517 | 2527 | 587.7 |
| C | 3 | 233 | 513774 | 869.87 | 2517 | 2527 | 587.7 |
| C | 14 | 238 | 391092 | 661.13 | 2517 | 2527 | 587.7 |
| D | 1 | 52 | 1425758 | 2229.46 | 2647 | 2570 | 638.4 |
| D | 7 | 238 | 1247645 | 1950.44 | 2647 | 2570 | 638.4 |
| D | 5 | 222 | 966392 | 1509.85 | 2647 | 2570 | 638.4 |
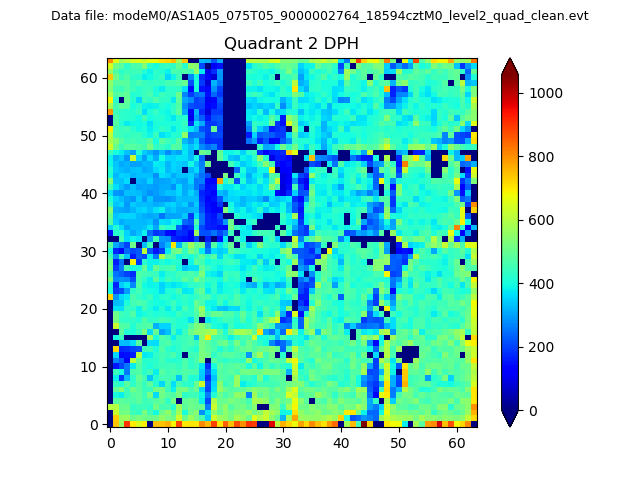
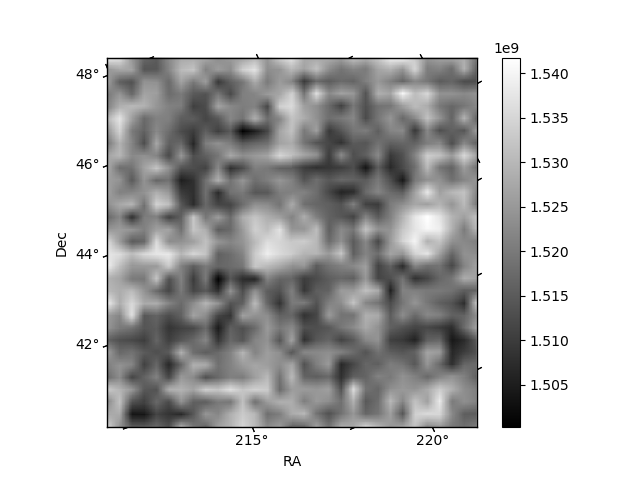
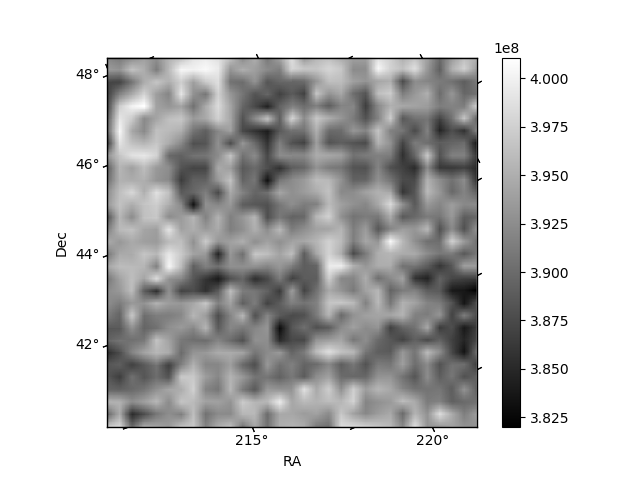
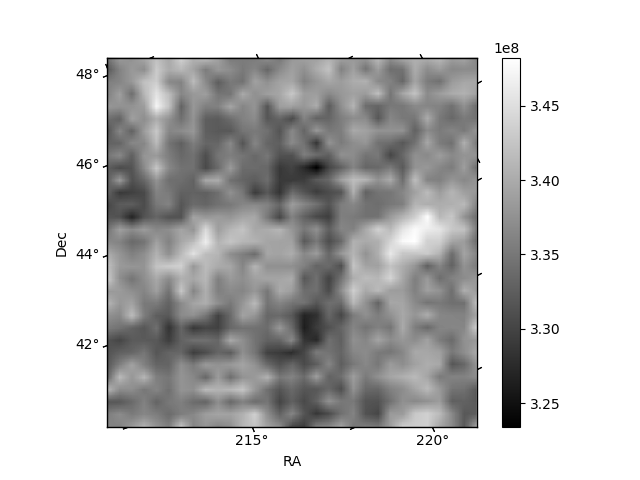
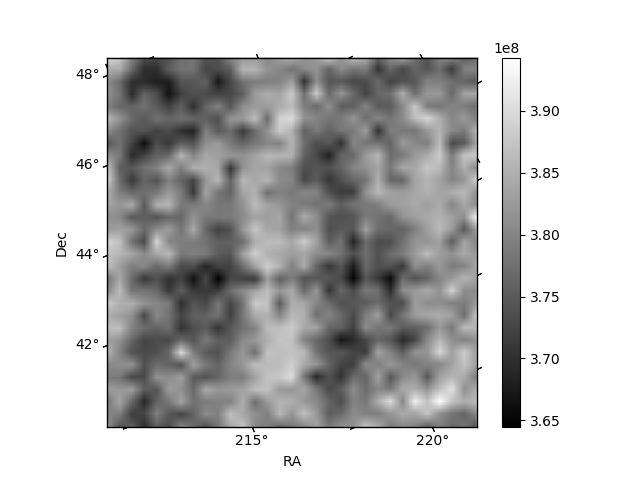
Histogram calculated using DETX and DETY for each event in the final _common_clean file
| Quadrant A | 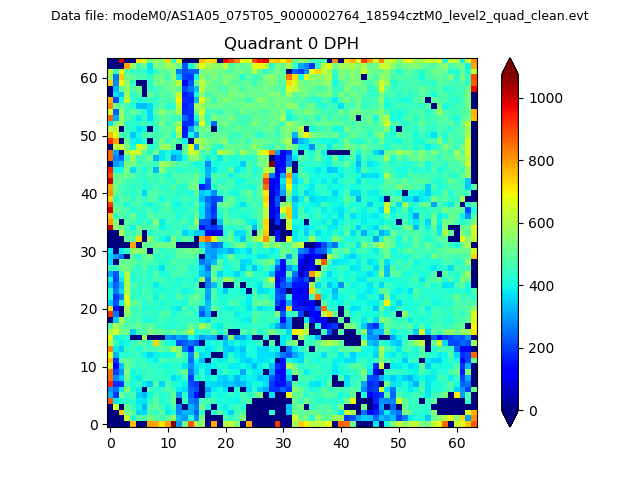 |
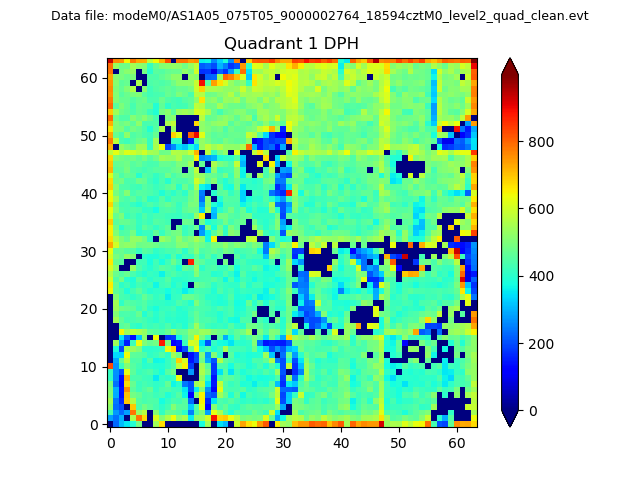 |
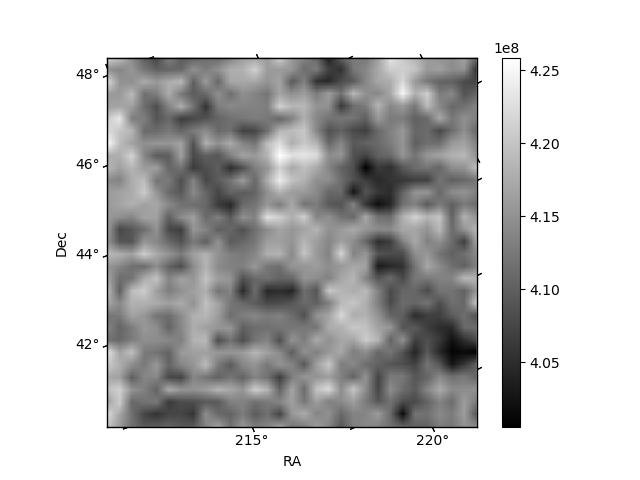
Quadrant B |
|---|---|---|---|
| Quadrant D | 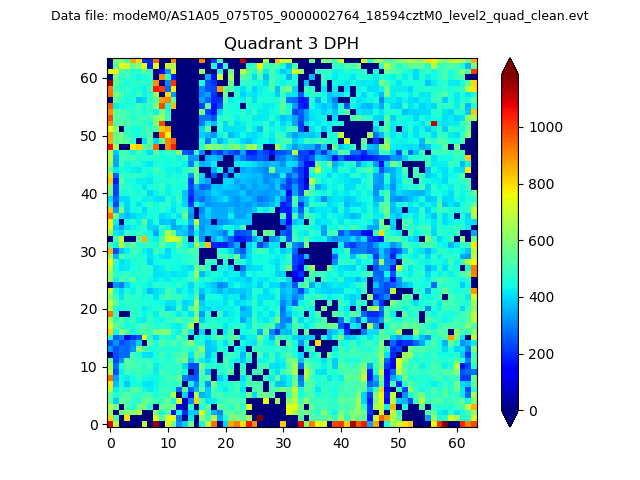 |
 |
Quadrant C |
| Plot type | Count rate plots | Images |
|---|---|---|
| Comparison with Poisson distribution Blue bars denote a histogram of data divided into 1 sec bins. Red curve is a Poisson curve with rate = median count rate of data. |
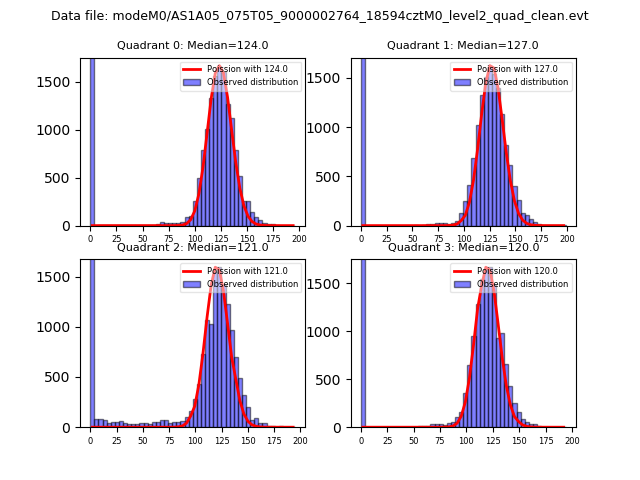 |
 |
| Quadrant-wise count rates Data is divided into 100 sec bins |
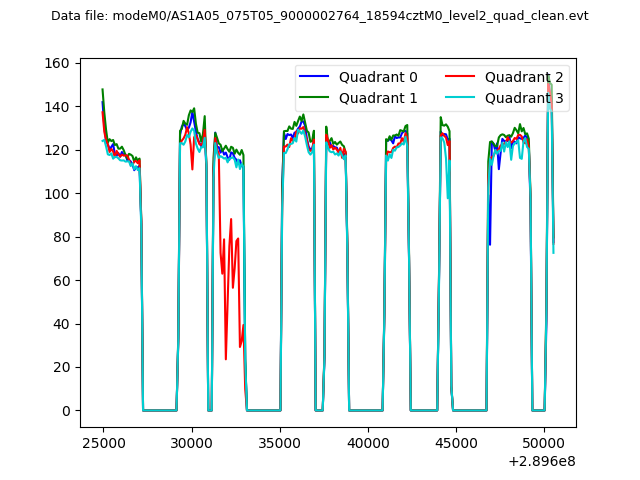 |
|
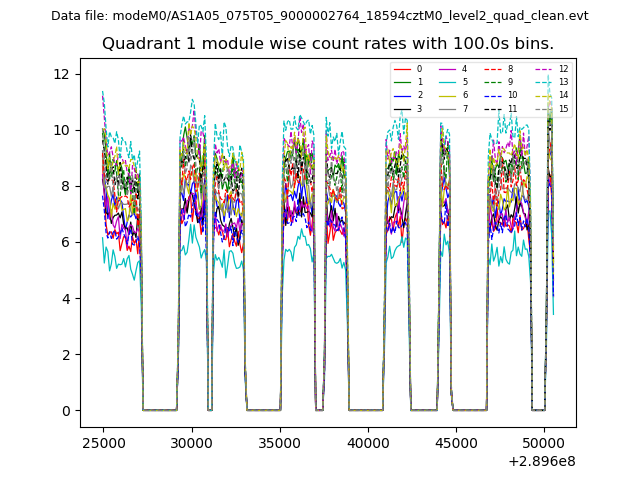
| Module-wise count rates for Quadrant A Data is divided into 100 sec bins |
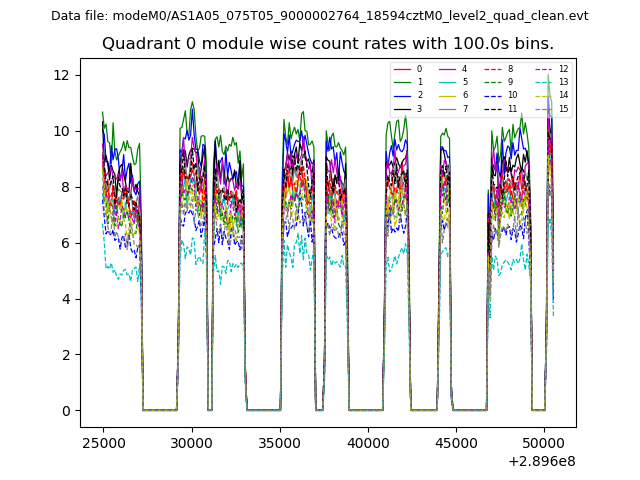 |
 |
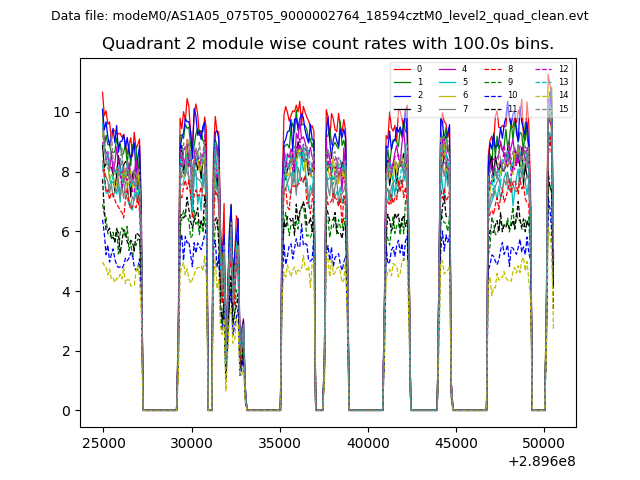
| Module-wise count rates for Quadrant B Data is divided into 100 sec bins |
 |
 |
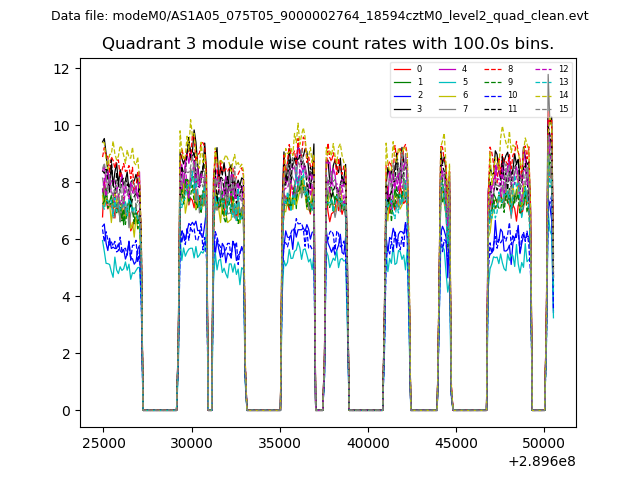
| Module-wise count rates for Quadrant C Data is divided into 100 sec bins |
 |
 |
| Module-wise count rates for Quadrant D Data is divided into 100 sec bins |
 |
 |
| Parameter | Plot |
|---|---|
| CZT HV Monitor | 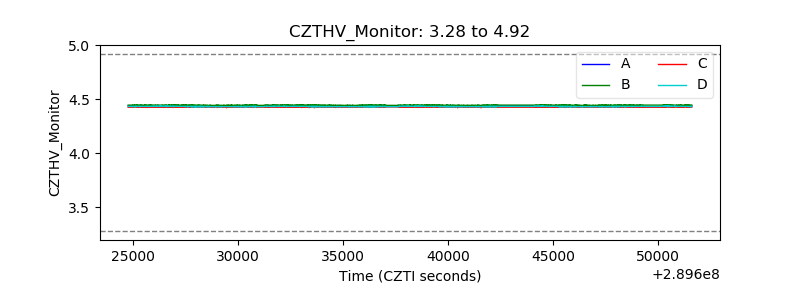 |
| D_VDD | 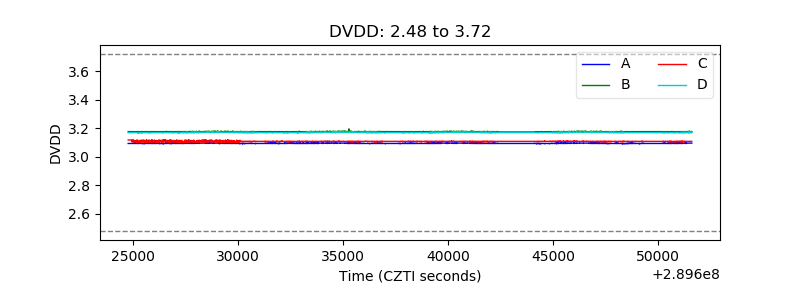 |
| Temperature 1 | 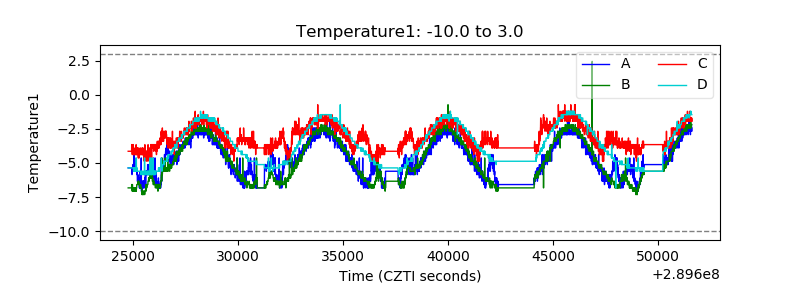 |
| Veto HV Monitor | 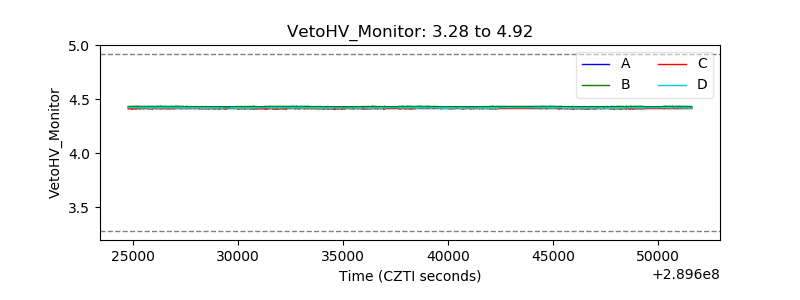 |
| Veto LLD | 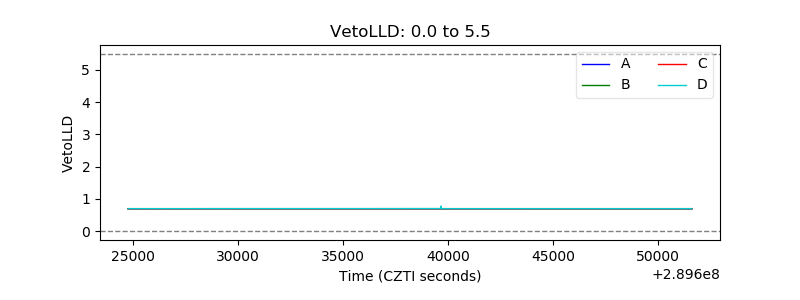 |
| Alpha Counter | 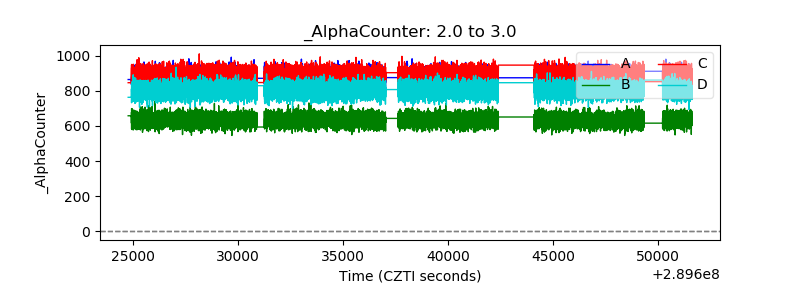 |
| _CPM_Rate | 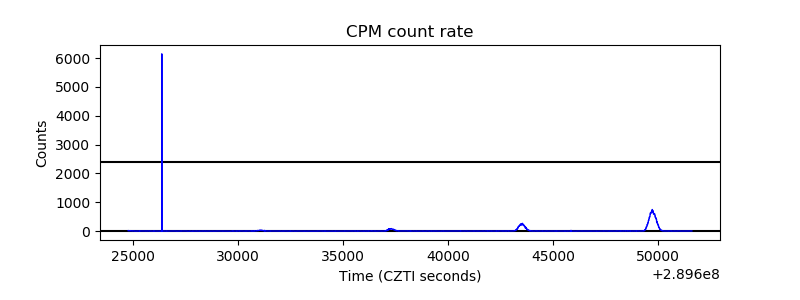 |
| CZT Counter | 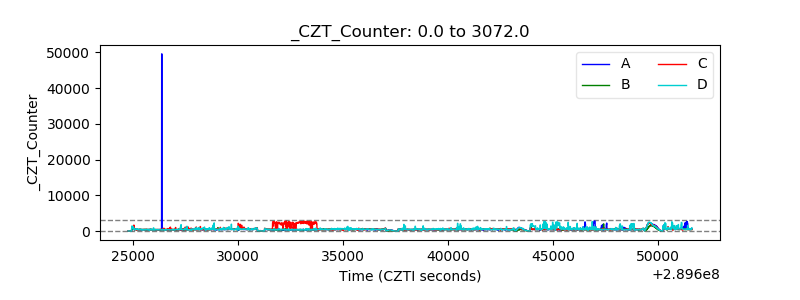 |
| +2.5 Volts monitor |  |
| +5 Volts monitor |  |
| _ROLL_ROT | 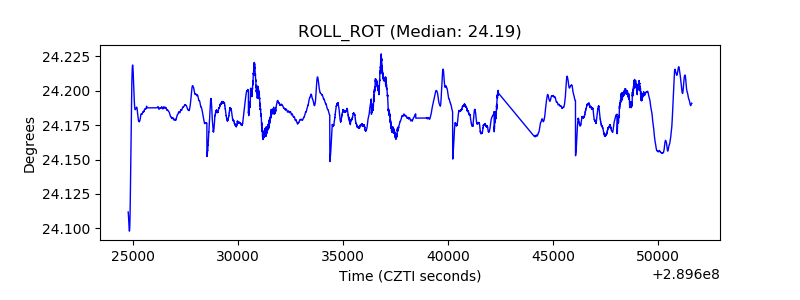 |
| _Roll_DEC | 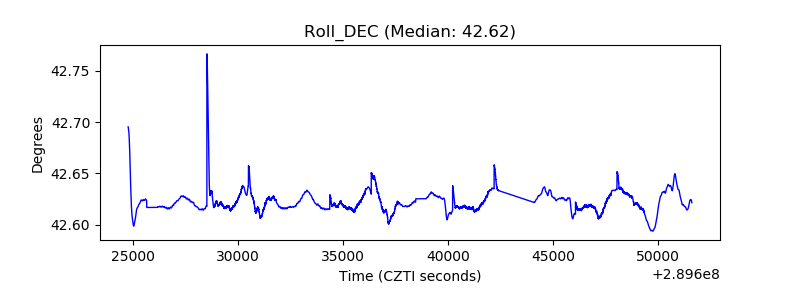 |
| _Roll_RA | 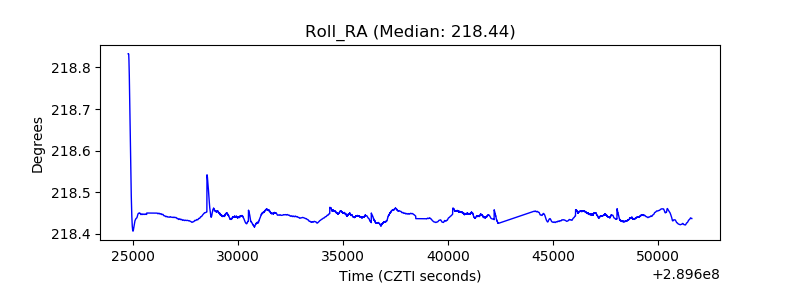 |
| Veto Counter | 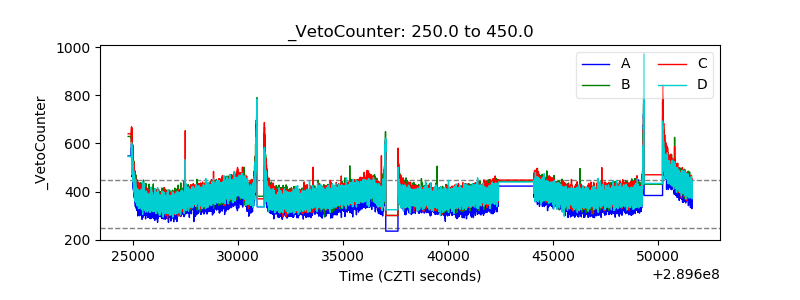 |