| Param | Original file | Final file |
|---|---|---|
| Filename | modeM0/AS1A05_075T05_9000002764_18595cztM0_level2.evt | modeM0/AS1A05_075T05_9000002764_18595cztM0_level2_quad_clean.evt |
| Size (bytes) | 287,337,600 | 39,553,920 |
| Size | 274.0 MB | 37.7 MB |
| Events in quadrant A | 2,159,943 | 232,598 |
| Events in quadrant B | 1,881,374 | 236,728 |
| Events in quadrant C | 1,955,517 | 227,402 |
| Events in quadrant D | 2,437,435 | 223,592 |
| Mode M0 | |||
|---|---|---|---|
| Quadrant | BADHDUFLAG | Total packets | Discarded packets |
| A | 0 | 9006 | 0 |
| B | 0 | 8008 | 0 |
| C | 0 | 8238 | 0 |
| D | 0 | 9928 | 0 |
| Mode SS | |||
|---|---|---|---|
| Quadrant | BADHDUFLAG | Total packets | Discarded packets |
| A | 0 | 78 | 0 |
| B | 0 | 78 | 0 |
| C | 0 | 78 | 0 |
| D | 0 | 78 | 0 |
| Quadrant | Total seconds | Saturated seconds | Saturation percentage |
|---|---|---|---|
| A | 3923 | 99 | 2.523579% |
| B | 3924 | 9 | 0.229358% |
| C | 3924 | 13 | 0.331295% |
| D | 3924 | 116 | 2.956167% |
Noise dominated data is calculated using 1-second bins in cleaned event files. If a bin has >2000 counts, and if more than 50% of those come from <1% of pixels, then it is considered to be noise-dominated and hence unusable.
| Quadrant | # 1 sec bins | Bins with >0 counts | Bins with >2000 counts | High rate bins dominated by noise | Noise dominated (total time) | Noise dominated (detector-on time) | Marked lightcurve |
|---|---|---|---|---|---|---|---|
| A | 3923 | 3923 | 67 | 67 | 1.71% | 1.71% | 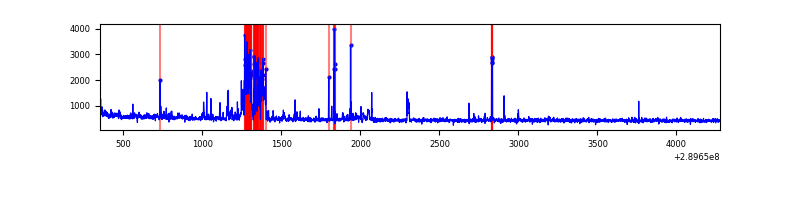 |
| B | 3924 | 3924 | 1 | 1 | 0.03% | 0.03% | 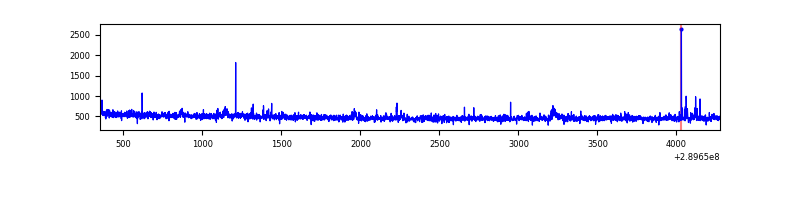 |
| C | 3924 | 3924 | 0 | 0 | 0.00% | 0.00% | 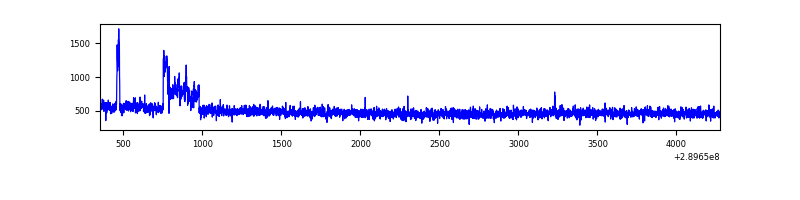 |
| D | 3924 | 3924 | 91 | 91 | 2.32% | 2.32% | 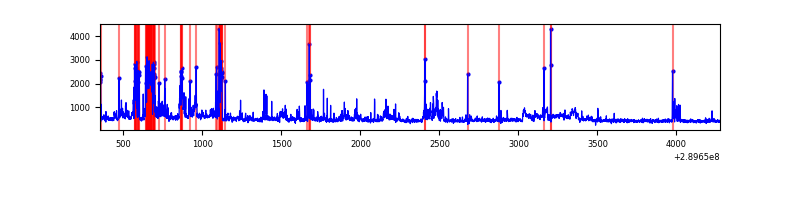 |
Top three noisy pixels from each quadrant. If the there are fewer than three noisy pixels in the level2.evt file, extra rows are filled as -1
| Pixel properties | Quadrant properties | ||||||
|---|---|---|---|---|---|---|---|
| Quadrant | DetID | PixID | Counts | Sigma | Mean | Median | Sigma |
| A | 0 | 13 | 334536 | 3476.88 | 469 | 459 | 96.1 |
| A | 3 | 15 | 8958 | 88.45 | 469 | 459 | 96.1 |
| A | 13 | 254 | 6099 | 58.7 | 469 | 459 | 96.1 |
| B | 0 | 229 | 18049 | 194.57 | 469 | 459 | 90.4 |
| B | 12 | 111 | 10696 | 113.24 | 469 | 459 | 90.4 |
| B | 11 | 111 | 9286 | 97.64 | 469 | 459 | 90.4 |
| C | 3 | 233 | 119313 | 1120.07 | 452 | 453 | 106.1 |
| C | 14 | 238 | 71069 | 665.45 | 452 | 453 | 106.1 |
| C | 13 | 61 | 3126 | 25.19 | 452 | 453 | 106.1 |
| D | 7 | 238 | 435042 | 3923.3 | 456 | 443 | 110.8 |
| D | 10 | 50 | 122590 | 1102.67 | 456 | 443 | 110.8 |
| D | 1 | 52 | 118681 | 1067.38 | 456 | 443 | 110.8 |
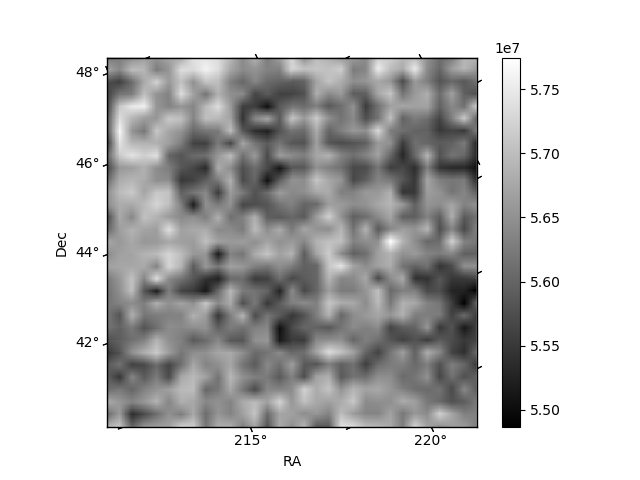
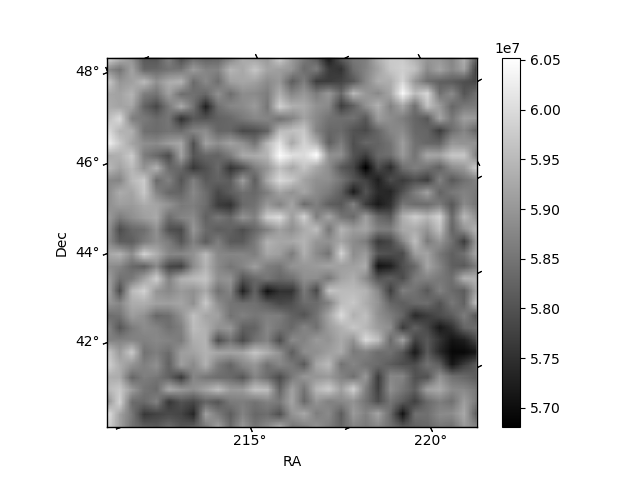
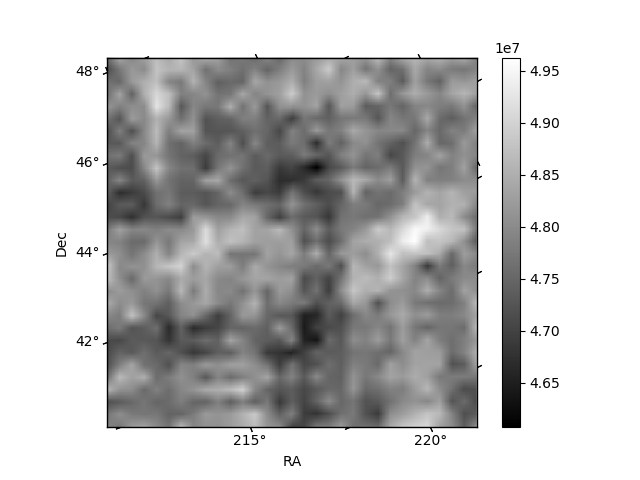
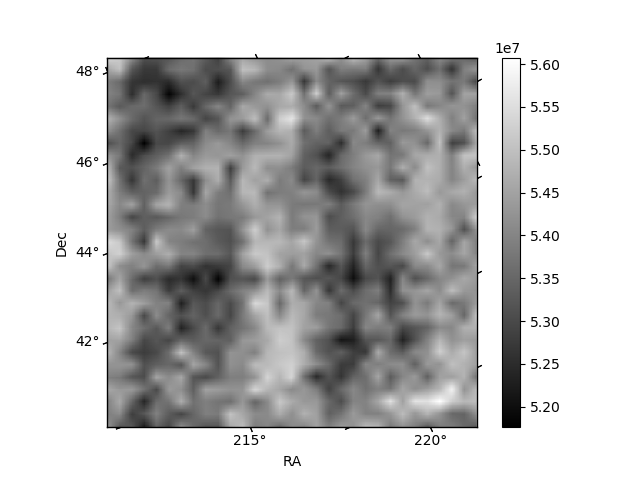
Histogram calculated using DETX and DETY for each event in the final _common_clean file
| Quadrant A | 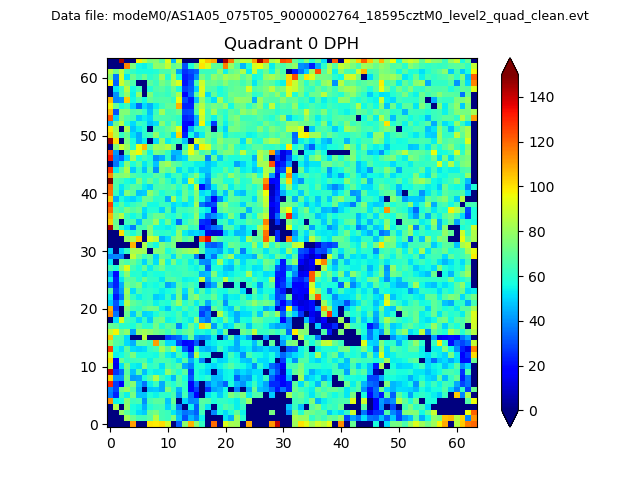 |
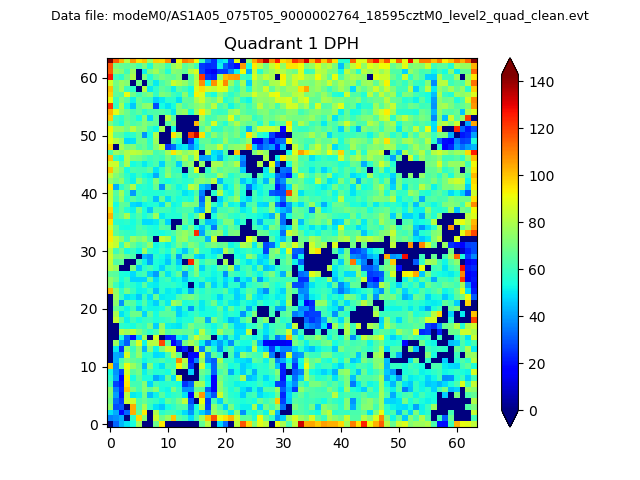 |
Quadrant B |
|---|---|---|---|
| Quadrant D | 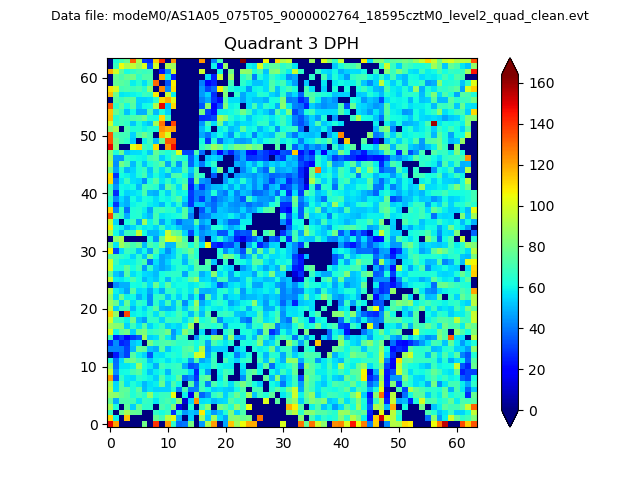 |
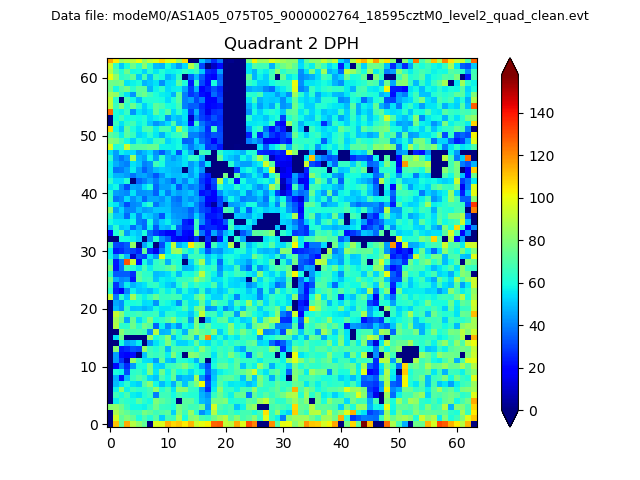 |
Quadrant C |
| Plot type | Count rate plots | Images |
|---|---|---|
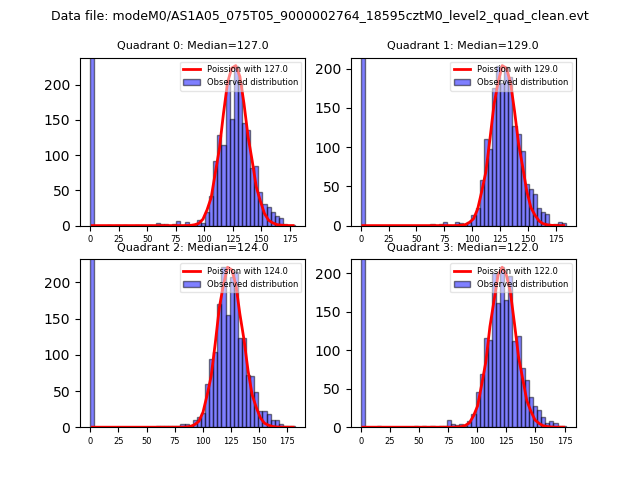
| Comparison with Poisson distribution Blue bars denote a histogram of data divided into 1 sec bins. Red curve is a Poisson curve with rate = median count rate of data. |
 |
 |
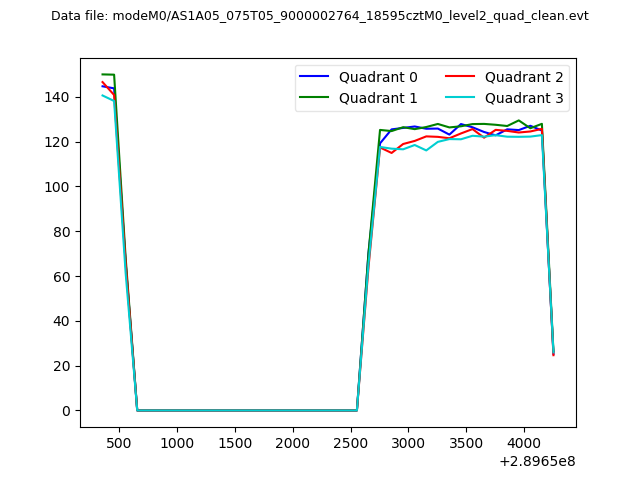
| Quadrant-wise count rates Data is divided into 100 sec bins |
 |
|
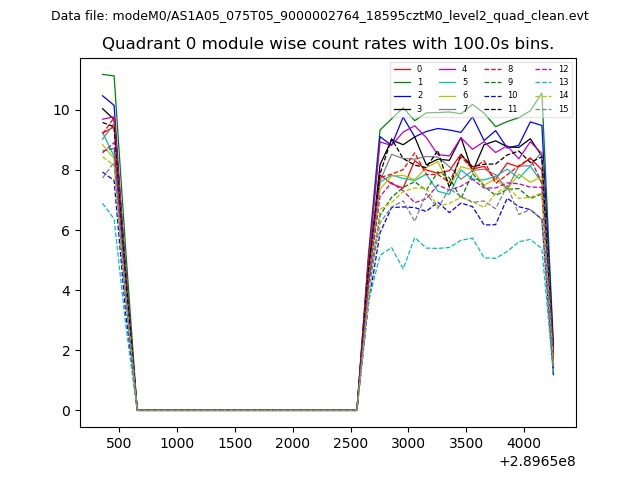
| Module-wise count rates for Quadrant A Data is divided into 100 sec bins |
 |
 |
| Module-wise count rates for Quadrant B Data is divided into 100 sec bins |
 |
 |
| Module-wise count rates for Quadrant C Data is divided into 100 sec bins |
 |
 |
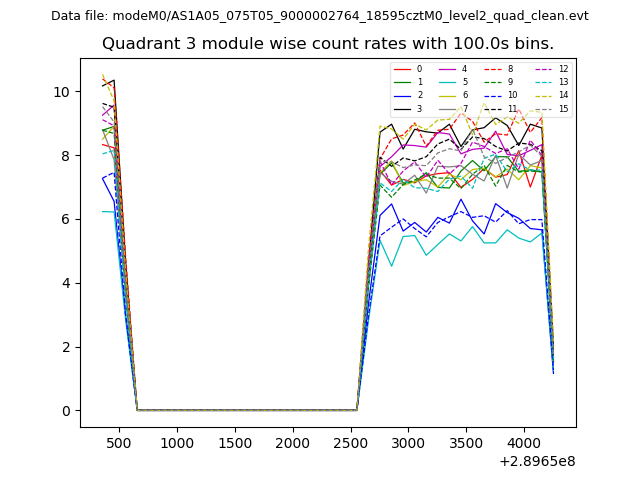
| Module-wise count rates for Quadrant D Data is divided into 100 sec bins |
 |
 |
| Parameter | Plot |
|---|---|
| CZT HV Monitor | 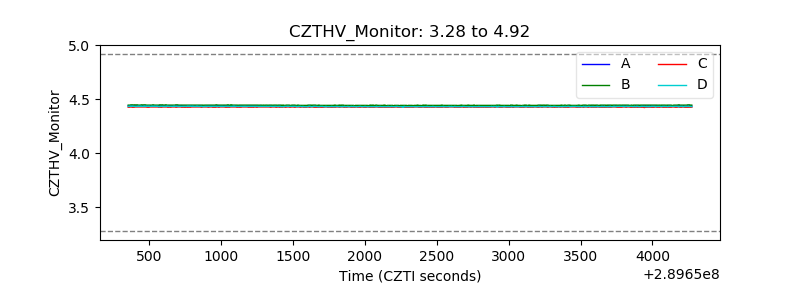 |
| D_VDD | 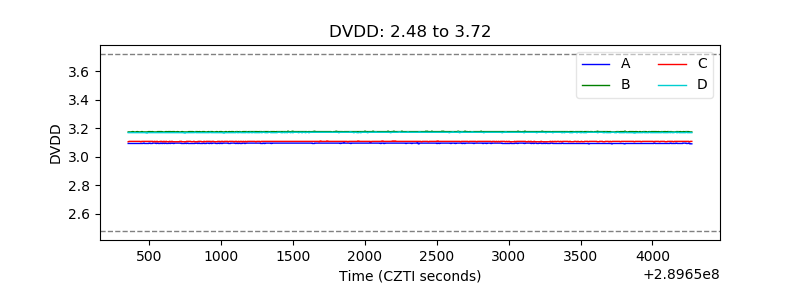 |
| Temperature 1 | 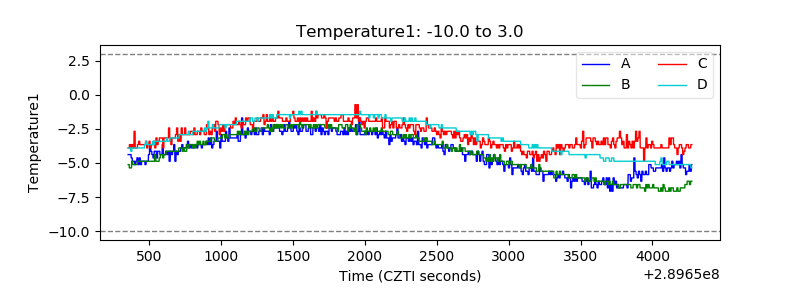 |
| Veto HV Monitor | 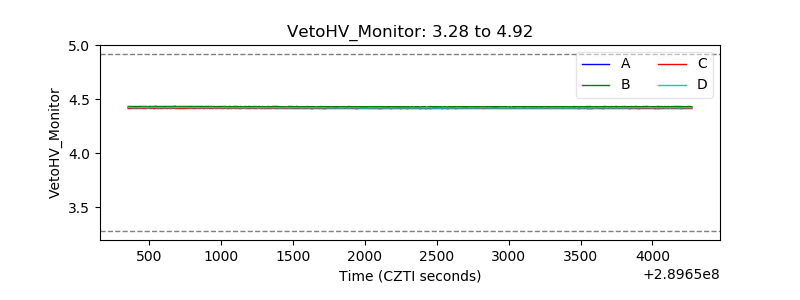 |
| Veto LLD | 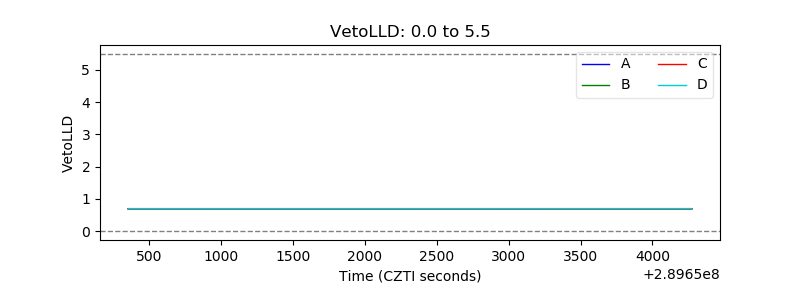 |
| Alpha Counter | 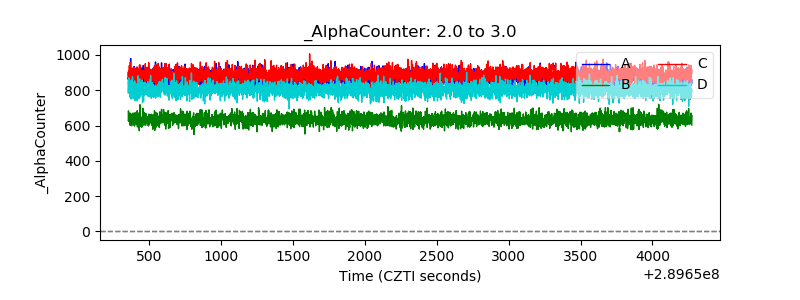 |
| _CPM_Rate |  |
| CZT Counter | 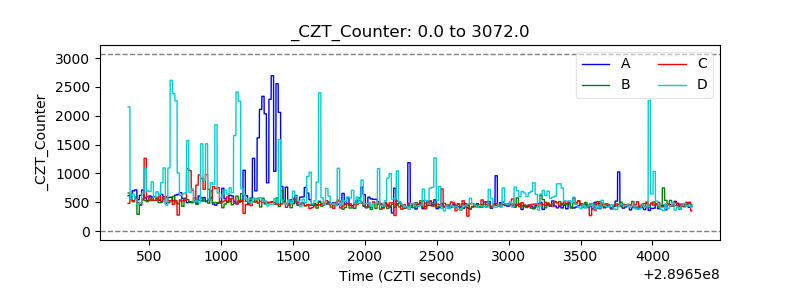 |
| +2.5 Volts monitor |  |
| +5 Volts monitor |  |
| _ROLL_ROT | 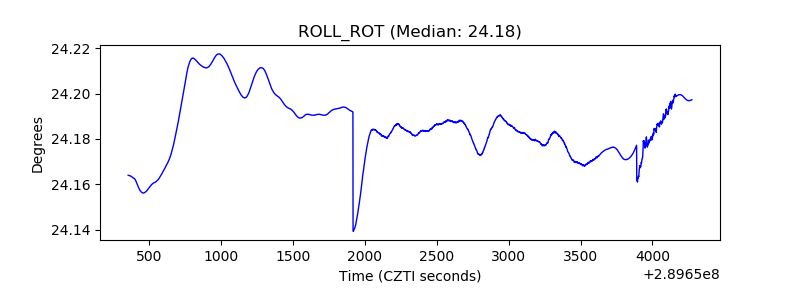 |
| _Roll_DEC | 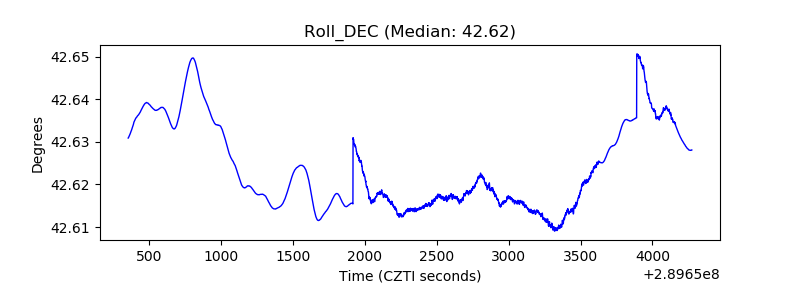 |
| _Roll_RA | 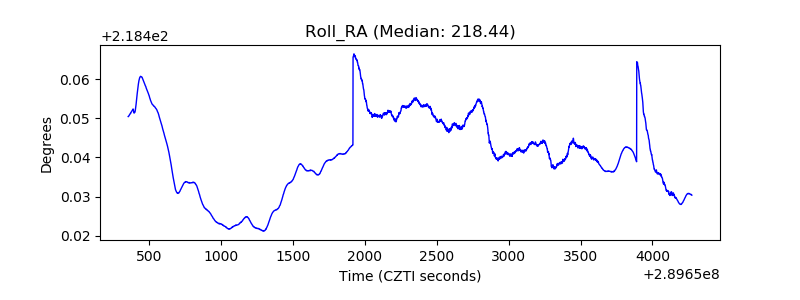 |
| Veto Counter | 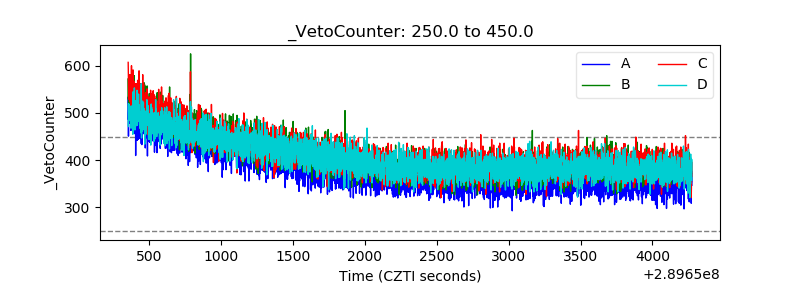 |