| Param | Original file | Final file |
|---|---|---|
| Filename | modeM0/AS1A05_075T06_9000002766cztM0_level2.fits | modeM0/AS1A05_075T06_9000002766cztM0_level2_quad_clean.evt |
| Size (bytes) | 198,650,880 | 130,397,760 |
| Size | 189.4 MB | 124.4 MB |
| Events in quadrant A | 1,241,086 | 694,402 |
| Events in quadrant B | 1,202,200 | 701,079 |
| Events in quadrant C | 1,237,332 | 672,874 |
| Events in quadrant D | 1,089,224 | 632,531 |
| Mode SS | |||
|---|---|---|---|
| Quadrant | BADHDUFLAG | Total packets | Discarded packets |
| A | 0 | 370 | 0 |
| B | 0 | 370 | 0 |
| C | 0 | 370 | 0 |
| D | 0 | 370 | 0 |
| Mode M9 | |||
|---|---|---|---|
| Quadrant | BADHDUFLAG | Total packets | Discarded packets |
| A | 0 | 49 | 0 |
| B | 0 | 49 | 0 |
| C | 0 | 49 | 0 |
| D | 0 | 49 | 0 |
| Mode M0 | |||
|---|---|---|---|
| Quadrant | BADHDUFLAG | Total packets | Discarded packets |
| A | 0 | 39338 | 0 |
| B | 0 | 39796 | 0 |
| C | 0 | 40930 | 0 |
| D | 0 | 43758 | 0 |
| Quadrant | Total seconds | Saturated seconds | Saturation percentage |
|---|---|---|---|
| A | 18089 | 246 | 1.359943% |
| B | 18089 | 268 | 1.481563% |
| C | 18089 | 396 | 2.189176% |
| D | 18089 | 485 | 2.681187% |
Noise dominated data is calculated using 1-second bins in cleaned event files. If a bin has >2000 counts, and if more than 50% of those come from <1% of pixels, then it is considered to be noise-dominated and hence unusable.
| Quadrant | # 1 sec bins | Bins with >0 counts | Bins with >2000 counts | High rate bins dominated by noise | Noise dominated (total time) | Noise dominated (detector-on time) | Marked lightcurve |
|---|---|---|---|---|---|---|---|
| A | 22965 | 18085 | 0 | 0 | 0.00% | 0.00% |  |
| B | 22965 | 18086 | 0 | 0 | 0.00% | 0.00% |  |
| C | 22965 | 18086 | 0 | 0 | 0.00% | 0.00% |  |
| D | 22965 | 18085 | 0 | 0 | 0.00% | 0.00% |  |
Top three noisy pixels from each quadrant. If the there are fewer than three noisy pixels in the level2.evt file, extra rows are filled as -1
| Pixel properties | Quadrant properties | ||||||
|---|---|---|---|---|---|---|---|
| Quadrant | DetID | PixID | Counts | Sigma | Mean | Median | Sigma |
| A | 0 | 29 | 1211 | 11.35 | 323 | 306 | 79.8 |
| A | 7 | 110 | 974 | 8.38 | 323 | 306 | 79.8 |
| A | 9 | 19 | 936 | 7.9 | 323 | 306 | 79.8 |
| B | 2 | 9 | 963 | 10.34 | 317 | 305 | 63.6 |
| B | 2 | 8 | 835 | 8.33 | 317 | 305 | 63.6 |
| B | 3 | 17 | 760 | 7.15 | 317 | 305 | 63.6 |
| C | 3 | 126 | 899 | 7.03 | 327 | 310 | 83.8 |
| C | 1 | 81 | 885 | 6.87 | 327 | 310 | 83.8 |
| C | 1 | 80 | 879 | 6.79 | 327 | 310 | 83.8 |
| D | 10 | 190 | 833 | 6.64 | 310 | 286 | 82.3 |
| D | 3 | 14 | 767 | 5.84 | 310 | 286 | 82.3 |
| D | 6 | 67 | 762 | 5.78 | 310 | 286 | 82.3 |
Histogram calculated using DETX and DETY for each event in the final _common_clean file
| Quadrant A | 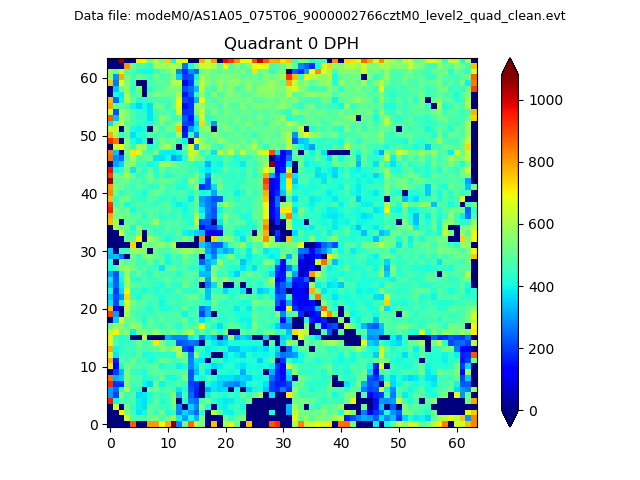 |
 |
Quadrant B |
|---|---|---|---|
| Quadrant D |  |
 |
Quadrant C |
| Plot type | Count rate plots | Images |
|---|---|---|
| Comparison with Poisson distribution Blue bars denote a histogram of data divided into 1 sec bins. Red curve is a Poisson curve with rate = median count rate of data. |
 |
 |
| Quadrant-wise count rates Data is divided into 100 sec bins |
 |
|
| Module-wise count rates for Quadrant A Data is divided into 100 sec bins |
 |
 |
| Module-wise count rates for Quadrant B Data is divided into 100 sec bins |
 |
 |
| Module-wise count rates for Quadrant C Data is divided into 100 sec bins |
 |
 |
| Module-wise count rates for Quadrant D Data is divided into 100 sec bins |
 |
 |
| Parameter | Plot |
|---|---|
| CZT HV Monitor |  |
| D_VDD |  |
| Temperature 1 |  |
| Veto HV Monitor |  |
| Veto LLD |  |
| Alpha Counter |  |
| _CPM_Rate |  |
| CZT Counter |  |
| +2.5 Volts monitor |  |
| +5 Volts monitor |  |
| _ROLL_ROT |  |
| _Roll_DEC |  |
| _Roll_RA |  |
| Veto Counter |  |