| Param | Original file | Final file |
|---|---|---|
| Filename | modeM0/AS1A05_075T06_9000002766_18598cztM0_level2.evt | modeM0/AS1A05_075T06_9000002766_18598cztM0_level2_quad_clean.evt |
| Size (bytes) | 496,143,360 | 77,820,480 |
| Size | 473.2 MB | 74.2 MB |
| Events in quadrant A | 3,347,217 | 485,495 |
| Events in quadrant B | 3,449,669 | 494,811 |
| Events in quadrant C | 3,491,269 | 480,104 |
| Events in quadrant D | 4,314,896 | 461,199 |
| Mode SS | |||
|---|---|---|---|
| Quadrant | BADHDUFLAG | Total packets | Discarded packets |
| A | 0 | 126 | 0 |
| B | 0 | 126 | 0 |
| C | 0 | 126 | 0 |
| D | 0 | 126 | 0 |
| Mode M9 | |||
|---|---|---|---|
| Quadrant | BADHDUFLAG | Total packets | Discarded packets |
| A | 0 | 17 | 0 |
| B | 0 | 18 | 0 |
| C | 0 | 18 | 0 |
| D | 0 | 18 | 0 |
| Mode M0 | |||
|---|---|---|---|
| Quadrant | BADHDUFLAG | Total packets | Discarded packets |
| A | 0 | 14159 | 2 |
| B | 0 | 14384 | 2 |
| C | 0 | 14489 | 2 |
| D | 0 | 17156 | 2 |
| Quadrant | Total seconds | Saturated seconds | Saturation percentage |
|---|---|---|---|
| A | 6231 | 97 | 1.556732% |
| B | 6231 | 104 | 1.669074% |
| C | 6231 | 144 | 2.311026% |
| D | 6231 | 319 | 5.119563% |
Noise dominated data is calculated using 1-second bins in cleaned event files. If a bin has >2000 counts, and if more than 50% of those come from <1% of pixels, then it is considered to be noise-dominated and hence unusable.
| Quadrant | # 1 sec bins | Bins with >0 counts | Bins with >2000 counts | High rate bins dominated by noise | Noise dominated (total time) | Noise dominated (detector-on time) | Marked lightcurve |
|---|---|---|---|---|---|---|---|
| A | 7492 | 6231 | 2 | 2 | 0.03% | 0.03% | 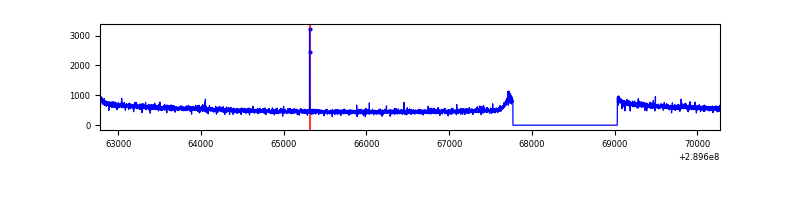 |
| B | 7492 | 6231 | 8 | 8 | 0.11% | 0.13% | 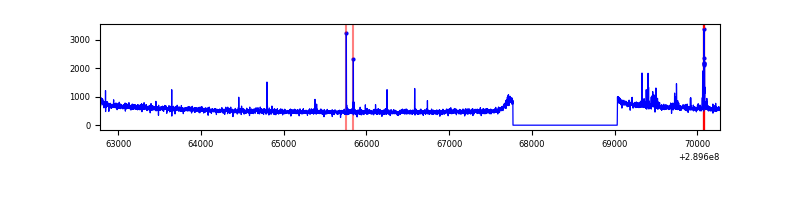 |
| C | 7492 | 6231 | 0 | 0 | 0.00% | 0.00% | 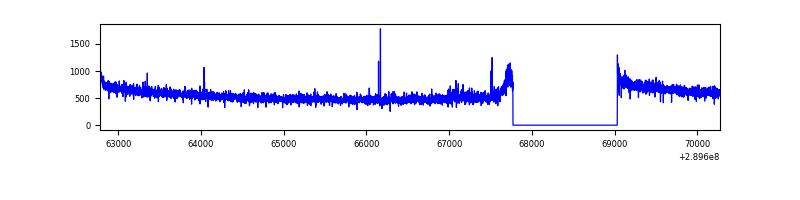 |
| D | 7492 | 6231 | 242 | 242 | 3.23% | 3.88% | 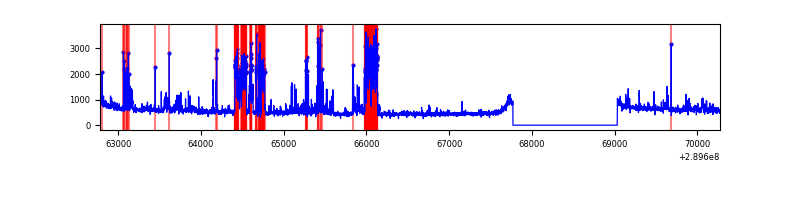 |
Top three noisy pixels from each quadrant. If the there are fewer than three noisy pixels in the level2.evt file, extra rows are filled as -1
| Pixel properties | Quadrant properties | ||||||
|---|---|---|---|---|---|---|---|
| Quadrant | DetID | PixID | Counts | Sigma | Mean | Median | Sigma |
| A | 13 | 254 | 10401 | 55.94 | 865 | 850 | 170.7 |
| A | 15 | 192 | 8446 | 44.49 | 865 | 850 | 170.7 |
| A | 0 | 226 | 7674 | 39.97 | 865 | 850 | 170.7 |
| B | 0 | 229 | 41468 | 251.2 | 863 | 842 | 161.7 |
| B | 12 | 18 | 23784 | 141.85 | 863 | 842 | 161.7 |
| B | 12 | 111 | 18512 | 109.26 | 863 | 842 | 161.7 |
| C | 14 | 238 | 133363 | 690.32 | 839 | 848 | 192.0 |
| C | 3 | 233 | 66598 | 342.52 | 839 | 848 | 192.0 |
| C | 13 | 61 | 5777 | 25.67 | 839 | 848 | 192.0 |
| D | 7 | 238 | 577929 | 2825.98 | 845 | 823 | 204.2 |
| D | 1 | 52 | 385079 | 1881.63 | 845 | 823 | 204.2 |
| D | 5 | 222 | 97007 | 470.99 | 845 | 823 | 204.2 |
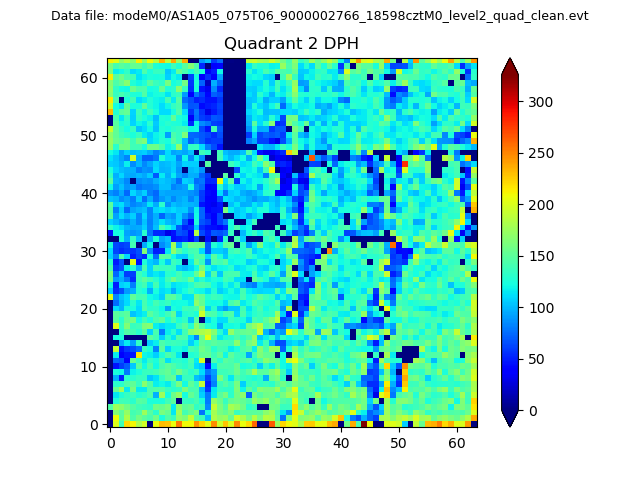
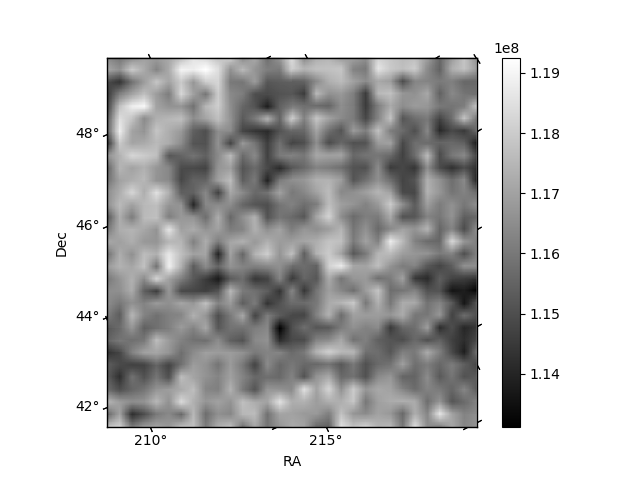
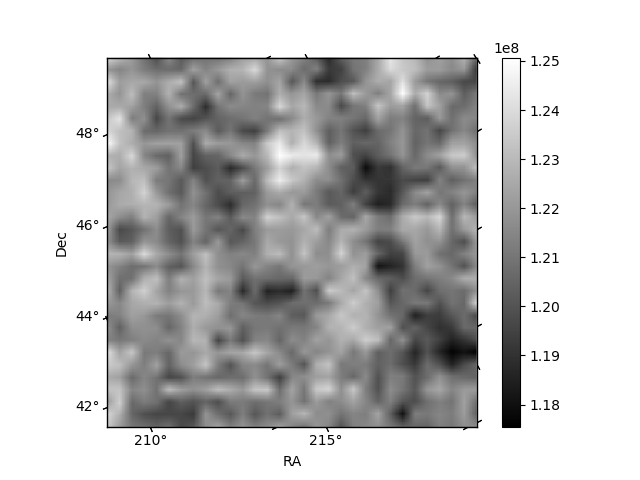
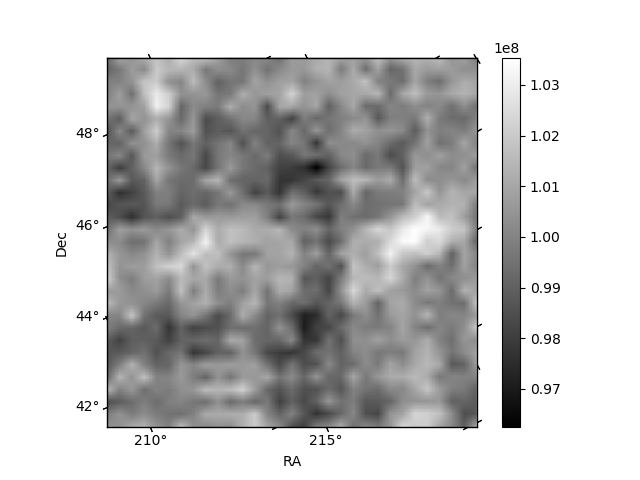
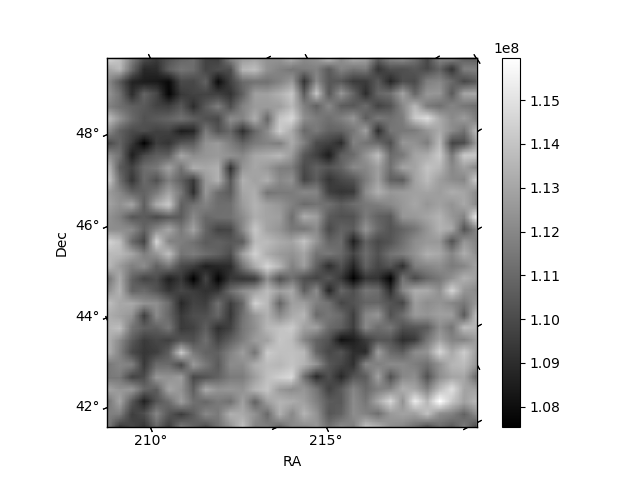
Histogram calculated using DETX and DETY for each event in the final _common_clean file
| Quadrant A | 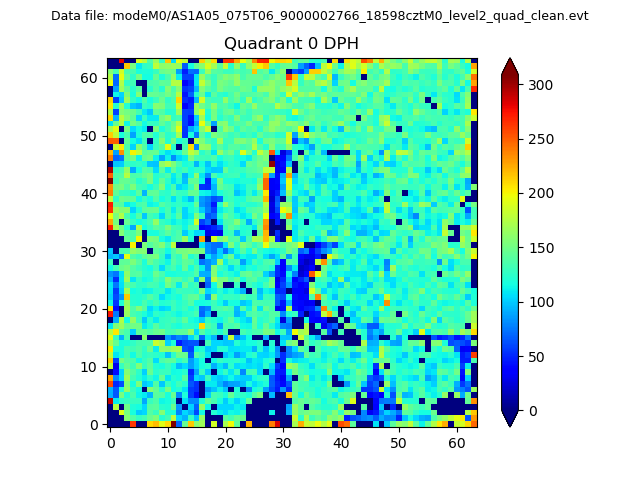 |
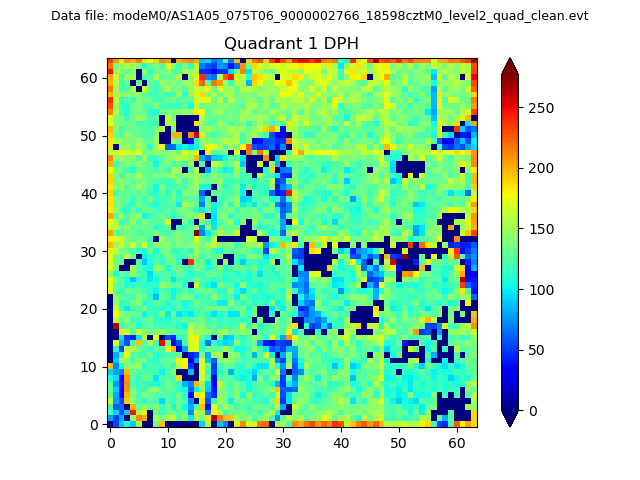 |
Quadrant B |
|---|---|---|---|
| Quadrant D | 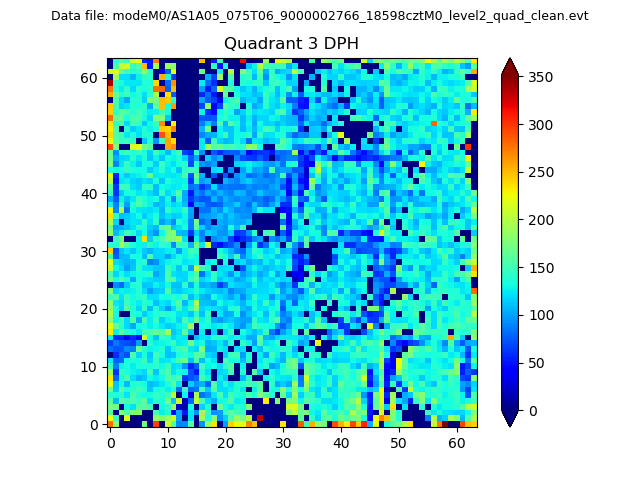 |
 |
Quadrant C |
| Plot type | Count rate plots | Images |
|---|---|---|
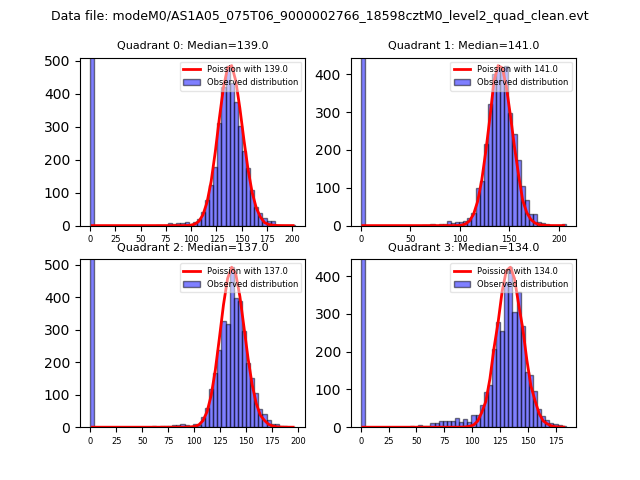
| Comparison with Poisson distribution Blue bars denote a histogram of data divided into 1 sec bins. Red curve is a Poisson curve with rate = median count rate of data. |
 |
 |
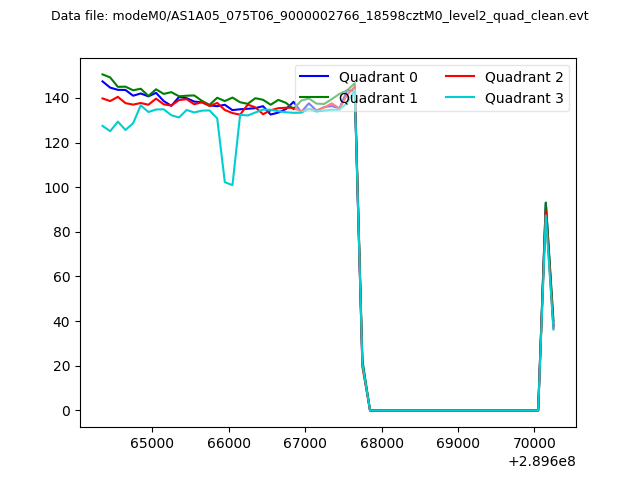
| Quadrant-wise count rates Data is divided into 100 sec bins |
 |
|
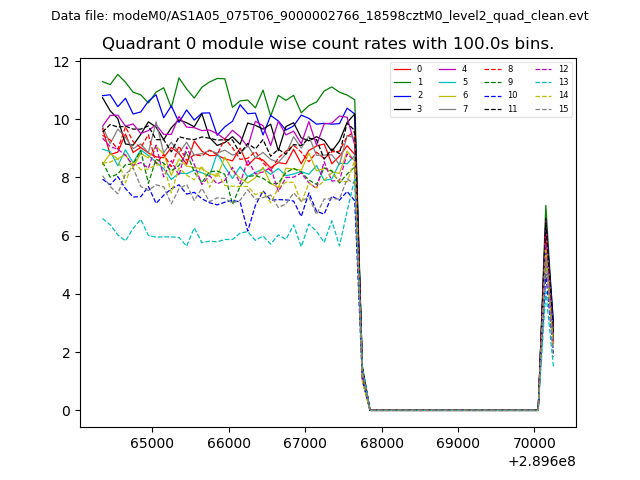
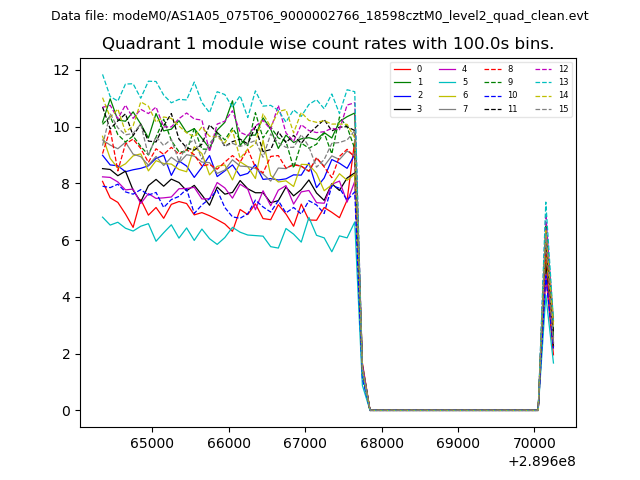
| Module-wise count rates for Quadrant A Data is divided into 100 sec bins |
 |
 |
| Module-wise count rates for Quadrant B Data is divided into 100 sec bins |
 |
 |
| Module-wise count rates for Quadrant C Data is divided into 100 sec bins |
 |
 |
| Module-wise count rates for Quadrant D Data is divided into 100 sec bins |
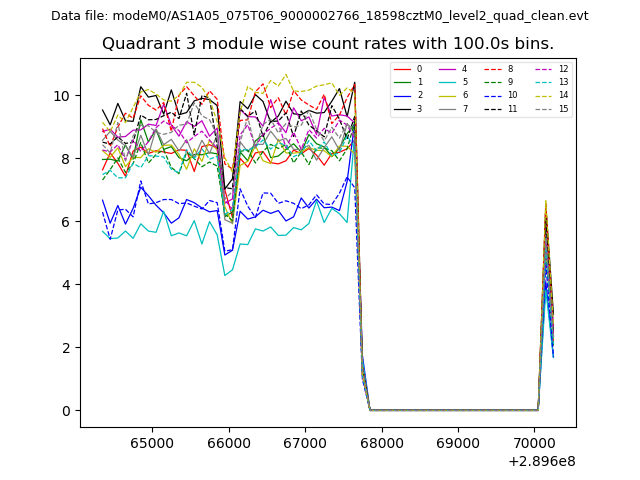 |
 |
| Parameter | Plot |
|---|---|
| CZT HV Monitor | 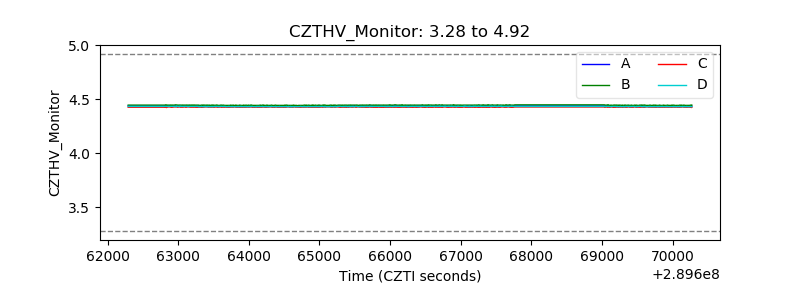 |
| D_VDD | 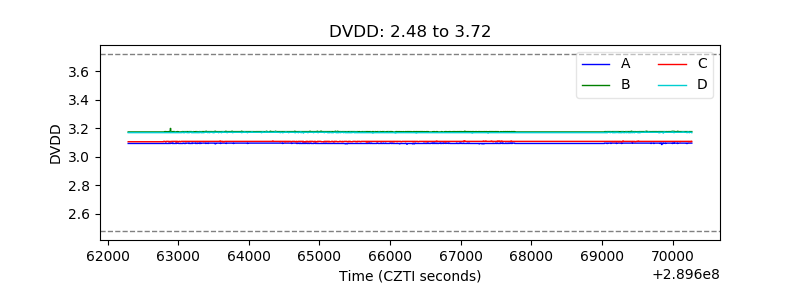 |
| Temperature 1 | 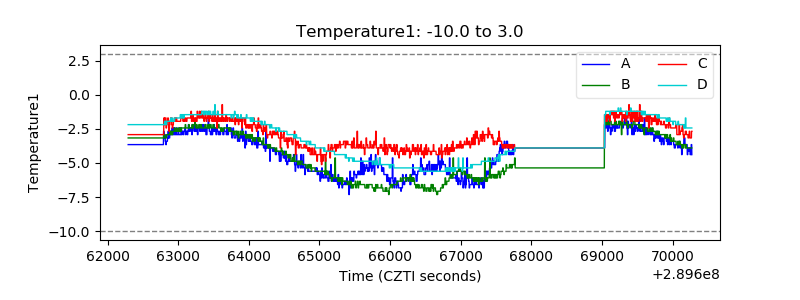 |
| Veto HV Monitor | 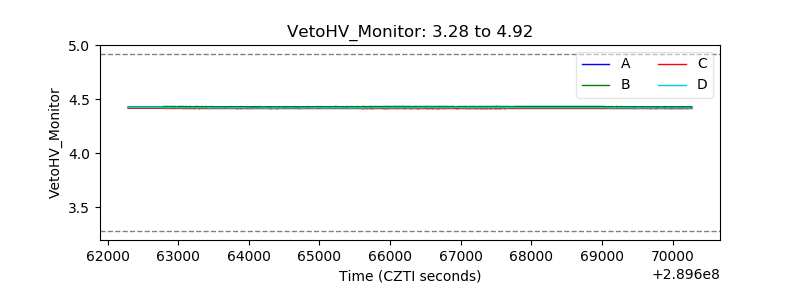 |
| Veto LLD | 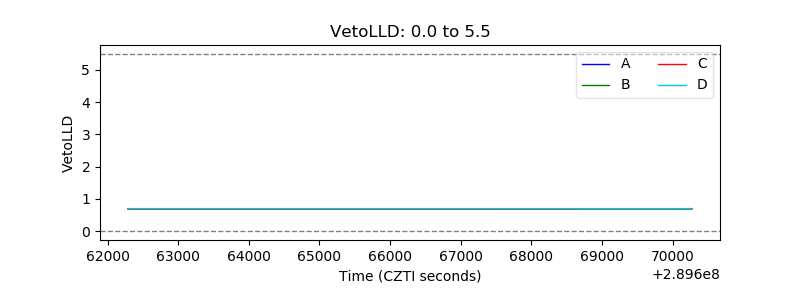 |
| Alpha Counter | 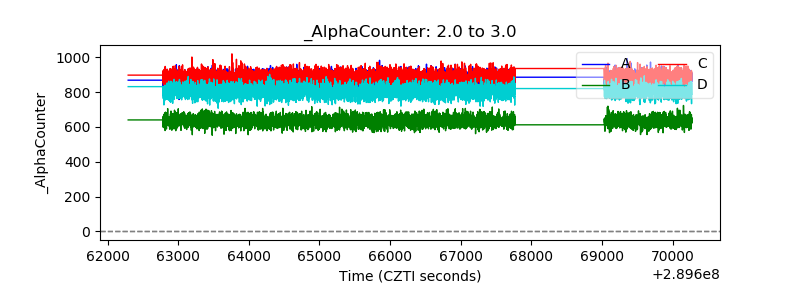 |
| _CPM_Rate | 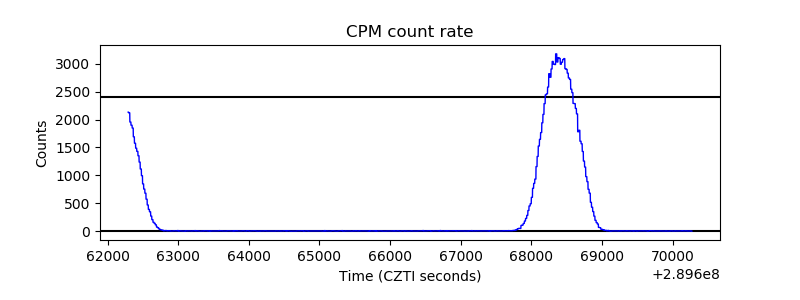 |
| CZT Counter | 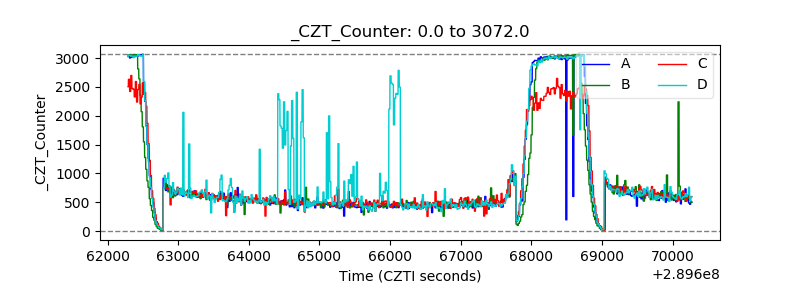 |
| +2.5 Volts monitor |  |
| +5 Volts monitor |  |
| _ROLL_ROT | 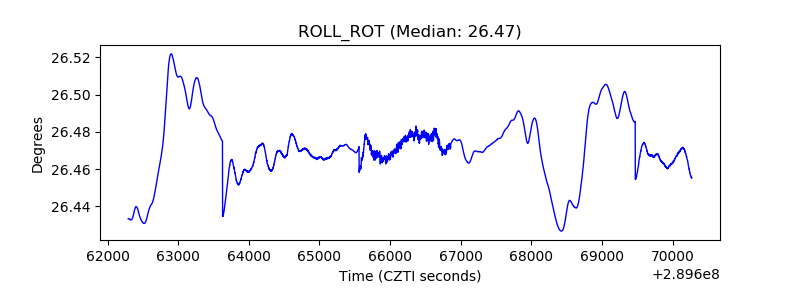 |
| _Roll_DEC | 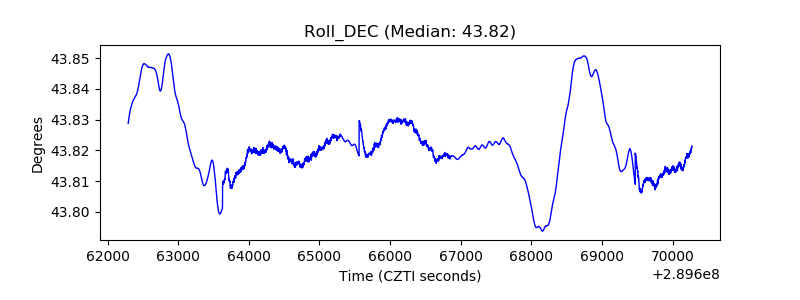 |
| _Roll_RA | 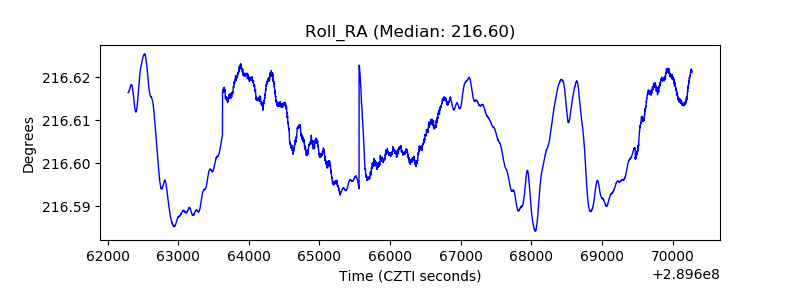 |
| Veto Counter | 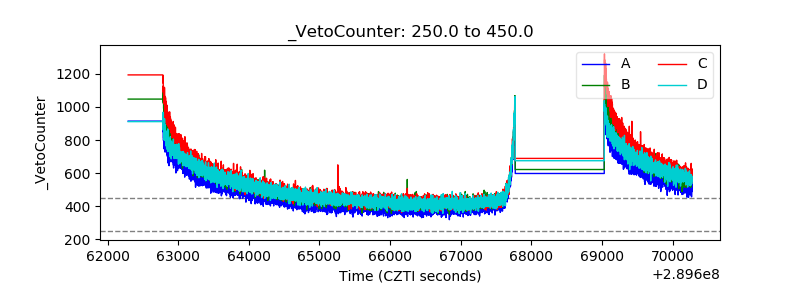 |