| Param | Original file | Final file |
|---|---|---|
| Filename | modeM0/AS1A05_075T06_9000002766_18599cztM0_level2.evt | modeM0/AS1A05_075T06_9000002766_18599cztM0_level2_quad_clean.evt |
| Size (bytes) | 489,168,000 | 98,441,280 |
| Size | 466.5 MB | 93.9 MB |
| Events in quadrant A | 3,419,400 | 637,265 |
| Events in quadrant B | 3,533,219 | 654,230 |
| Events in quadrant C | 3,756,729 | 634,104 |
| Events in quadrant D | 3,681,936 | 620,342 |
| Mode SS | |||
|---|---|---|---|
| Quadrant | BADHDUFLAG | Total packets | Discarded packets |
| A | 0 | 126 | 0 |
| B | 0 | 126 | 0 |
| C | 0 | 126 | 0 |
| D | 0 | 126 | 0 |
| Mode M9 | |||
|---|---|---|---|
| Quadrant | BADHDUFLAG | Total packets | Discarded packets |
| A | 0 | 27 | 0 |
| B | 0 | 27 | 0 |
| C | 0 | 27 | 0 |
| D | 0 | 27 | 0 |
| Mode M0 | |||
|---|---|---|---|
| Quadrant | BADHDUFLAG | Total packets | Discarded packets |
| A | 0 | 14317 | 2 |
| B | 0 | 14606 | 2 |
| C | 0 | 15416 | 2 |
| D | 0 | 15295 | 2 |
| Quadrant | Total seconds | Saturated seconds | Saturation percentage |
|---|---|---|---|
| A | 6245 | 143 | 2.289832% |
| B | 6246 | 173 | 2.769773% |
| C | 6246 | 236 | 3.778418% |
| D | 6246 | 157 | 2.513609% |
Noise dominated data is calculated using 1-second bins in cleaned event files. If a bin has >2000 counts, and if more than 50% of those come from <1% of pixels, then it is considered to be noise-dominated and hence unusable.
| Quadrant | # 1 sec bins | Bins with >0 counts | Bins with >2000 counts | High rate bins dominated by noise | Noise dominated (total time) | Noise dominated (detector-on time) | Marked lightcurve |
|---|---|---|---|---|---|---|---|
| A | 8866 | 6245 | 0 | 0 | 0.00% | 0.00% | 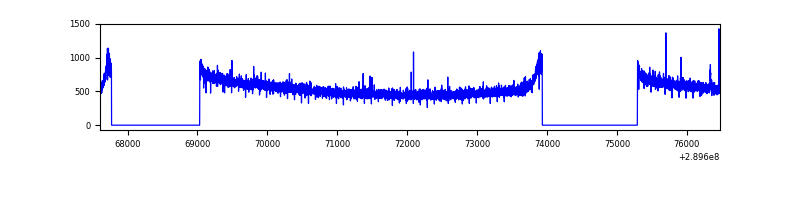 |
| B | 8867 | 6247 | 6 | 6 | 0.07% | 0.10% | 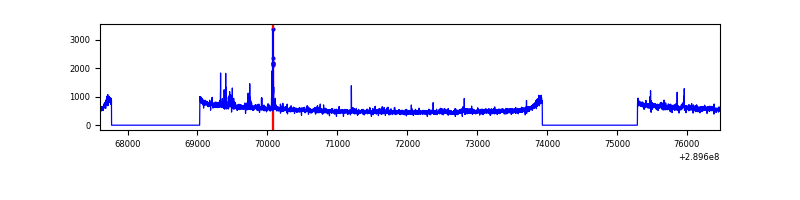 |
| C | 8867 | 6247 | 29 | 29 | 0.33% | 0.46% | 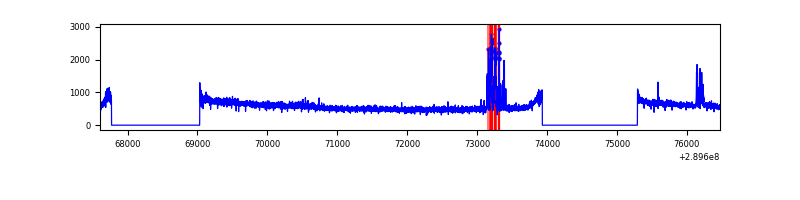 |
| D | 8867 | 6247 | 30 | 30 | 0.34% | 0.48% | 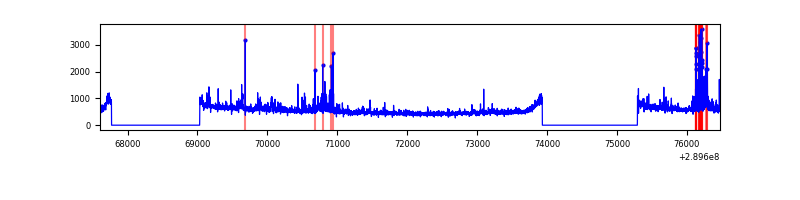 |
Top three noisy pixels from each quadrant. If the there are fewer than three noisy pixels in the level2.evt file, extra rows are filled as -1
| Pixel properties | Quadrant properties | ||||||
|---|---|---|---|---|---|---|---|
| Quadrant | DetID | PixID | Counts | Sigma | Mean | Median | Sigma |
| A | 13 | 254 | 9693 | 50.04 | 884 | 869 | 176.4 |
| A | 0 | 226 | 7853 | 39.6 | 884 | 869 | 176.4 |
| A | 12 | 194 | 6591 | 32.45 | 884 | 869 | 176.4 |
| B | 0 | 229 | 43136 | 257.7 | 885 | 864 | 164.0 |
| B | 12 | 18 | 30847 | 182.78 | 885 | 864 | 164.0 |
| B | 12 | 111 | 18915 | 110.04 | 885 | 864 | 164.0 |
| C | 14 | 238 | 137016 | 684.69 | 864 | 869 | 198.8 |
| C | 9 | 54 | 132612 | 662.54 | 864 | 869 | 198.8 |
| C | 3 | 233 | 74269 | 369.13 | 864 | 869 | 198.8 |
| D | 7 | 238 | 159762 | 756.81 | 878 | 855 | 210.0 |
| D | 5 | 222 | 151850 | 719.13 | 878 | 855 | 210.0 |
| D | 1 | 52 | 45168 | 211.05 | 878 | 855 | 210.0 |
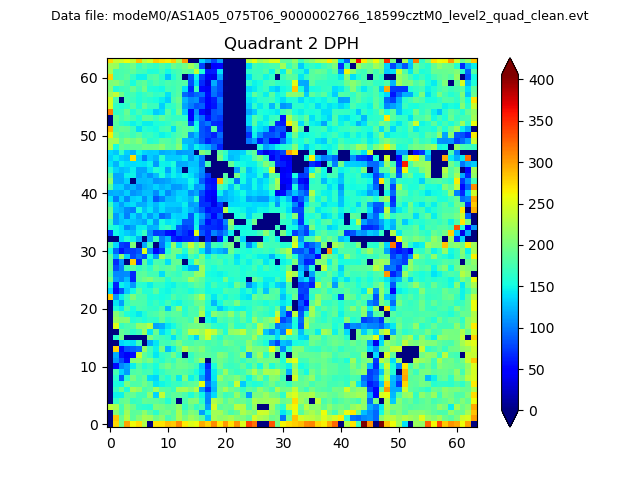
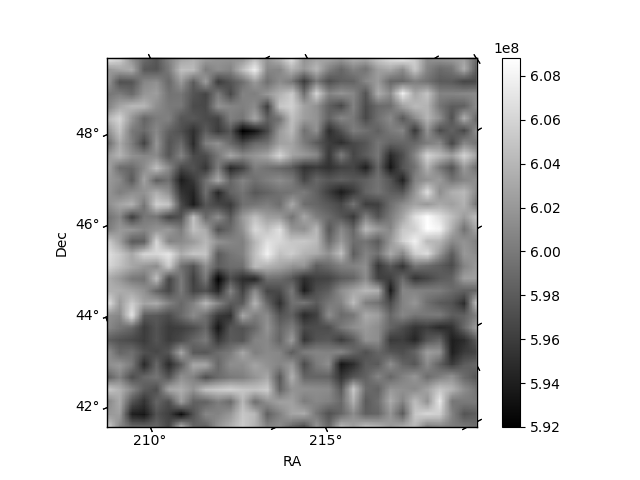
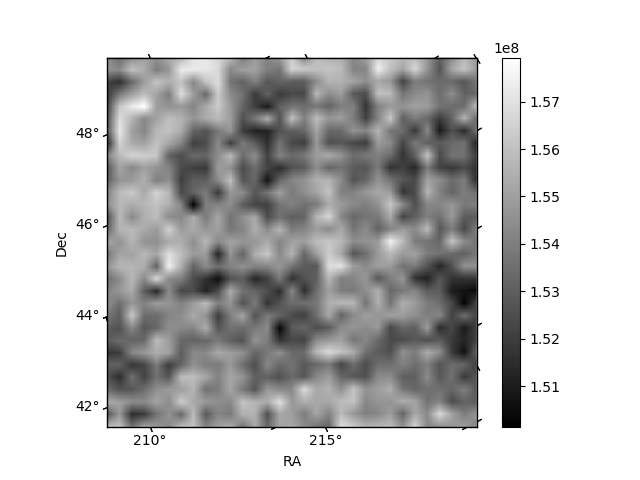
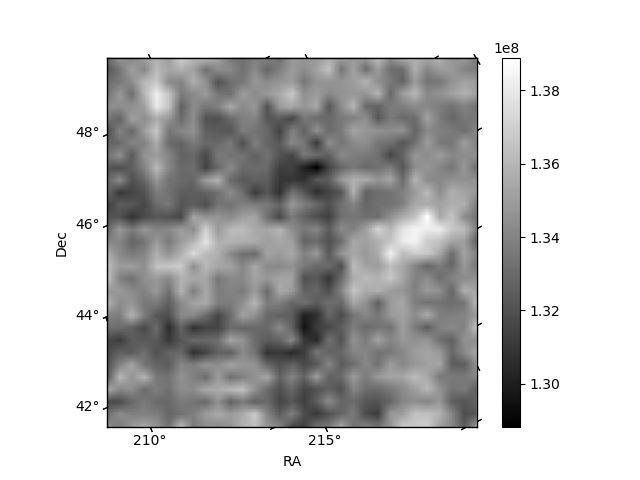
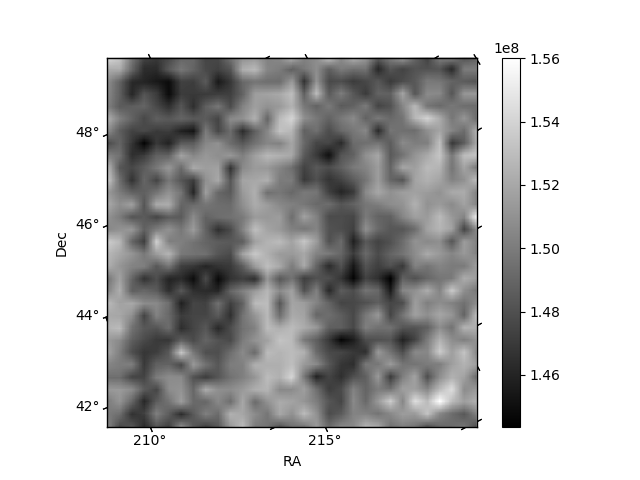
Histogram calculated using DETX and DETY for each event in the final _common_clean file
| Quadrant A | 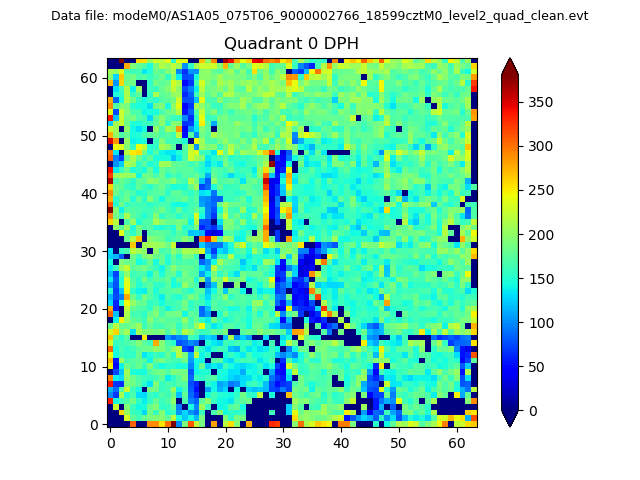 |
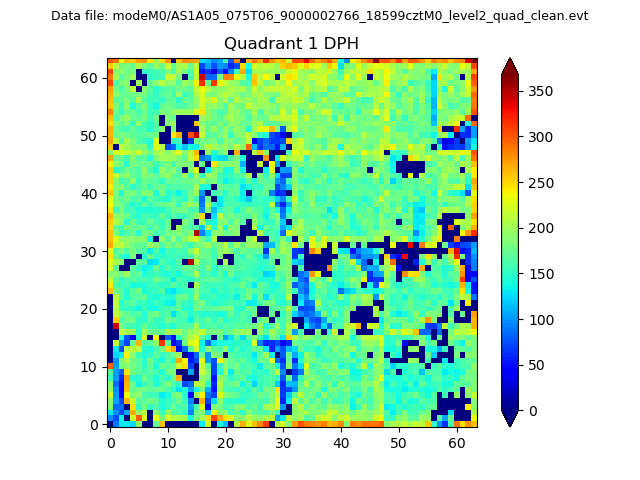 |
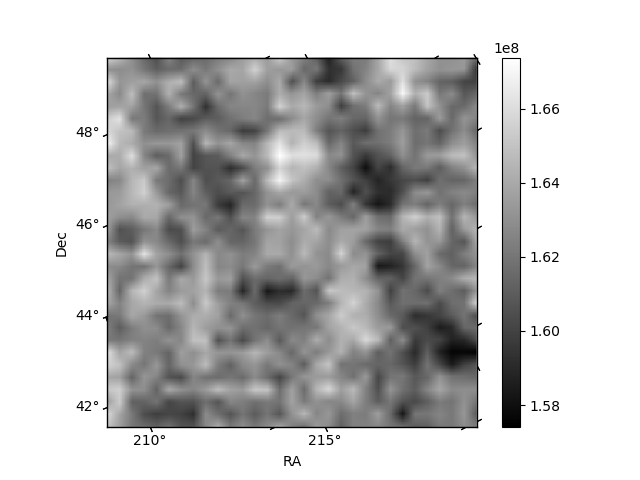
Quadrant B |
|---|---|---|---|
| Quadrant D | 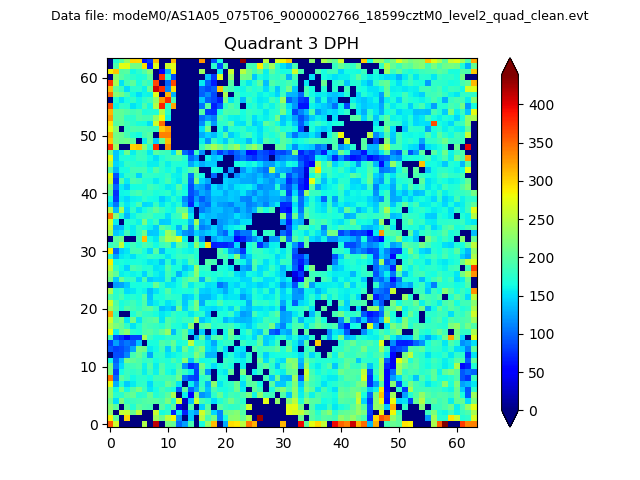 |
 |
Quadrant C |
| Plot type | Count rate plots | Images |
|---|---|---|
| Comparison with Poisson distribution Blue bars denote a histogram of data divided into 1 sec bins. Red curve is a Poisson curve with rate = median count rate of data. |
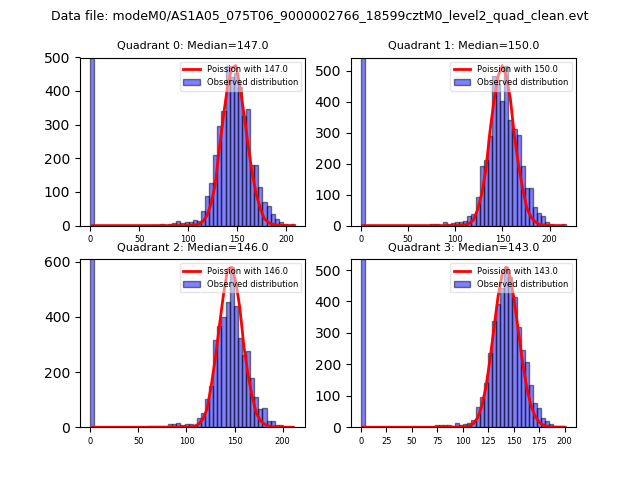 |
 |
| Quadrant-wise count rates Data is divided into 100 sec bins |
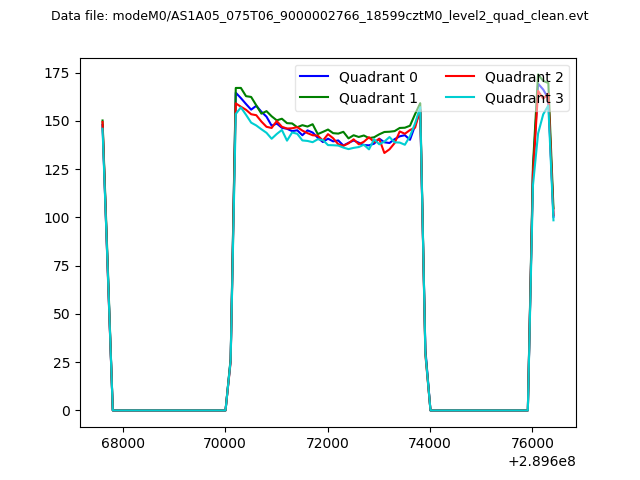 |
|
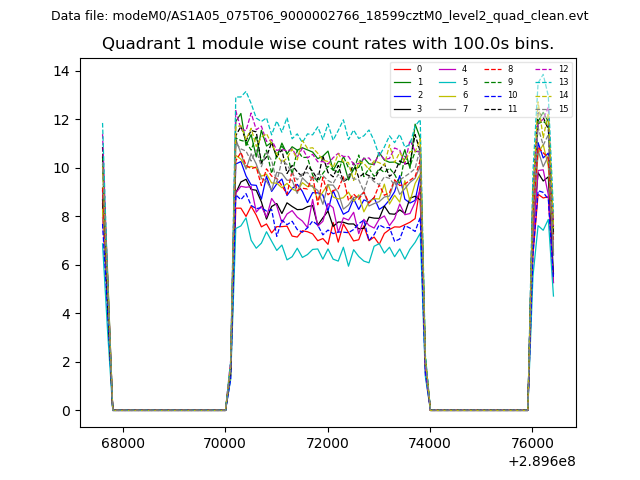
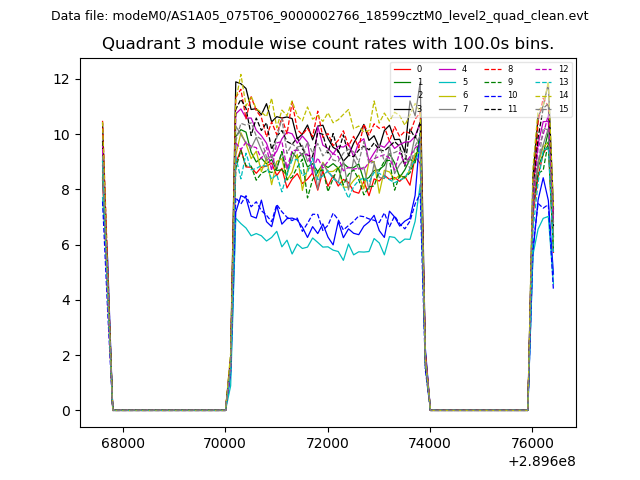
| Module-wise count rates for Quadrant A Data is divided into 100 sec bins |
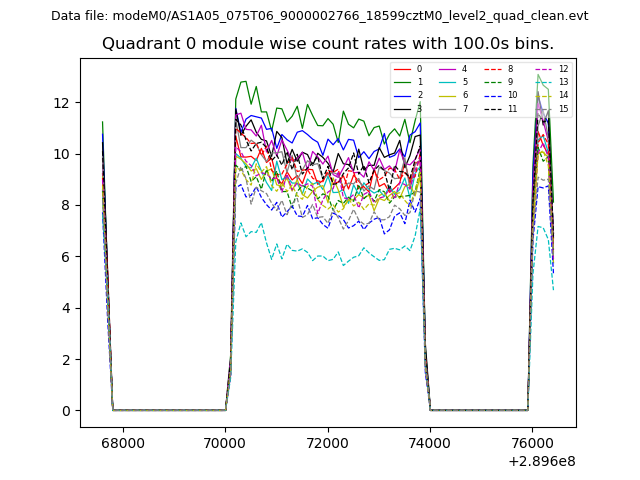 |
 |
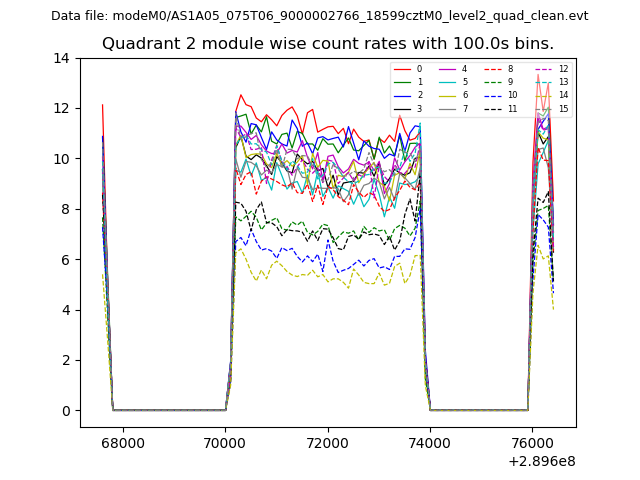
| Module-wise count rates for Quadrant B Data is divided into 100 sec bins |
 |
 |
| Module-wise count rates for Quadrant C Data is divided into 100 sec bins |
 |
 |
| Module-wise count rates for Quadrant D Data is divided into 100 sec bins |
 |
 |
| Parameter | Plot |
|---|---|
| CZT HV Monitor | 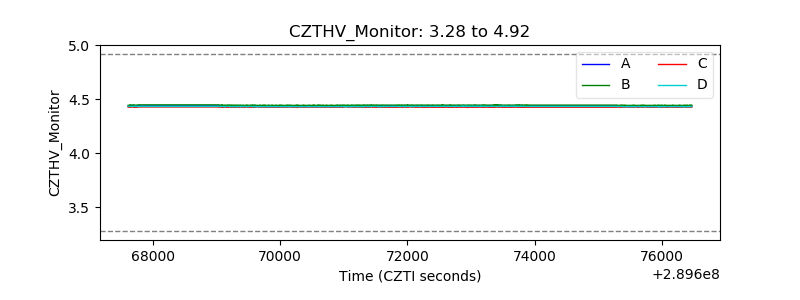 |
| D_VDD | 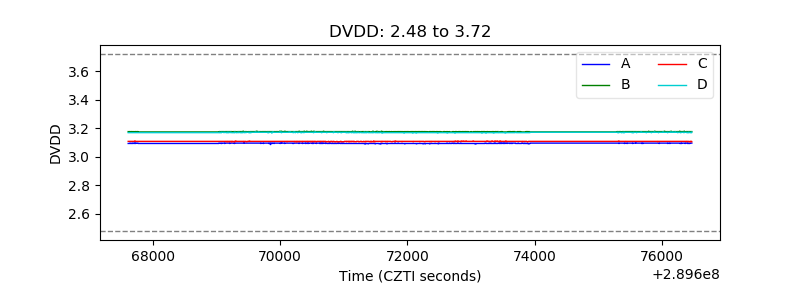 |
| Temperature 1 | 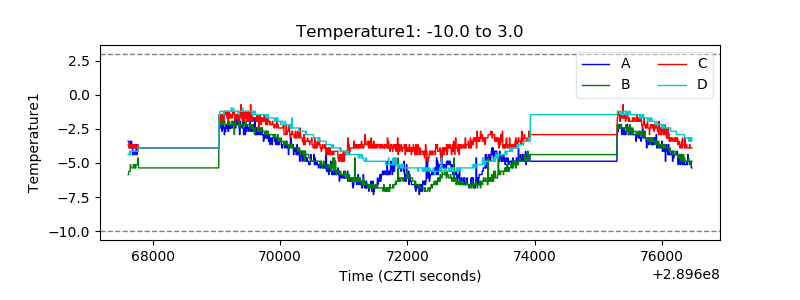 |
| Veto HV Monitor |  |
| Veto LLD | 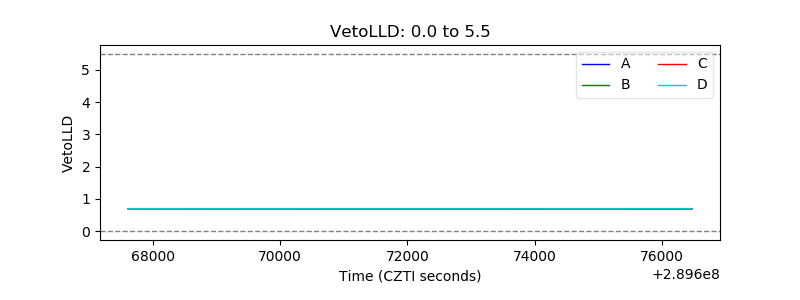 |
| Alpha Counter | 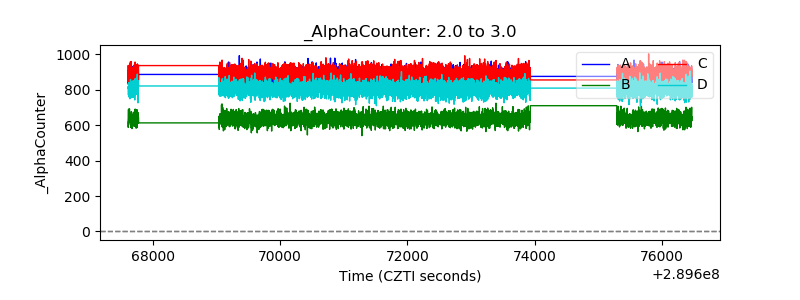 |
| _CPM_Rate | 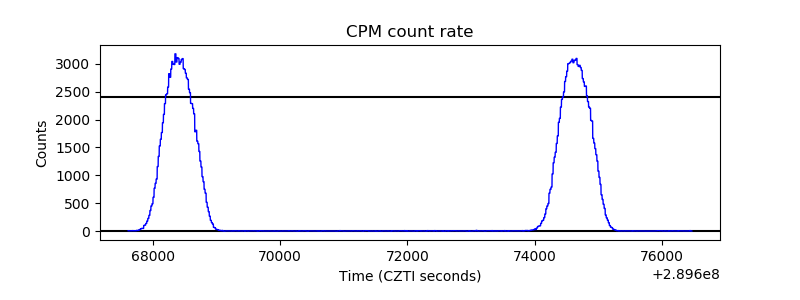 |
| CZT Counter | 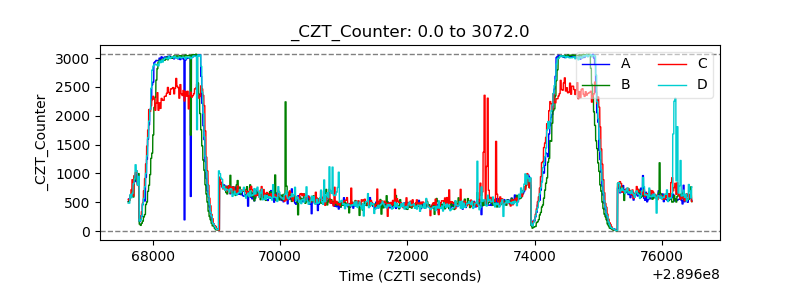 |
| +2.5 Volts monitor |  |
| +5 Volts monitor |  |
| _ROLL_ROT | 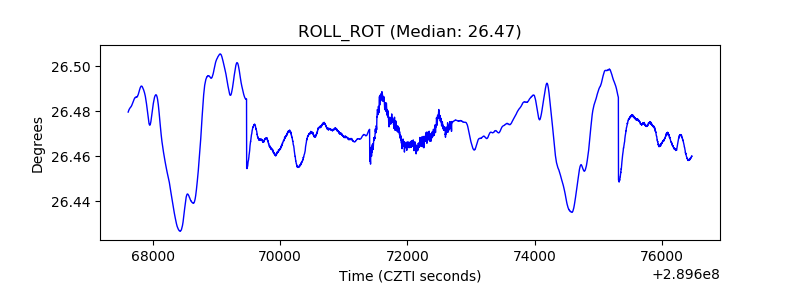 |
| _Roll_DEC | 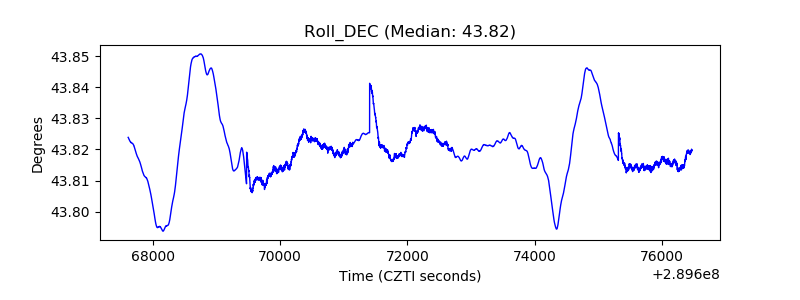 |
| _Roll_RA | 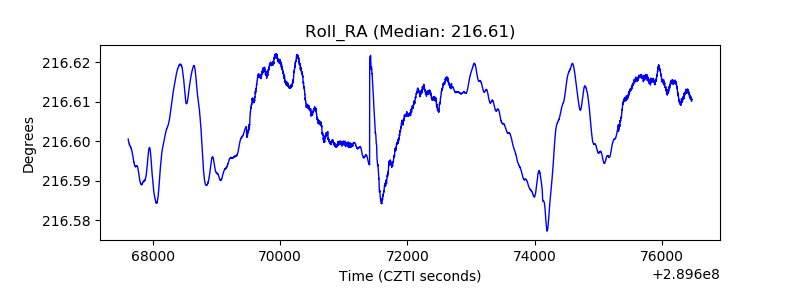 |
| Veto Counter | 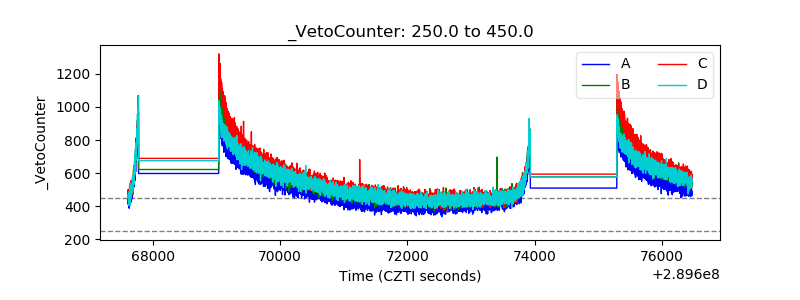 |