| Param | Original file | Final file |
|---|---|---|
| Filename | modeM0/AS1A05_104T03_9000002770cztM0_level2.fits | modeM0/AS1A05_104T03_9000002770cztM0_level2_quad_clean.evt |
| Size (bytes) | 303,255,360 | 273,260,160 |
| Size | 289.2 MB | 260.6 MB |
| Events in quadrant A | 1,825,446 | 1,569,318 |
| Events in quadrant B | 1,773,520 | 1,593,929 |
| Events in quadrant C | 1,806,820 | 1,527,541 |
| Events in quadrant D | 1,557,462 | 1,363,757 |
| Mode M9 | |||
|---|---|---|---|
| Quadrant | BADHDUFLAG | Total packets | Discarded packets |
| A | 0 | 18 | 0 |
| B | 0 | 18 | 0 |
| C | 0 | 18 | 0 |
| D | 0 | 18 | 0 |
| Mode M0 | |||
|---|---|---|---|
| Quadrant | BADHDUFLAG | Total packets | Discarded packets |
| A | 0 | 66919 | 0 |
| B | 0 | 67445 | 0 |
| C | 0 | 69264 | 0 |
| D | 0 | 82251 | 0 |
| Mode SS | |||
|---|---|---|---|
| Quadrant | BADHDUFLAG | Total packets | Discarded packets |
| A | 0 | 656 | 0 |
| B | 0 | 656 | 0 |
| C | 0 | 656 | 0 |
| D | 0 | 656 | 0 |
| Quadrant | Total seconds | Saturated seconds | Saturation percentage |
|---|---|---|---|
| A | 32313 | 425 | 1.315260% |
| B | 32313 | 523 | 1.618544% |
| C | 32313 | 687 | 2.126079% |
| D | 32313 | 1290 | 3.992201% |
Noise dominated data is calculated using 1-second bins in cleaned event files. If a bin has >2000 counts, and if more than 50% of those come from <1% of pixels, then it is considered to be noise-dominated and hence unusable.
| Quadrant | # 1 sec bins | Bins with >0 counts | Bins with >2000 counts | High rate bins dominated by noise | Noise dominated (total time) | Noise dominated (detector-on time) | Marked lightcurve |
|---|---|---|---|---|---|---|---|
| A | 34103 | 32311 | 0 | 0 | 0.00% | 0.00% |  |
| B | 34103 | 32309 | 0 | 0 | 0.00% | 0.00% |  |
| C | 34103 | 32311 | 0 | 0 | 0.00% | 0.00% | 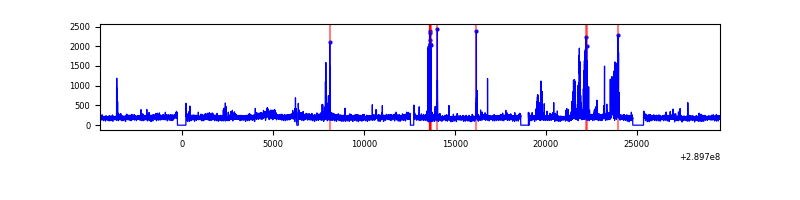 |
| D | 34103 | 32295 | 0 | 0 | 0.00% | 0.00% |  |
Top three noisy pixels from each quadrant. If the there are fewer than three noisy pixels in the level2.evt file, extra rows are filled as -1
| Pixel properties | Quadrant properties | ||||||
|---|---|---|---|---|---|---|---|
| Quadrant | DetID | PixID | Counts | Sigma | Mean | Median | Sigma |
| A | 7 | 110 | 1507 | 8.88 | 475 | 444 | 119.8 |
| A | 0 | 29 | 1470 | 8.57 | 475 | 444 | 119.8 |
| A | 15 | 236 | 1390 | 7.9 | 475 | 444 | 119.8 |
| B | 2 | 9 | 1424 | 10.29 | 467 | 443 | 95.3 |
| B | 3 | 17 | 1233 | 8.29 | 467 | 443 | 95.3 |
| B | 5 | 128 | 1198 | 7.92 | 467 | 443 | 95.3 |
| C | 12 | 241 | 1251 | 6.45 | 477 | 444 | 125.0 |
| C | 12 | 249 | 1249 | 6.44 | 477 | 444 | 125.0 |
| C | 3 | 126 | 1229 | 6.28 | 477 | 444 | 125.0 |
| D | 10 | 190 | 1192 | 6.51 | 444 | 405 | 120.9 |
| D | 3 | 14 | 1164 | 6.28 | 444 | 405 | 120.9 |
| D | 3 | 31 | 1140 | 6.08 | 444 | 405 | 120.9 |
Histogram calculated using DETX and DETY for each event in the final _common_clean file
| Quadrant A | 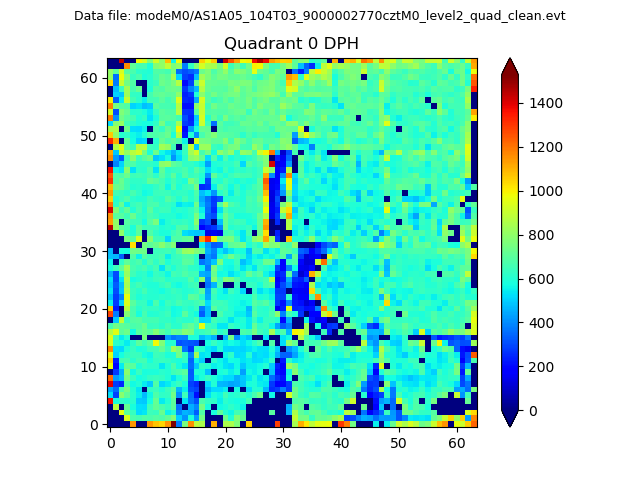 |
 |
Quadrant B |
|---|---|---|---|
| Quadrant D |  |
 |
Quadrant C |
| Plot type | Count rate plots | Images |
|---|---|---|
| Comparison with Poisson distribution Blue bars denote a histogram of data divided into 1 sec bins. Red curve is a Poisson curve with rate = median count rate of data. |
 |
 |
| Quadrant-wise count rates Data is divided into 100 sec bins |
 |
|
| Module-wise count rates for Quadrant A Data is divided into 100 sec bins |
 |
 |
| Module-wise count rates for Quadrant B Data is divided into 100 sec bins |
 |
 |
| Module-wise count rates for Quadrant C Data is divided into 100 sec bins |
 |
 |
| Module-wise count rates for Quadrant D Data is divided into 100 sec bins |
 |
 |
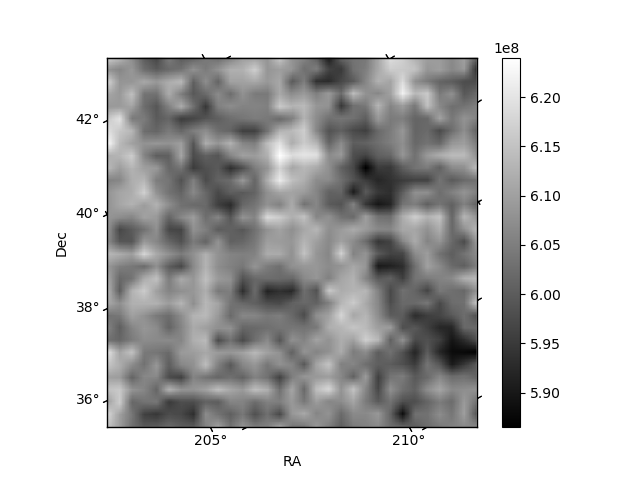
| Parameter | Plot |
|---|---|
| CZT HV Monitor |  |
| D_VDD | 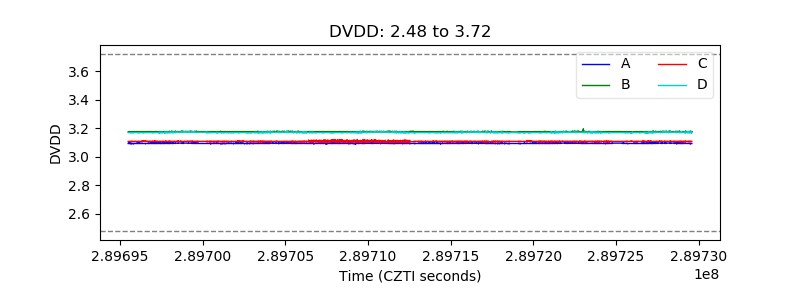 |
| Temperature 1 | 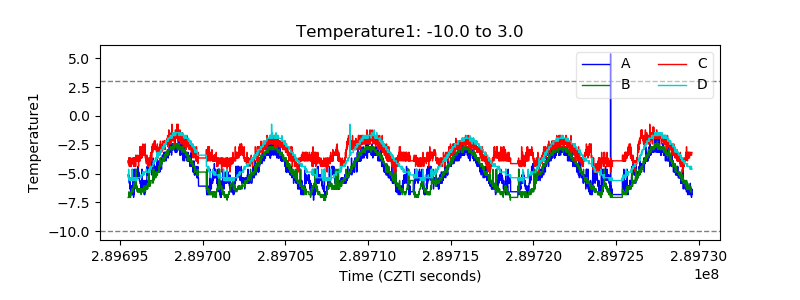 |
| Veto HV Monitor |  |
| Veto LLD |  |
| Alpha Counter | 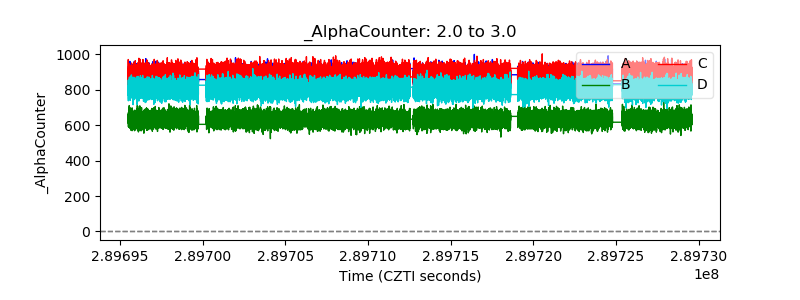 |
| _CPM_Rate |  |
| CZT Counter |  |
| +2.5 Volts monitor |  |
| +5 Volts monitor |  |
| _ROLL_ROT |  |
| _Roll_DEC |  |
| _Roll_RA |  |
| Veto Counter |  |