| Param | Original file | Final file |
|---|---|---|
| Filename | modeM0/AS1A05_104T03_9000002770_18603cztM0_level2.evt | modeM0/AS1A05_104T03_9000002770_18603cztM0_level2_quad_clean.evt |
| Size (bytes) | 392,224,320 | 71,222,400 |
| Size | 374.1 MB | 67.9 MB |
| Events in quadrant A | 2,682,543 | 439,904 |
| Events in quadrant B | 2,785,202 | 451,468 |
| Events in quadrant C | 2,763,543 | 439,974 |
| Events in quadrant D | 3,260,713 | 428,037 |
| Mode M9 | |||
|---|---|---|---|
| Quadrant | BADHDUFLAG | Total packets | Discarded packets |
| A | 0 | 5 | 0 |
| B | 0 | 5 | 0 |
| C | 0 | 5 | 0 |
| D | 0 | 5 | 0 |
| Mode M0 | |||
|---|---|---|---|
| Quadrant | BADHDUFLAG | Total packets | Discarded packets |
| A | 0 | 11800 | 1 |
| B | 0 | 12041 | 1 |
| C | 0 | 11946 | 1 |
| D | 0 | 13620 | 1 |
| Mode SS | |||
|---|---|---|---|
| Quadrant | BADHDUFLAG | Total packets | Discarded packets |
| A | 0 | 116 | 0 |
| B | 0 | 116 | 0 |
| C | 0 | 116 | 0 |
| D | 0 | 116 | 0 |
| Quadrant | Total seconds | Saturated seconds | Saturation percentage |
|---|---|---|---|
| A | 5678 | 69 | 1.215217% |
| B | 5678 | 102 | 1.796407% |
| C | 5678 | 108 | 1.902078% |
| D | 5678 | 161 | 2.835505% |
Noise dominated data is calculated using 1-second bins in cleaned event files. If a bin has >2000 counts, and if more than 50% of those come from <1% of pixels, then it is considered to be noise-dominated and hence unusable.
| Quadrant | # 1 sec bins | Bins with >0 counts | Bins with >2000 counts | High rate bins dominated by noise | Noise dominated (total time) | Noise dominated (detector-on time) | Marked lightcurve |
|---|---|---|---|---|---|---|---|
| A | 6148 | 5678 | 0 | 0 | 0.00% | 0.00% | 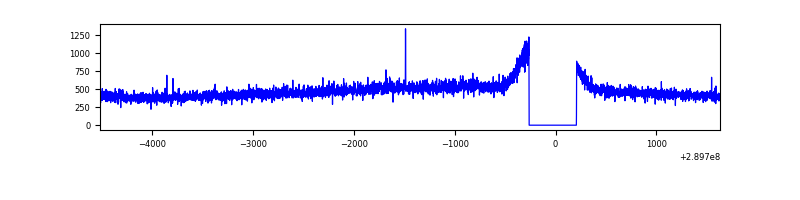 |
| B | 6148 | 5678 | 11 | 11 | 0.18% | 0.19% | 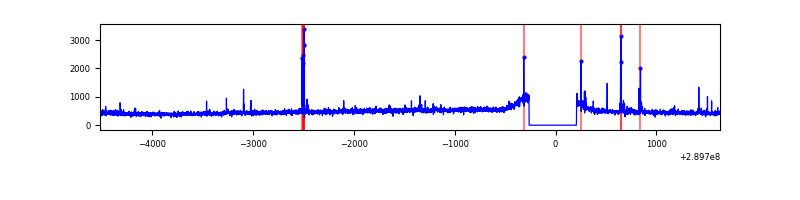 |
| C | 6148 | 5679 | 1 | 1 | 0.02% | 0.02% | 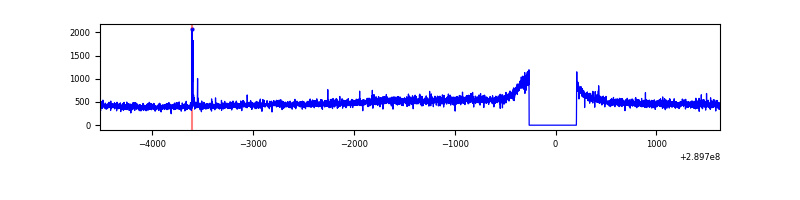 |
| D | 6148 | 5679 | 69 | 69 | 1.12% | 1.22% | 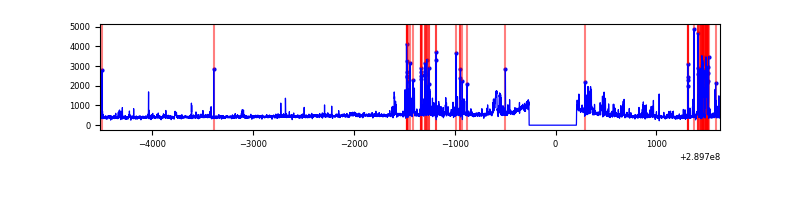 |
Top three noisy pixels from each quadrant. If the there are fewer than three noisy pixels in the level2.evt file, extra rows are filled as -1
| Pixel properties | Quadrant properties | ||||||
|---|---|---|---|---|---|---|---|
| Quadrant | DetID | PixID | Counts | Sigma | Mean | Median | Sigma |
| A | 13 | 254 | 8382 | 54.39 | 692 | 677 | 141.7 |
| A | 15 | 192 | 7066 | 45.1 | 692 | 677 | 141.7 |
| A | 0 | 226 | 5977 | 37.41 | 692 | 677 | 141.7 |
| B | 0 | 229 | 33478 | 246.85 | 691 | 674 | 132.9 |
| B | 4 | 173 | 20694 | 150.65 | 691 | 674 | 132.9 |
| B | 12 | 111 | 16386 | 118.24 | 691 | 674 | 132.9 |
| C | 14 | 238 | 104141 | 656.59 | 667 | 670 | 157.6 |
| C | 3 | 233 | 42719 | 266.83 | 667 | 670 | 157.6 |
| C | 9 | 54 | 14269 | 86.29 | 667 | 670 | 157.6 |
| D | 1 | 52 | 669187 | 4080.6 | 670 | 651 | 163.8 |
| D | 2 | 234 | 23133 | 137.23 | 670 | 651 | 163.8 |
| D | 7 | 238 | 22923 | 135.94 | 670 | 651 | 163.8 |
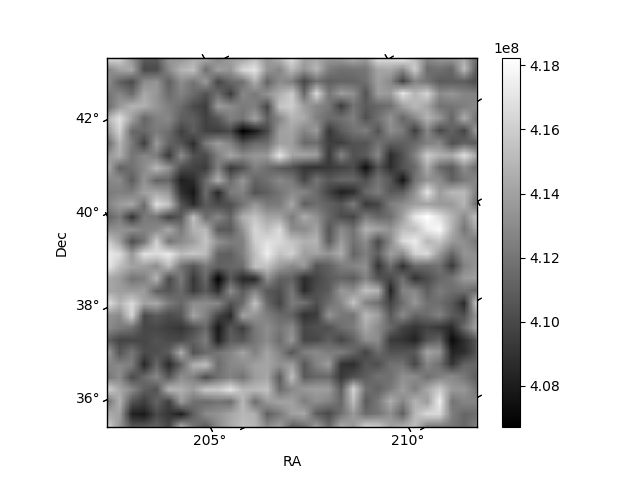
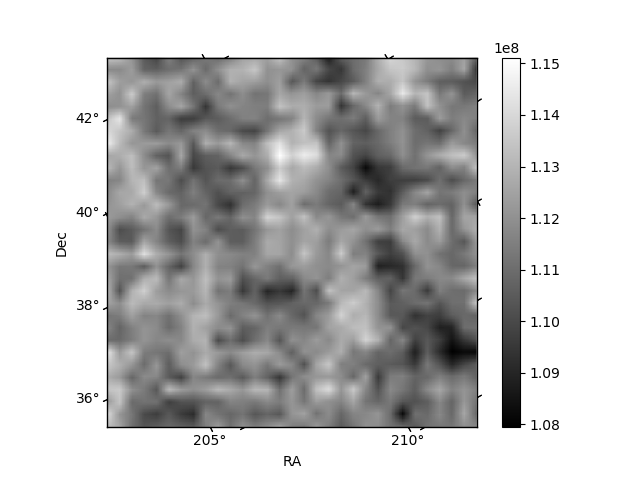
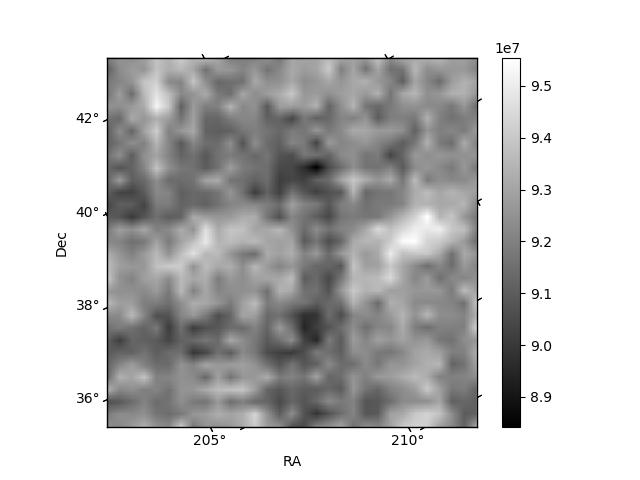
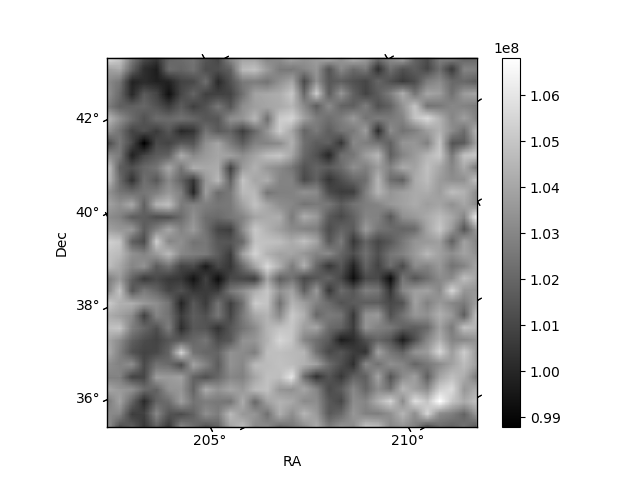
Histogram calculated using DETX and DETY for each event in the final _common_clean file
| Quadrant A | 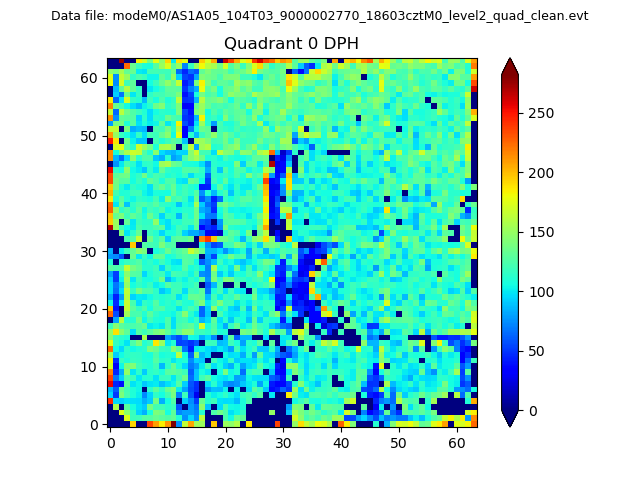 |
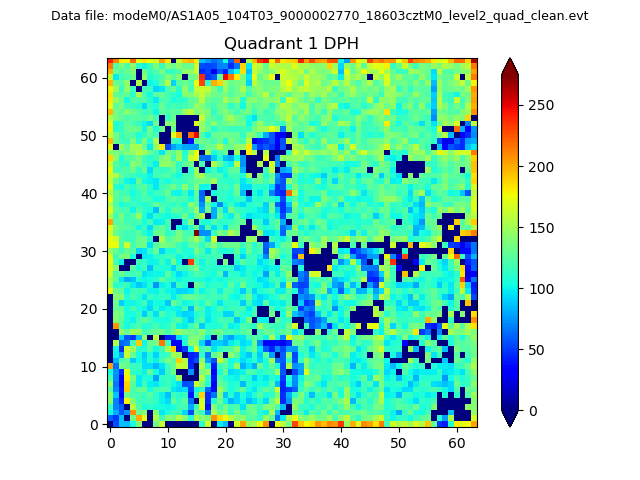 |
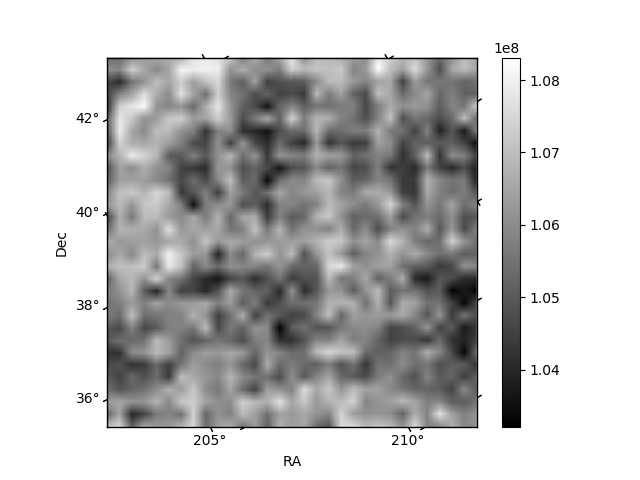
Quadrant B |
|---|---|---|---|
| Quadrant D | 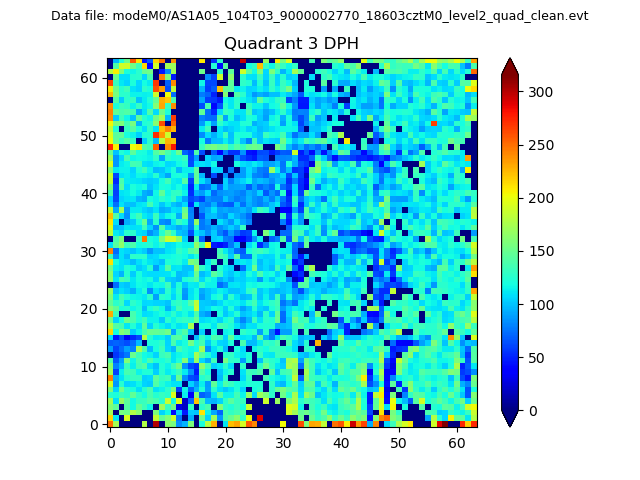 |
 |
Quadrant C |
| Plot type | Count rate plots | Images |
|---|---|---|
| Comparison with Poisson distribution Blue bars denote a histogram of data divided into 1 sec bins. Red curve is a Poisson curve with rate = median count rate of data. |
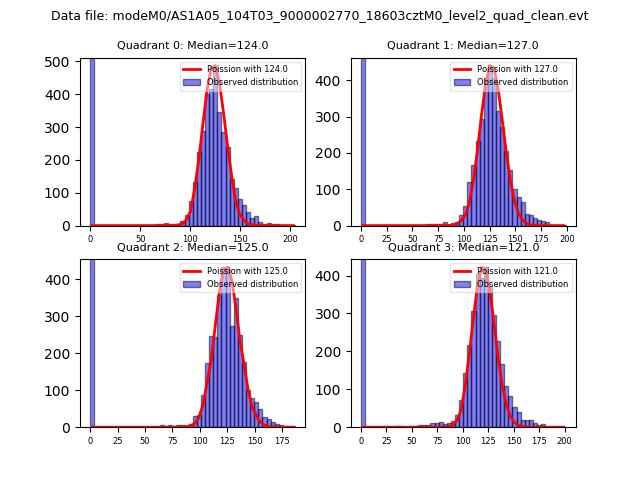 |
 |
| Quadrant-wise count rates Data is divided into 100 sec bins |
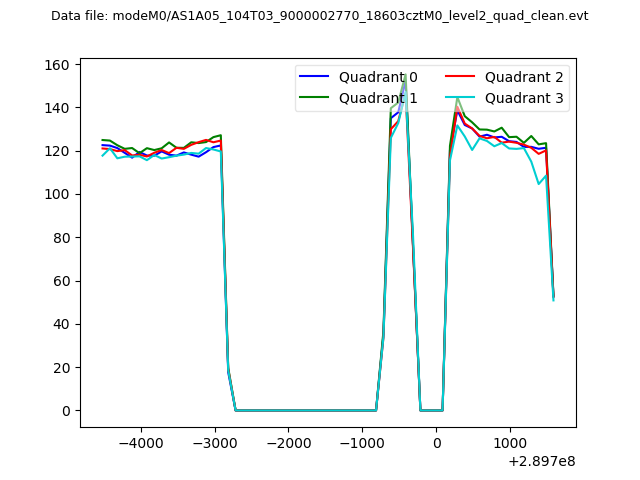 |
|
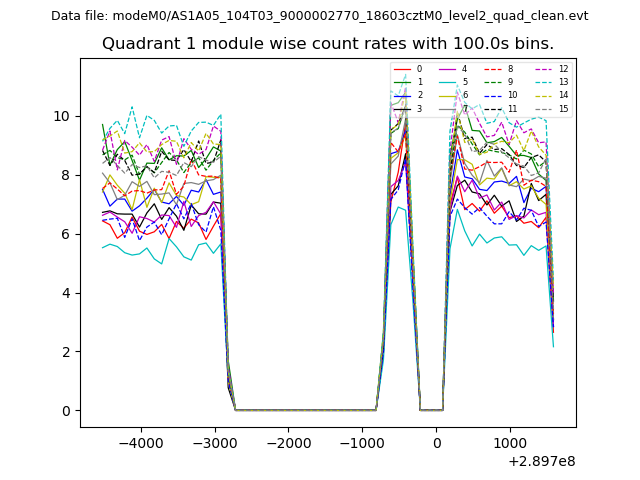
| Module-wise count rates for Quadrant A Data is divided into 100 sec bins |
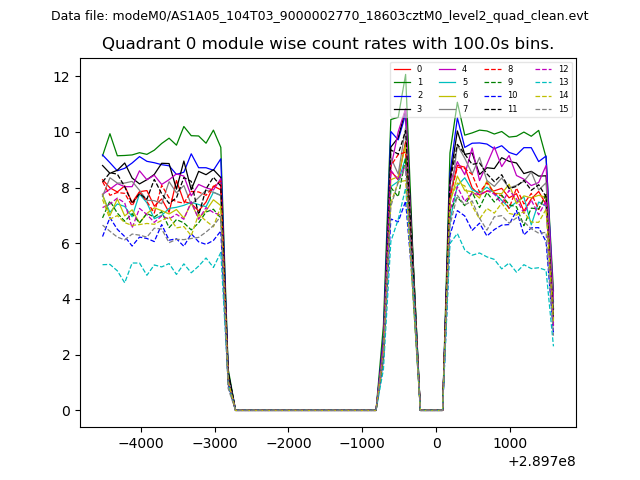 |
 |
| Module-wise count rates for Quadrant B Data is divided into 100 sec bins |
 |
 |
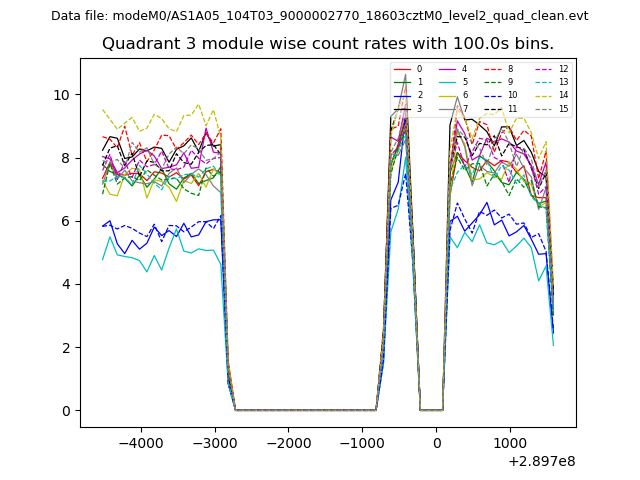
| Module-wise count rates for Quadrant C Data is divided into 100 sec bins |
 |
 |
| Module-wise count rates for Quadrant D Data is divided into 100 sec bins |
 |
 |
| Parameter | Plot |
|---|---|
| CZT HV Monitor | 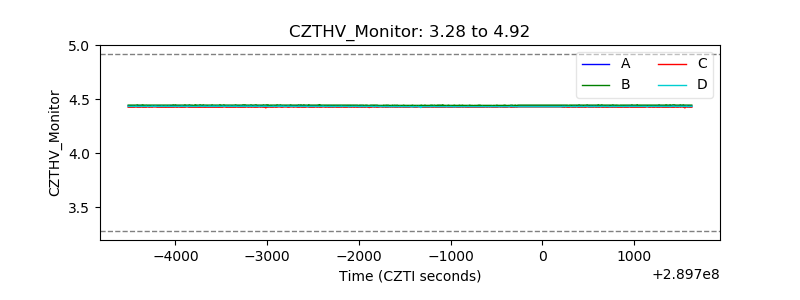 |
| D_VDD | 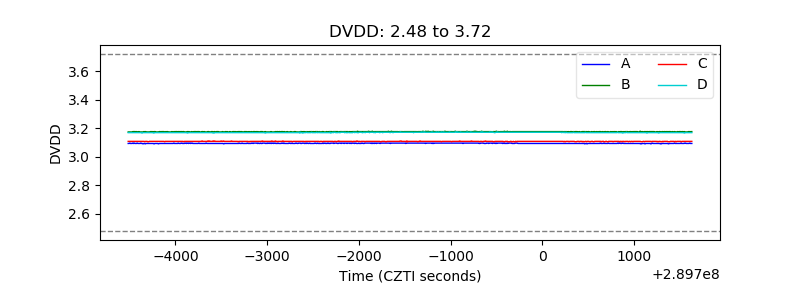 |
| Temperature 1 | 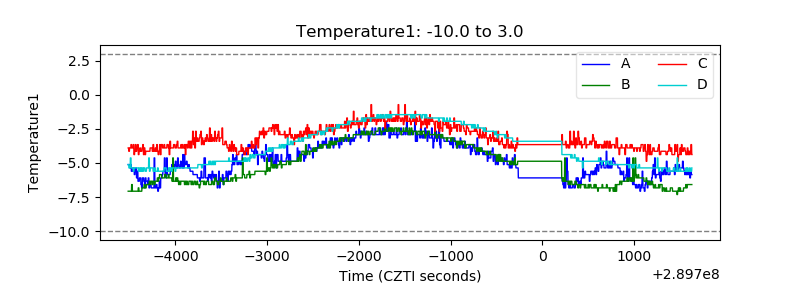 |
| Veto HV Monitor | 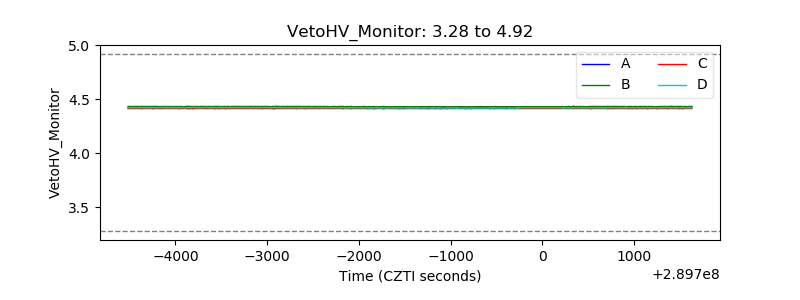 |
| Veto LLD | 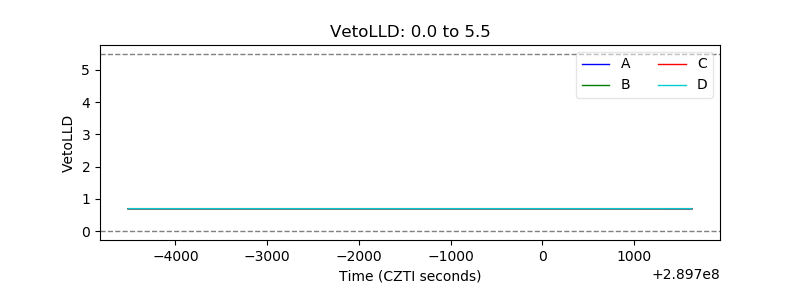 |
| Alpha Counter | 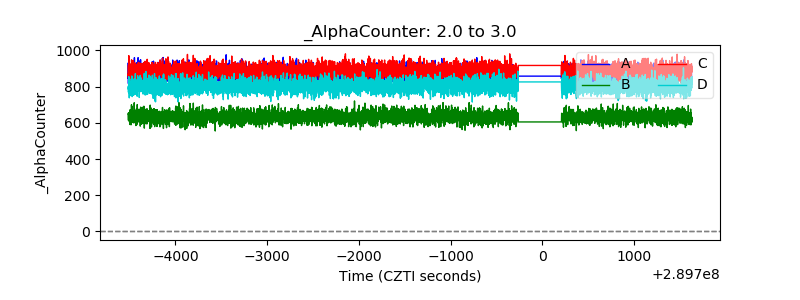 |
| _CPM_Rate | 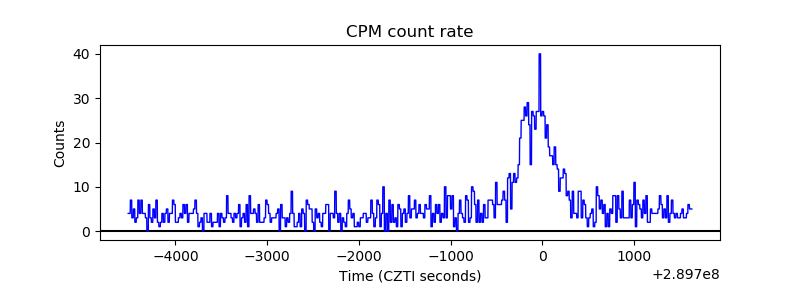 |
| CZT Counter | 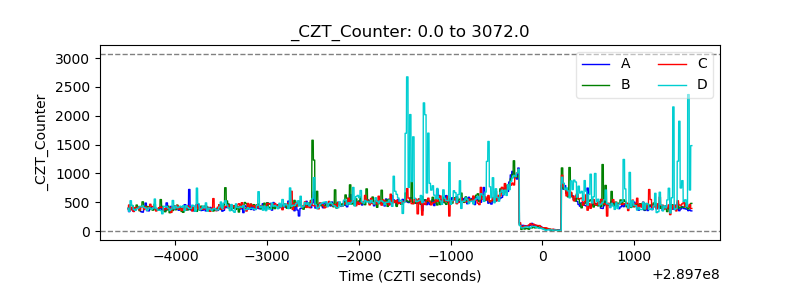 |
| +2.5 Volts monitor |  |
| +5 Volts monitor |  |
| _ROLL_ROT | 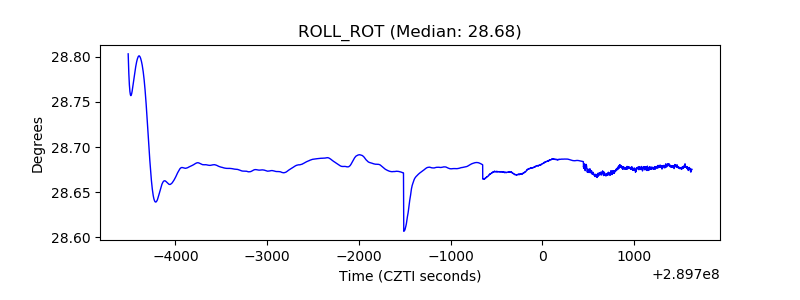 |
| _Roll_DEC | 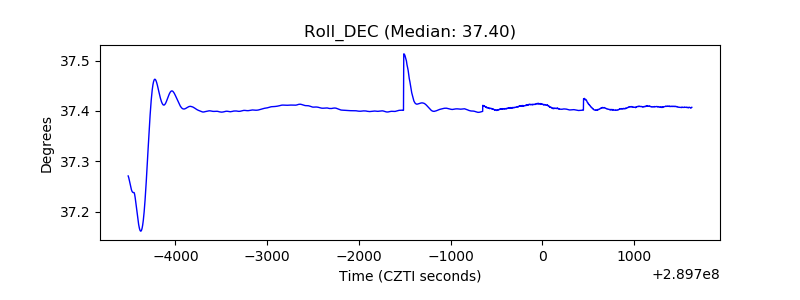 |
| _Roll_RA | 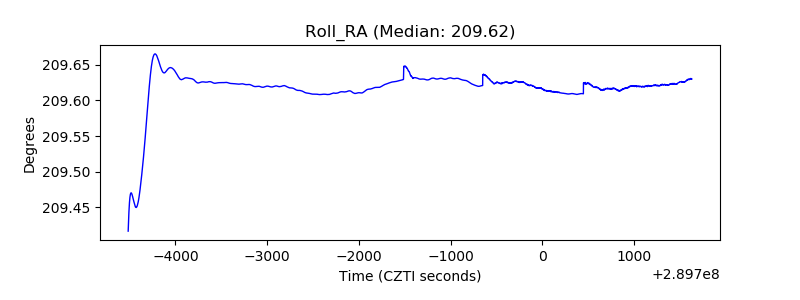 |
| Veto Counter | 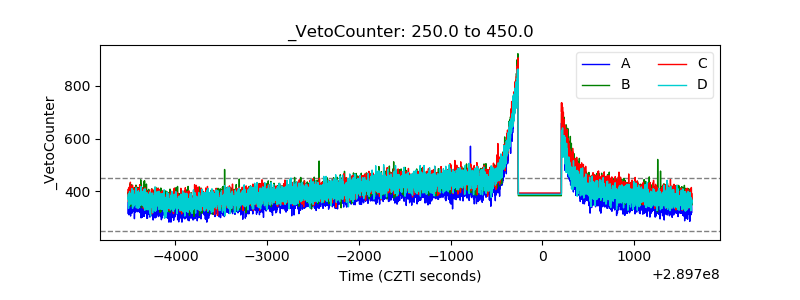 |