| Param | Original file | Final file |
|---|---|---|
| Filename | modeM0/AS1A05_104T03_9000002770_18604cztM0_level2.evt | modeM0/AS1A05_104T03_9000002770_18604cztM0_level2_quad_clean.evt |
| Size (bytes) | 602,372,160 | 117,849,600 |
| Size | 574.5 MB | 112.4 MB |
| Events in quadrant A | 4,043,208 | 751,791 |
| Events in quadrant B | 4,199,965 | 770,809 |
| Events in quadrant C | 4,300,449 | 747,125 |
| Events in quadrant D | 5,130,536 | 716,715 |
| Mode M9 | |||
|---|---|---|---|
| Quadrant | BADHDUFLAG | Total packets | Discarded packets |
| A | 0 | 5 | 0 |
| B | 0 | 5 | 0 |
| C | 0 | 5 | 0 |
| D | 0 | 5 | 0 |
| Mode M0 | |||
|---|---|---|---|
| Quadrant | BADHDUFLAG | Total packets | Discarded packets |
| A | 0 | 17676 | 2 |
| B | 0 | 18055 | 2 |
| C | 0 | 18233 | 2 |
| D | 0 | 21024 | 2 |
| Mode SS | |||
|---|---|---|---|
| Quadrant | BADHDUFLAG | Total packets | Discarded packets |
| A | 0 | 172 | 0 |
| B | 0 | 172 | 0 |
| C | 0 | 172 | 0 |
| D | 0 | 172 | 0 |
| Quadrant | Total seconds | Saturated seconds | Saturation percentage |
|---|---|---|---|
| A | 8375 | 155 | 1.850746% |
| B | 8375 | 227 | 2.710448% |
| C | 8375 | 245 | 2.925373% |
| D | 8375 | 365 | 4.358209% |
Noise dominated data is calculated using 1-second bins in cleaned event files. If a bin has >2000 counts, and if more than 50% of those come from <1% of pixels, then it is considered to be noise-dominated and hence unusable.
| Quadrant | # 1 sec bins | Bins with >0 counts | Bins with >2000 counts | High rate bins dominated by noise | Noise dominated (total time) | Noise dominated (detector-on time) | Marked lightcurve |
|---|---|---|---|---|---|---|---|
| A | 8930 | 8376 | 0 | 0 | 0.00% | 0.00% | 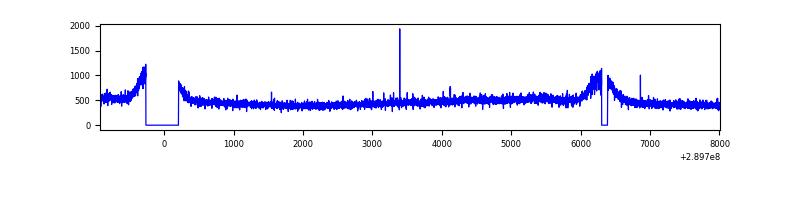 |
| B | 8930 | 8376 | 6 | 6 | 0.07% | 0.07% | 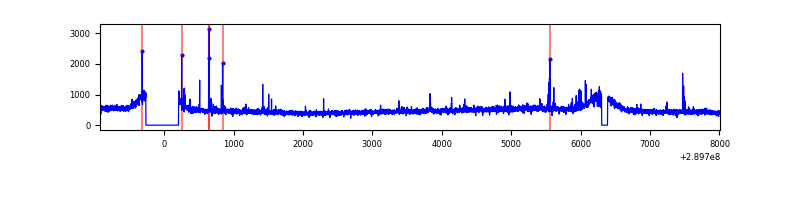 |
| C | 8930 | 8377 | 2 | 2 | 0.02% | 0.02% | 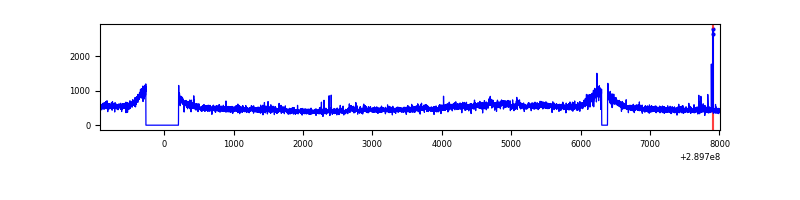 |
| D | 8930 | 8377 | 224 | 224 | 2.51% | 2.67% | 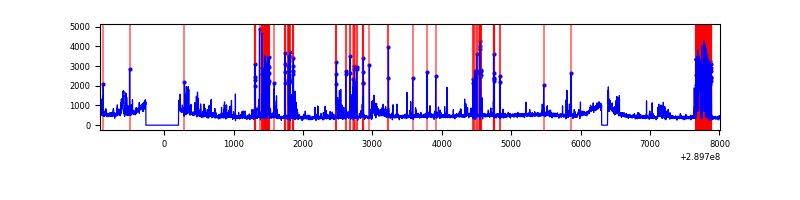 |
Top three noisy pixels from each quadrant. If the there are fewer than three noisy pixels in the level2.evt file, extra rows are filled as -1
| Pixel properties | Quadrant properties | ||||||
|---|---|---|---|---|---|---|---|
| Quadrant | DetID | PixID | Counts | Sigma | Mean | Median | Sigma |
| A | 13 | 254 | 12502 | 53.48 | 1044 | 1020 | 214.7 |
| A | 0 | 226 | 9030 | 37.31 | 1044 | 1020 | 214.7 |
| A | 15 | 192 | 8886 | 36.64 | 1044 | 1020 | 214.7 |
| B | 12 | 111 | 25771 | 121.81 | 1047 | 1018 | 203.2 |
| B | 4 | 173 | 22856 | 107.46 | 1047 | 1018 | 203.2 |
| B | 0 | 229 | 22118 | 103.83 | 1047 | 1018 | 203.2 |
| C | 3 | 233 | 175150 | 726.62 | 1010 | 1018 | 239.6 |
| C | 14 | 238 | 155208 | 643.4 | 1010 | 1018 | 239.6 |
| C | 9 | 54 | 24974 | 99.96 | 1010 | 1018 | 239.6 |
| D | 1 | 52 | 1205310 | 4862.35 | 1008 | 978 | 247.7 |
| D | 7 | 238 | 80173 | 319.74 | 1008 | 978 | 247.7 |
| D | 2 | 234 | 34684 | 136.08 | 1008 | 978 | 247.7 |
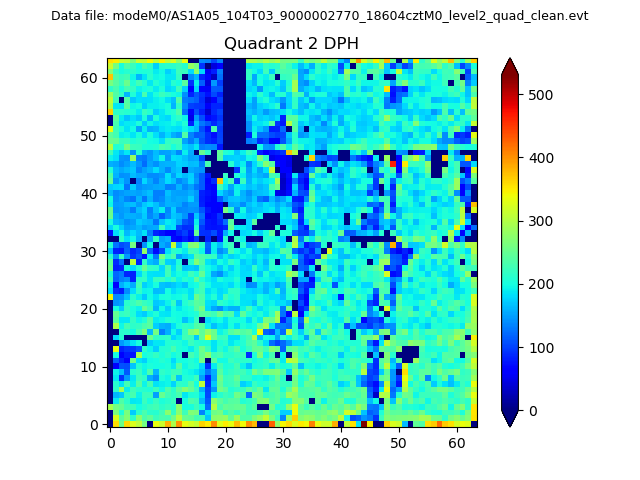
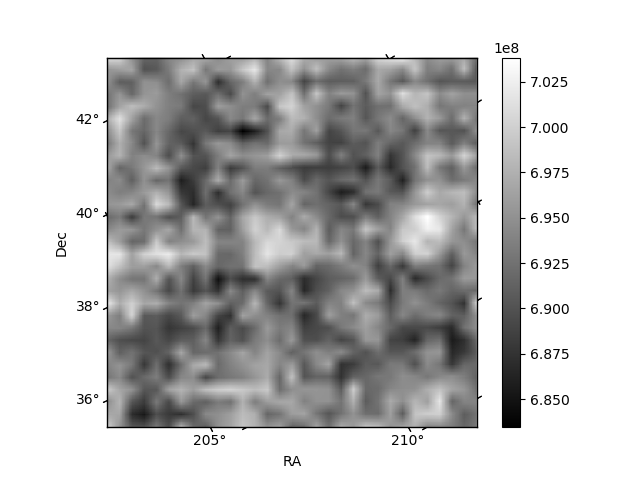
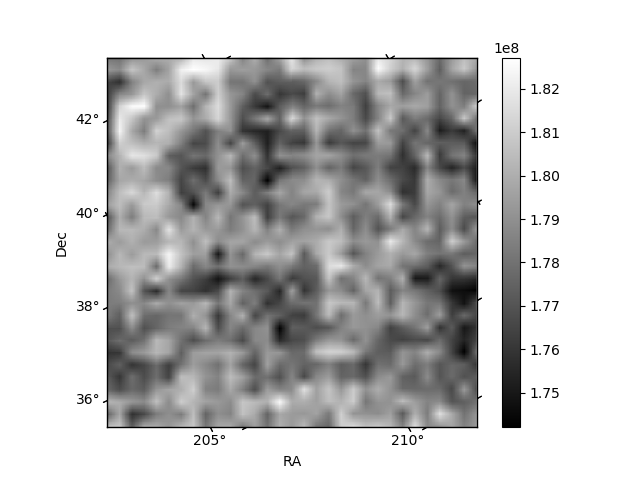
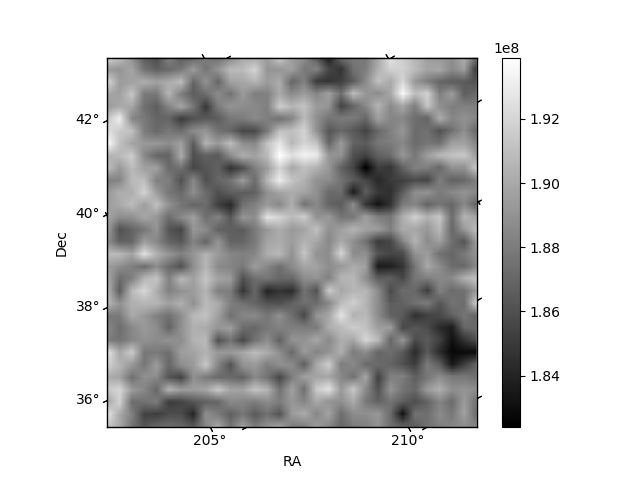
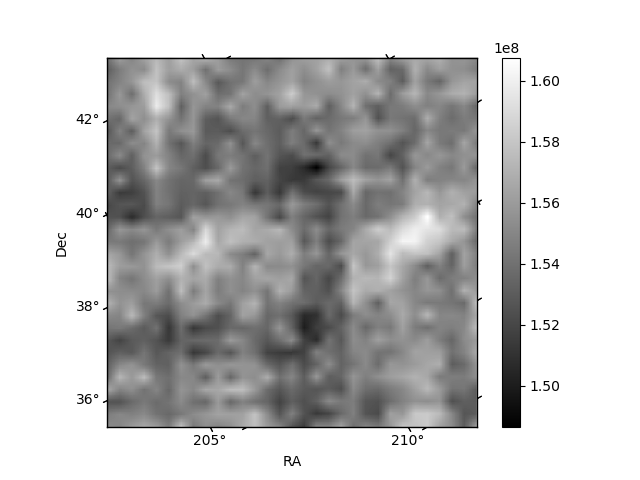
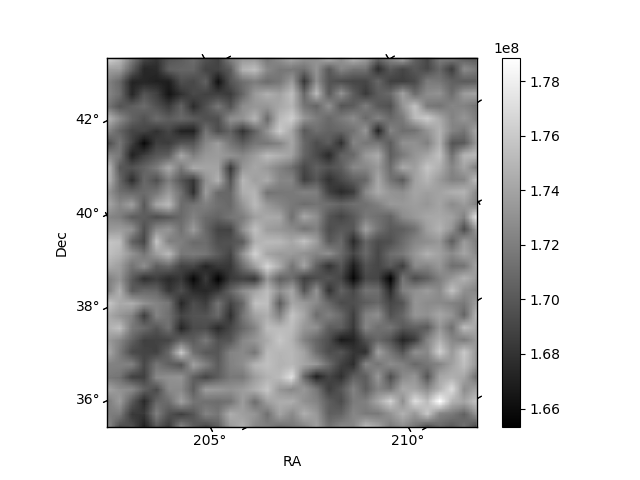
Histogram calculated using DETX and DETY for each event in the final _common_clean file
| Quadrant A | 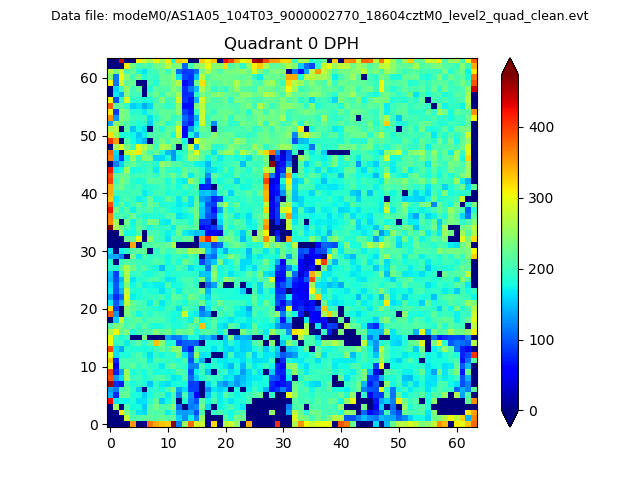 |
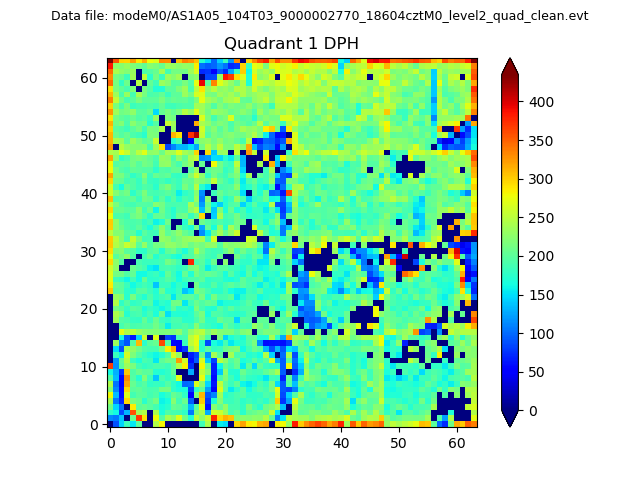 |
Quadrant B |
|---|---|---|---|
| Quadrant D | 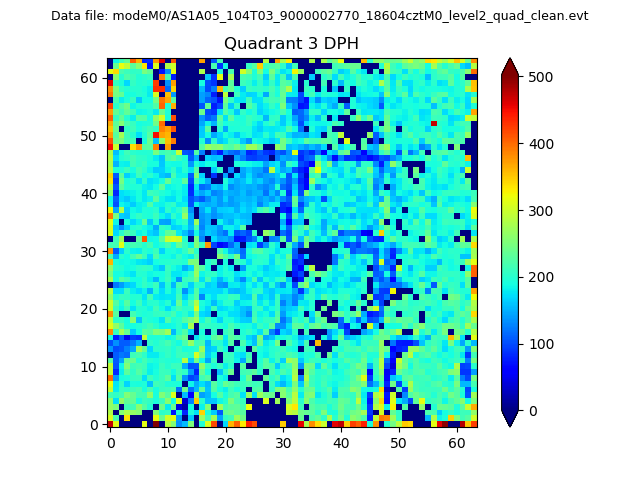 |
 |
Quadrant C |
| Plot type | Count rate plots | Images |
|---|---|---|
| Comparison with Poisson distribution Blue bars denote a histogram of data divided into 1 sec bins. Red curve is a Poisson curve with rate = median count rate of data. |
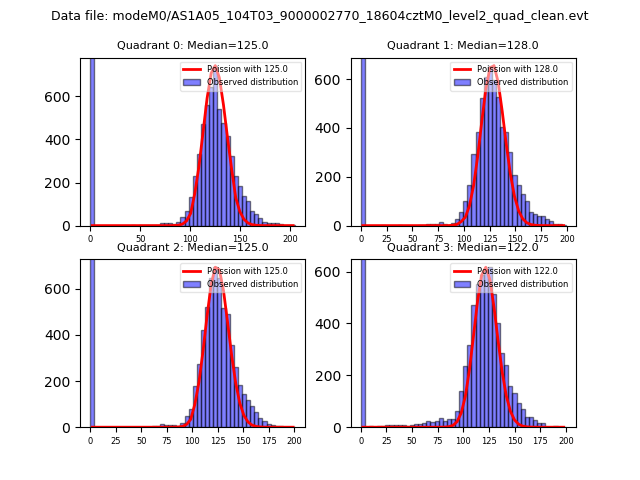 |
 |
| Quadrant-wise count rates Data is divided into 100 sec bins |
 |
|
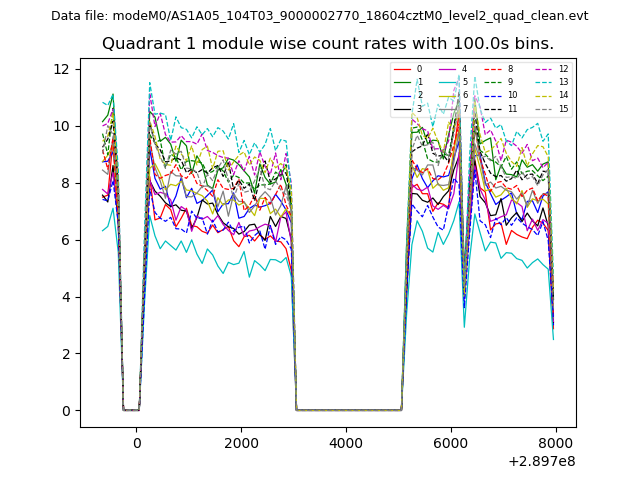
| Module-wise count rates for Quadrant A Data is divided into 100 sec bins |
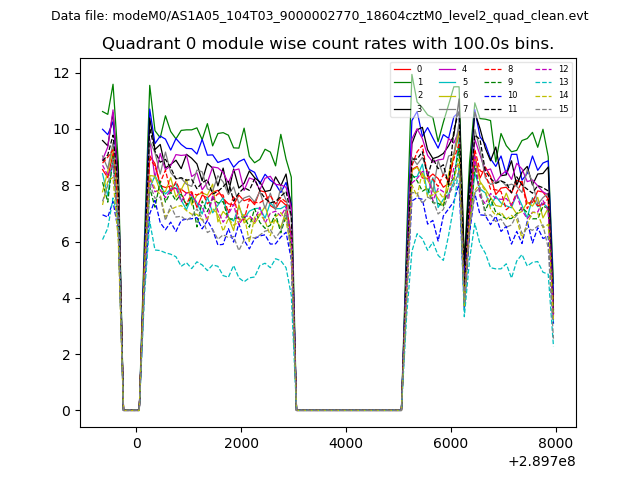 |
 |
| Module-wise count rates for Quadrant B Data is divided into 100 sec bins |
 |
 |
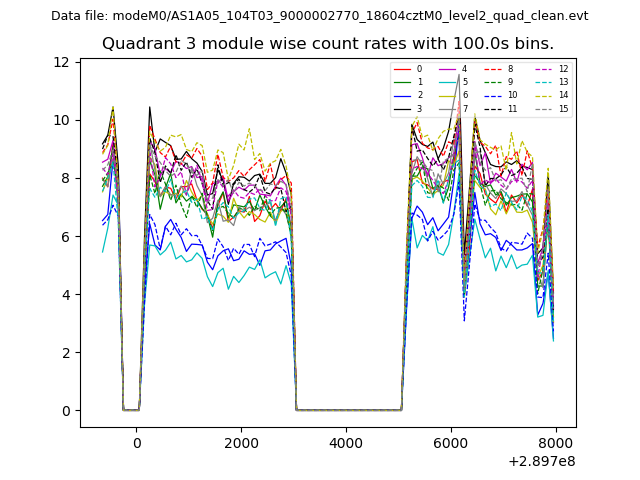
| Module-wise count rates for Quadrant C Data is divided into 100 sec bins |
 |
 |
| Module-wise count rates for Quadrant D Data is divided into 100 sec bins |
 |
 |
| Parameter | Plot |
|---|---|
| CZT HV Monitor | 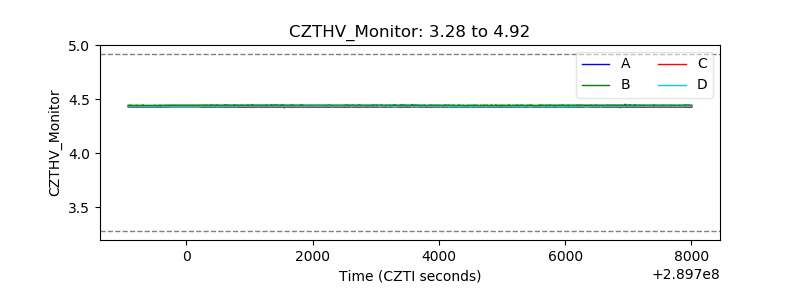 |
| D_VDD | 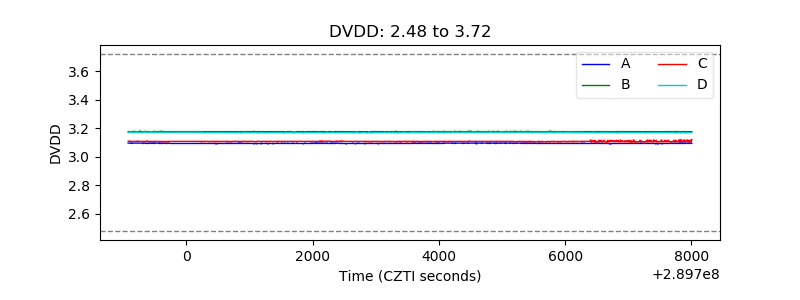 |
| Temperature 1 | 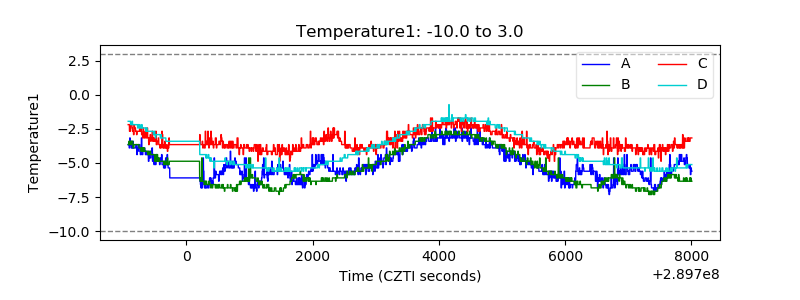 |
| Veto HV Monitor | 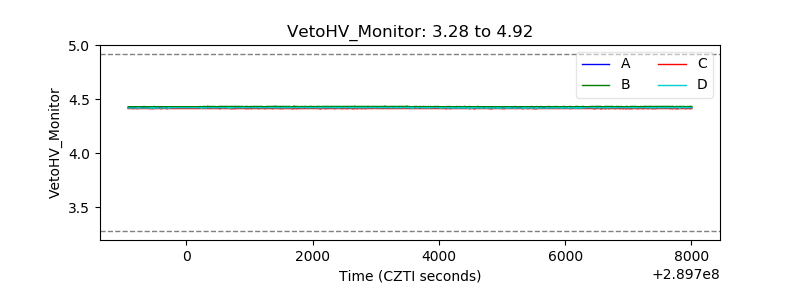 |
| Veto LLD | 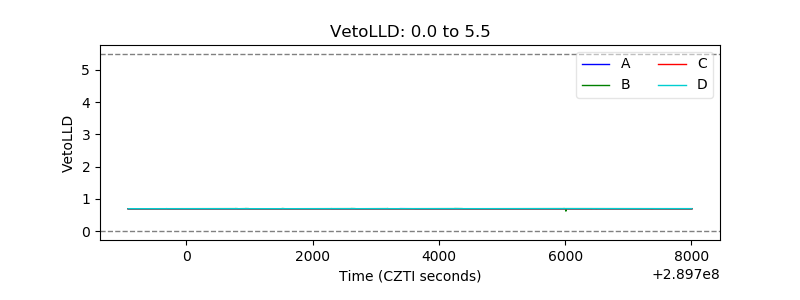 |
| Alpha Counter |  |
| _CPM_Rate | 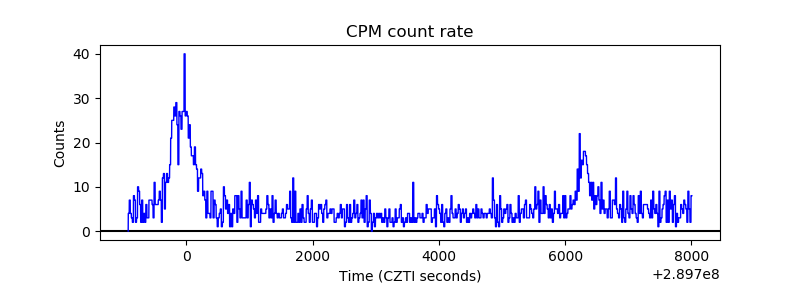 |
| CZT Counter | 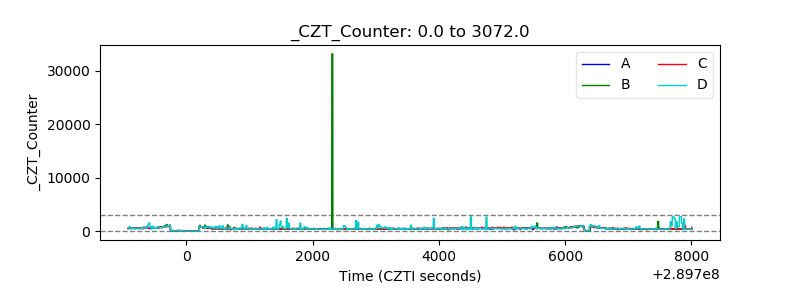 |
| +2.5 Volts monitor |  |
| +5 Volts monitor |  |
| _ROLL_ROT | 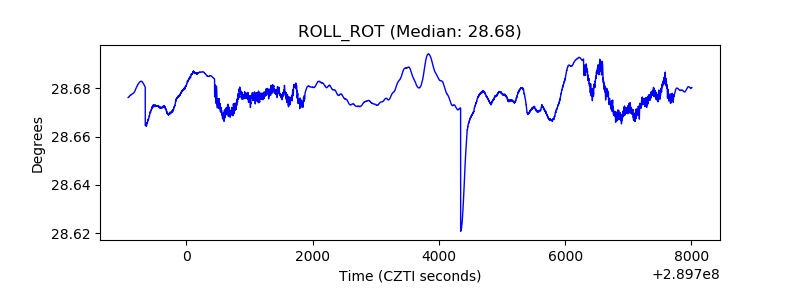 |
| _Roll_DEC | 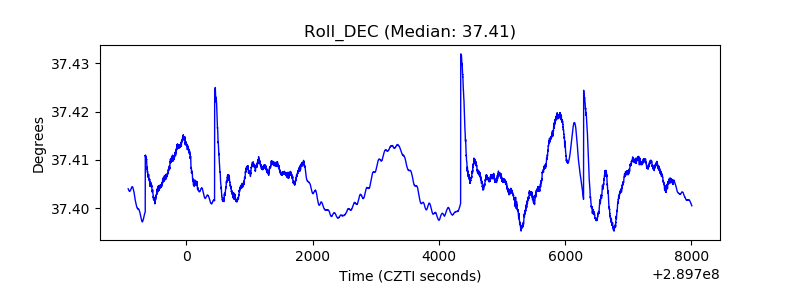 |
| _Roll_RA | 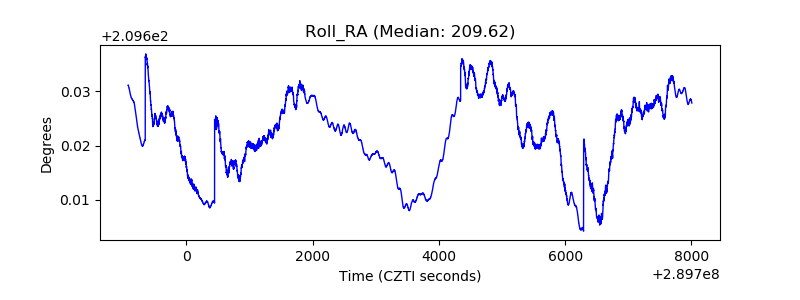 |
| Veto Counter | 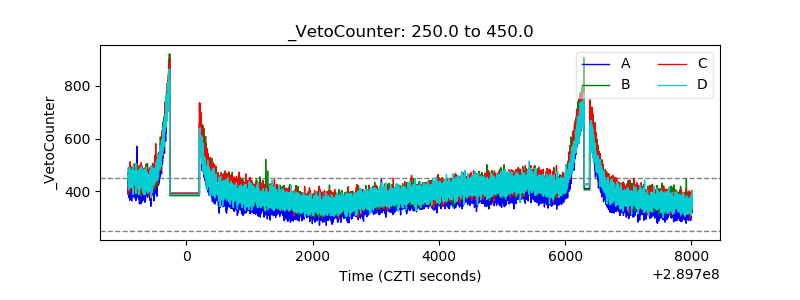 |