| Param | Original file | Final file |
|---|---|---|
| Filename | modeM0/AS1A05_104T03_9000002770_18607cztM0_level2.evt | modeM0/AS1A05_104T03_9000002770_18607cztM0_level2_quad_clean.evt |
| Size (bytes) | 150,128,640 | 35,084,160 |
| Size | 143.2 MB | 33.5 MB |
| Events in quadrant A | 892,347 | 232,604 |
| Events in quadrant B | 917,741 | 238,807 |
| Events in quadrant C | 1,063,765 | 231,030 |
| Events in quadrant D | 1,540,125 | 219,912 |
| Mode M9 | |||
|---|---|---|---|
| Quadrant | BADHDUFLAG | Total packets | Discarded packets |
| A | 0 | 2 | 0 |
| B | 0 | 2 | 0 |
| C | 0 | 2 | 0 |
| D | 0 | 2 | 0 |
| Mode M0 | |||
|---|---|---|---|
| Quadrant | BADHDUFLAG | Total packets | Discarded packets |
| A | 0 | 4081 | 1 |
| B | 0 | 4104 | 1 |
| C | 0 | 4529 | 1 |
| D | 0 | 5935 | 1 |
| Mode SS | |||
|---|---|---|---|
| Quadrant | BADHDUFLAG | Total packets | Discarded packets |
| A | 0 | 40 | 0 |
| B | 0 | 40 | 0 |
| C | 0 | 40 | 0 |
| D | 0 | 40 | 0 |
| Quadrant | Total seconds | Saturated seconds | Saturation percentage |
|---|---|---|---|
| A | 1914 | 117 | 6.112853% |
| B | 1914 | 130 | 6.792059% |
| C | 1914 | 174 | 9.090909% |
| D | 1915 | 211 | 11.018277% |
Noise dominated data is calculated using 1-second bins in cleaned event files. If a bin has >2000 counts, and if more than 50% of those come from <1% of pixels, then it is considered to be noise-dominated and hence unusable.
| Quadrant | # 1 sec bins | Bins with >0 counts | Bins with >2000 counts | High rate bins dominated by noise | Noise dominated (total time) | Noise dominated (detector-on time) | Marked lightcurve |
|---|---|---|---|---|---|---|---|
| A | 2099 | 1915 | 1 | 1 | 0.05% | 0.05% | 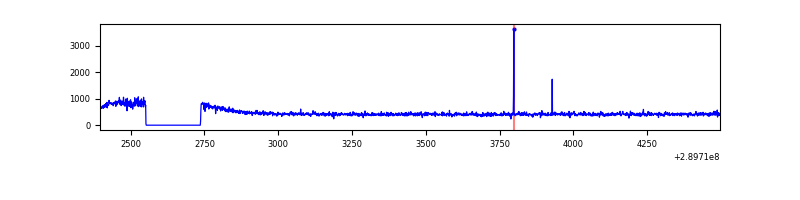 |
| B | 2099 | 1915 | 0 | 0 | 0.00% | 0.00% | 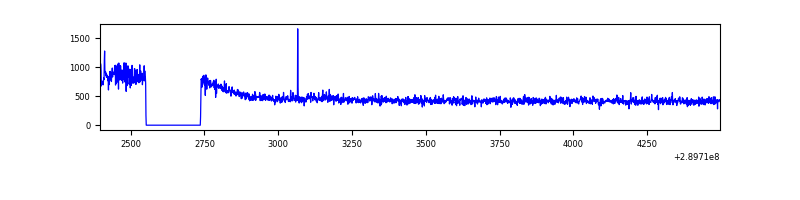 |
| C | 2099 | 1915 | 49 | 49 | 2.33% | 2.56% | 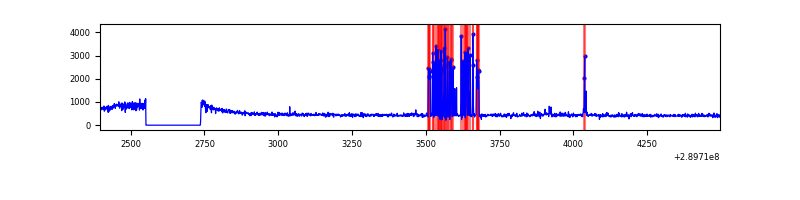 |
| D | 2100 | 1916 | 115 | 115 | 5.48% | 6.00% | 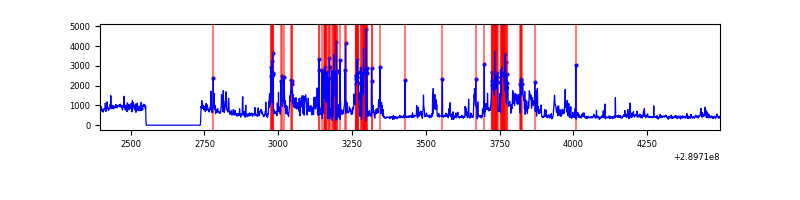 |
Top three noisy pixels from each quadrant. If the there are fewer than three noisy pixels in the level2.evt file, extra rows are filled as -1
| Pixel properties | Quadrant properties | ||||||
|---|---|---|---|---|---|---|---|
| Quadrant | DetID | PixID | Counts | Sigma | Mean | Median | Sigma |
| A | 9 | 143 | 5610 | 109.27 | 229 | 223 | 49.3 |
| A | 13 | 254 | 2952 | 55.35 | 229 | 223 | 49.3 |
| A | 3 | 137 | 1969 | 35.41 | 229 | 223 | 49.3 |
| B | 0 | 229 | 14626 | 308.2 | 230 | 223 | 46.7 |
| B | 12 | 111 | 5723 | 117.68 | 230 | 223 | 46.7 |
| B | 11 | 111 | 4991 | 102.02 | 230 | 223 | 46.7 |
| C | 3 | 233 | 163439 | 3033.8 | 219 | 220 | 53.8 |
| C | 14 | 238 | 33460 | 617.84 | 219 | 220 | 53.8 |
| C | 9 | 54 | 9703 | 176.26 | 219 | 220 | 53.8 |
| D | 7 | 238 | 438956 | 8004.72 | 218 | 211 | 54.8 |
| D | 1 | 52 | 216418 | 3944.61 | 218 | 211 | 54.8 |
| D | 7 | 96 | 48408 | 879.33 | 218 | 211 | 54.8 |
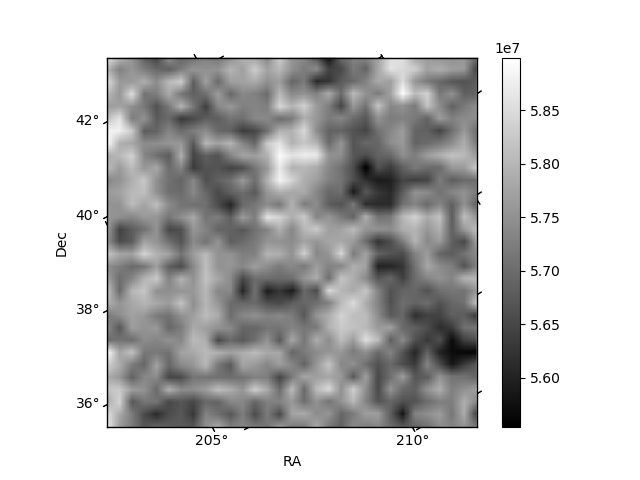
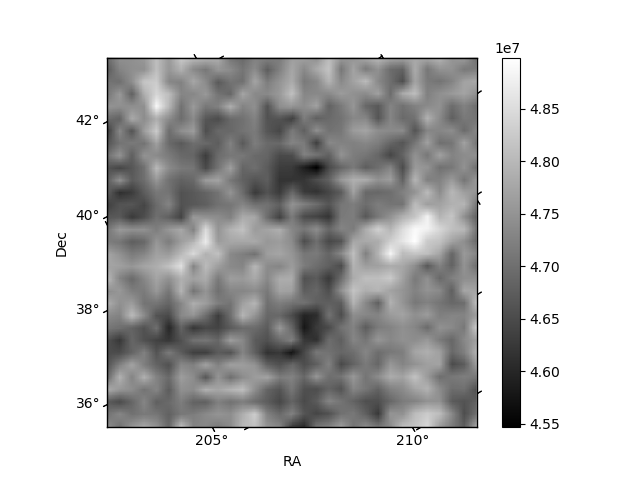
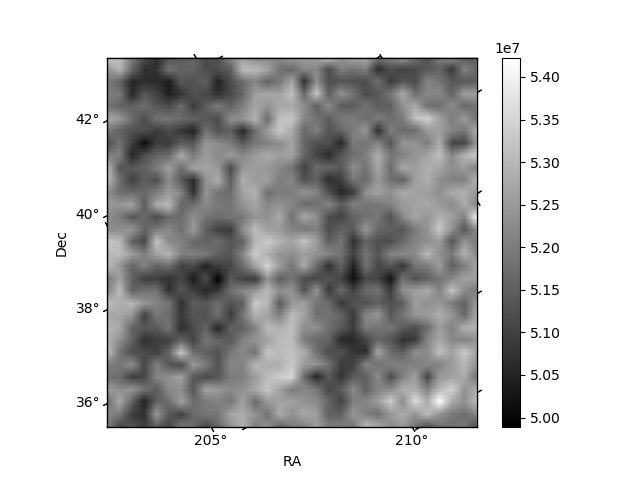
Histogram calculated using DETX and DETY for each event in the final _common_clean file
| Quadrant A | 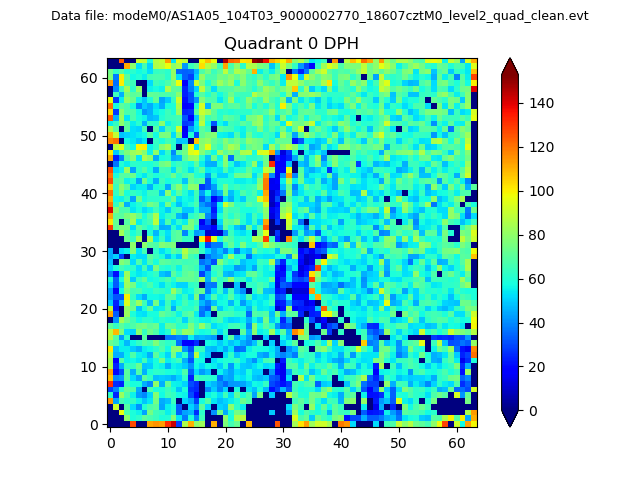 |
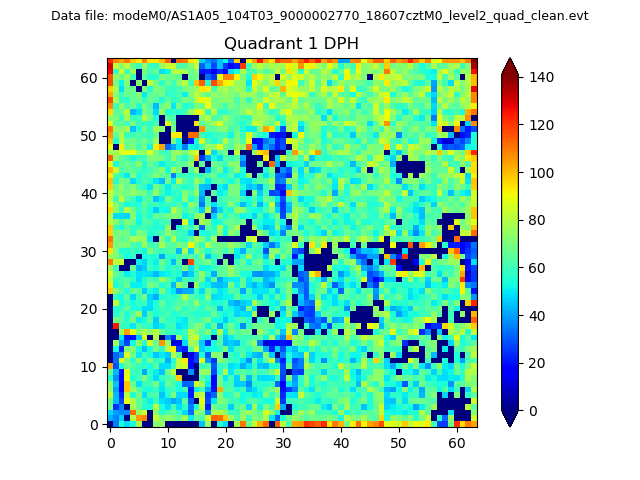 |
Quadrant B |
|---|---|---|---|
| Quadrant D | 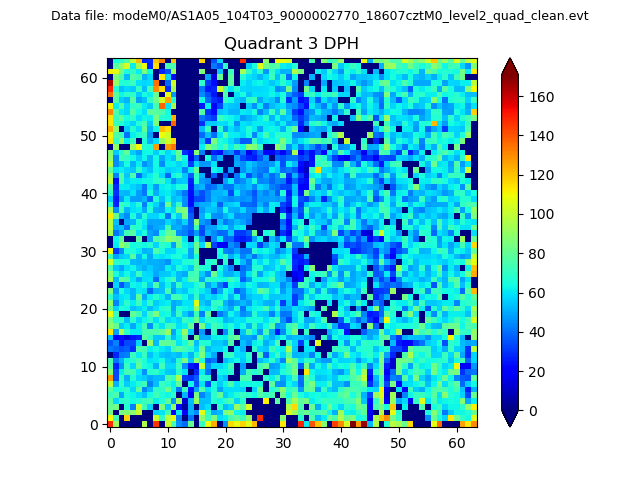 |
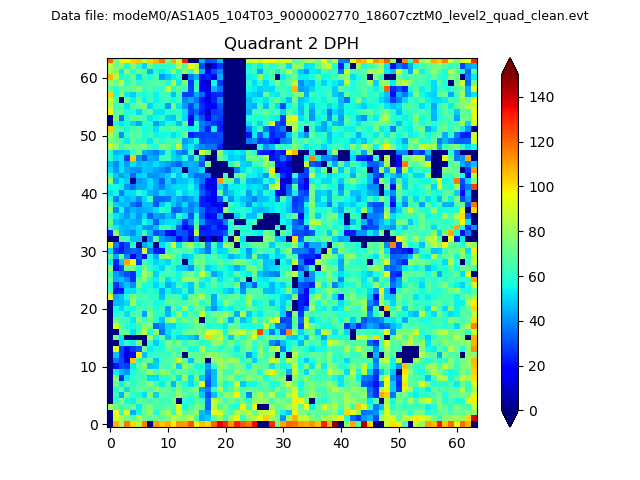 |
Quadrant C |
| Plot type | Count rate plots | Images |
|---|---|---|
| Comparison with Poisson distribution Blue bars denote a histogram of data divided into 1 sec bins. Red curve is a Poisson curve with rate = median count rate of data. |
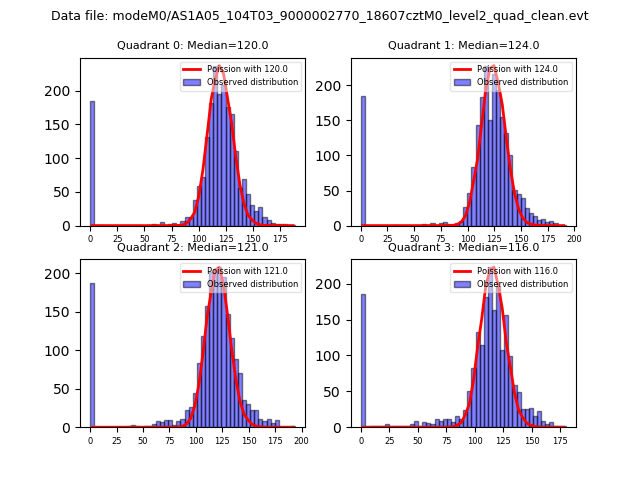 |
 |
| Quadrant-wise count rates Data is divided into 100 sec bins |
 |
|
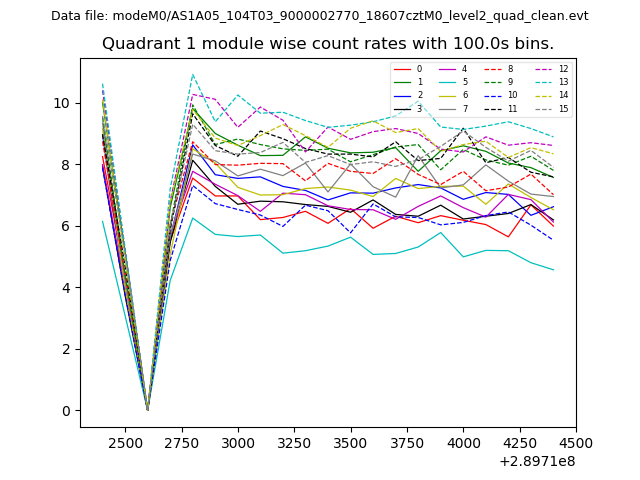
| Module-wise count rates for Quadrant A Data is divided into 100 sec bins |
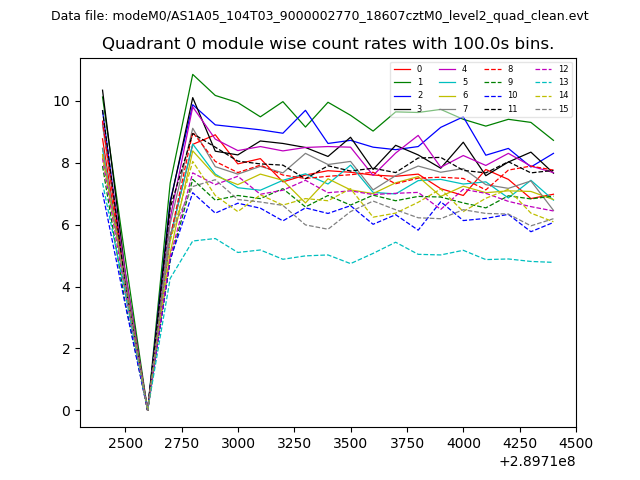 |
 |
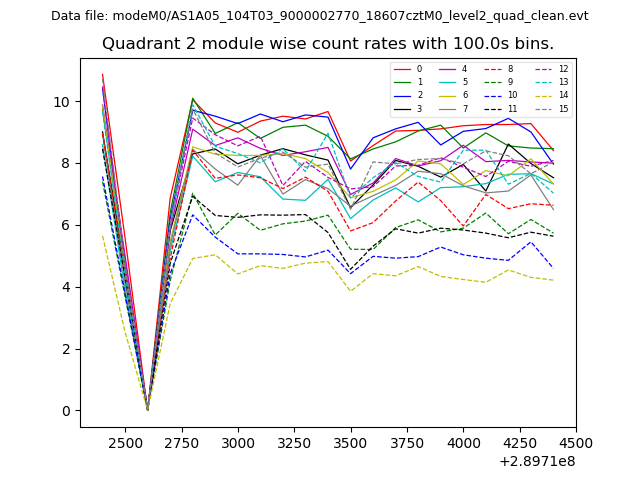
| Module-wise count rates for Quadrant B Data is divided into 100 sec bins |
 |
 |
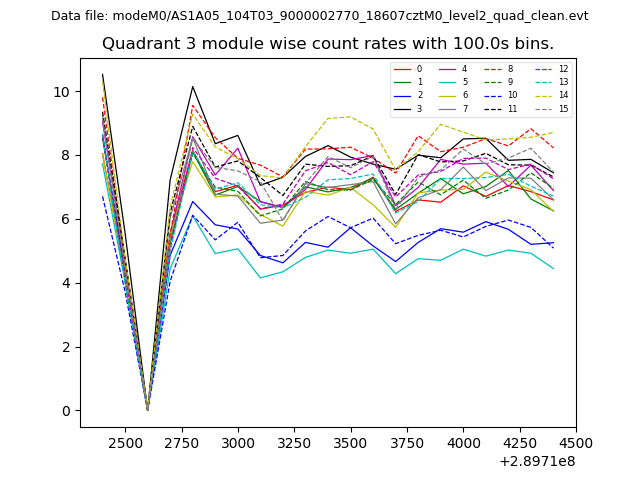
| Module-wise count rates for Quadrant C Data is divided into 100 sec bins |
 |
 |
| Module-wise count rates for Quadrant D Data is divided into 100 sec bins |
 |
 |
| Parameter | Plot |
|---|---|
| CZT HV Monitor | 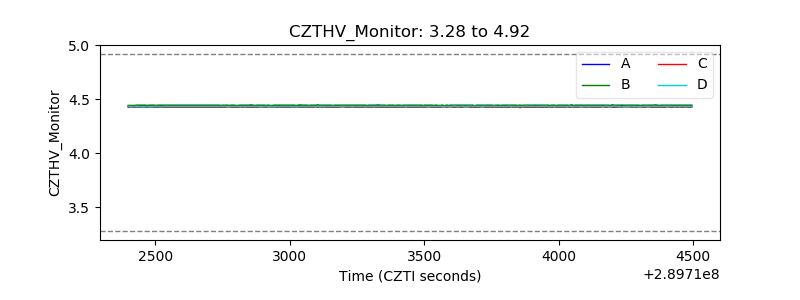 |
| D_VDD | 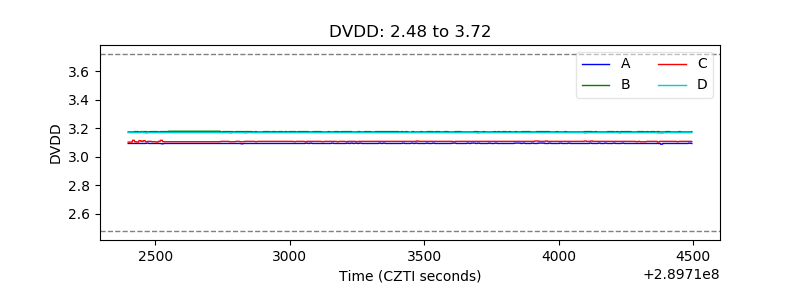 |
| Temperature 1 | 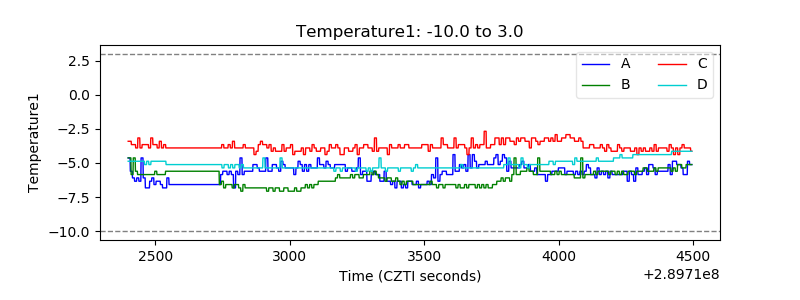 |
| Veto HV Monitor | 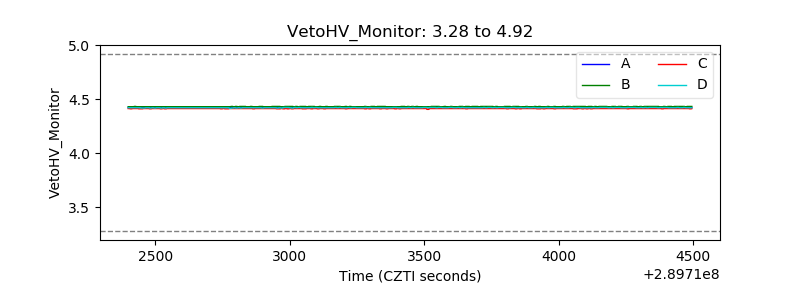 |
| Veto LLD | 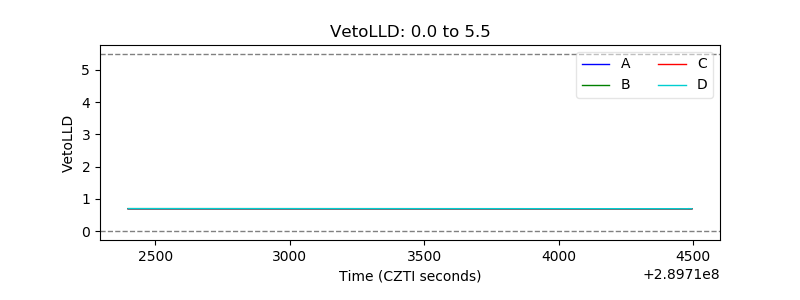 |
| Alpha Counter | 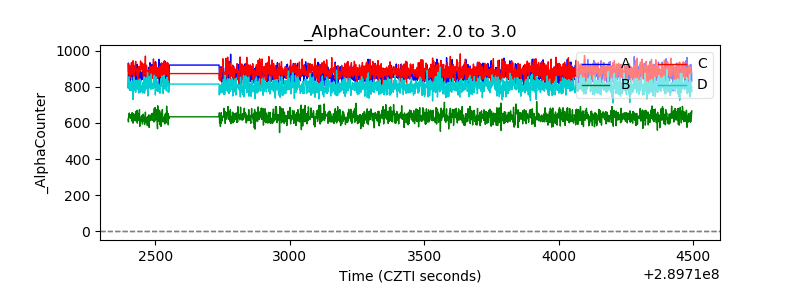 |
| _CPM_Rate | 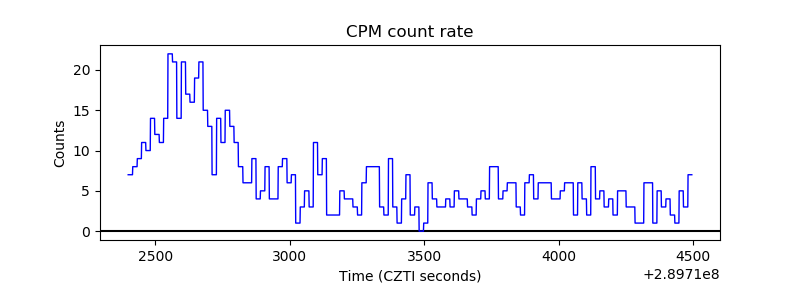 |
| CZT Counter | 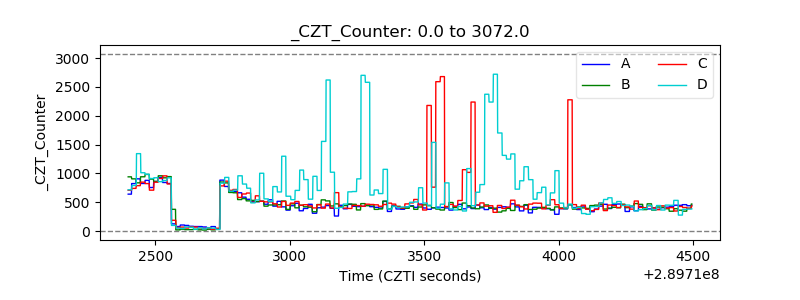 |
| +2.5 Volts monitor |  |
| +5 Volts monitor |  |
| _ROLL_ROT | 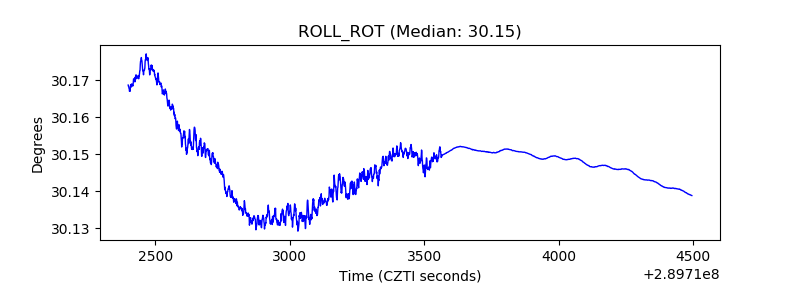 |
| _Roll_DEC | 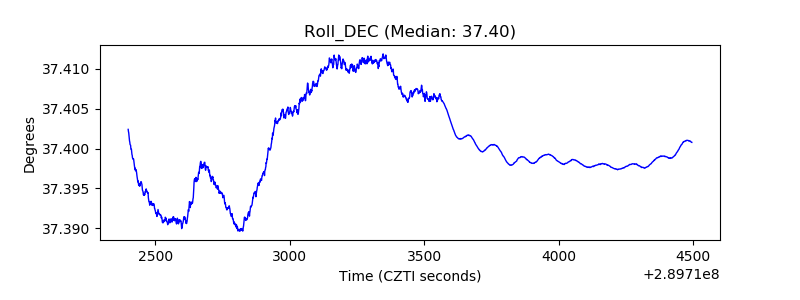 |
| _Roll_RA | 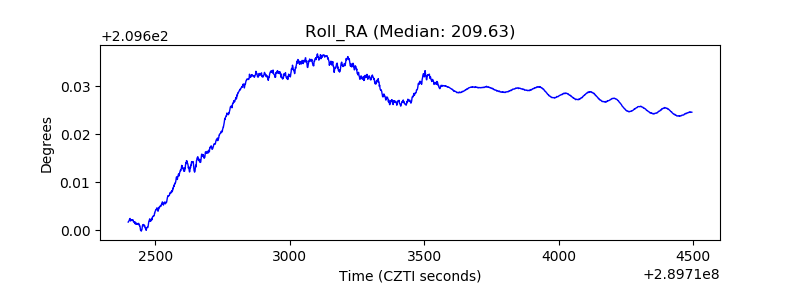 |
| Veto Counter |  |