| Param | Original file | Final file |
|---|---|---|
| Filename | modeM0/AS1A05_104T03_9000002770_18608cztM0_level2.evt | modeM0/AS1A05_104T03_9000002770_18608cztM0_level2_quad_clean.evt |
| Size (bytes) | 1,045,411,200 | 167,356,800 |
| Size | 997.0 MB | 159.6 MB |
| Events in quadrant A | 6,954,121 | 1,019,303 |
| Events in quadrant B | 7,012,256 | 1,045,289 |
| Events in quadrant C | 7,407,477 | 1,014,327 |
| Events in quadrant D | 9,294,523 | 976,773 |
| Mode M9 | |||
|---|---|---|---|
| Quadrant | BADHDUFLAG | Total packets | Discarded packets |
| A | 0 | 11 | 0 |
| B | 0 | 11 | 0 |
| C | 0 | 11 | 0 |
| D | 0 | 11 | 0 |
| Mode M0 | |||
|---|---|---|---|
| Quadrant | BADHDUFLAG | Total packets | Discarded packets |
| A | 0 | 30319 | 2 |
| B | 0 | 30243 | 2 |
| C | 0 | 31455 | 2 |
| D | 0 | 37268 | 2 |
| Mode SS | |||
|---|---|---|---|
| Quadrant | BADHDUFLAG | Total packets | Discarded packets |
| A | 0 | 298 | 0 |
| B | 0 | 298 | 0 |
| C | 0 | 298 | 0 |
| D | 0 | 298 | 0 |
| Quadrant | Total seconds | Saturated seconds | Saturation percentage |
|---|---|---|---|
| A | 14671 | 147 | 1.001977% |
| B | 14671 | 151 | 1.029241% |
| C | 14672 | 235 | 1.601690% |
| D | 14672 | 490 | 3.339695% |
Noise dominated data is calculated using 1-second bins in cleaned event files. If a bin has >2000 counts, and if more than 50% of those come from <1% of pixels, then it is considered to be noise-dominated and hence unusable.
| Quadrant | # 1 sec bins | Bins with >0 counts | Bins with >2000 counts | High rate bins dominated by noise | Noise dominated (total time) | Noise dominated (detector-on time) | Marked lightcurve |
|---|---|---|---|---|---|---|---|
| A | 15721 | 14673 | 35 | 35 | 0.22% | 0.24% | 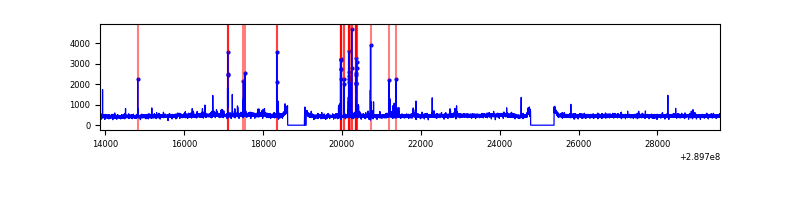 |
| B | 15721 | 14672 | 7 | 7 | 0.04% | 0.05% | 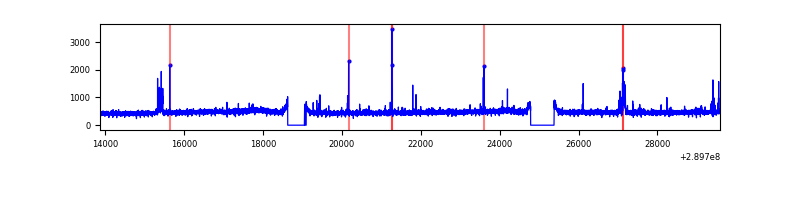 |
| C | 15722 | 14674 | 31 | 31 | 0.20% | 0.21% | 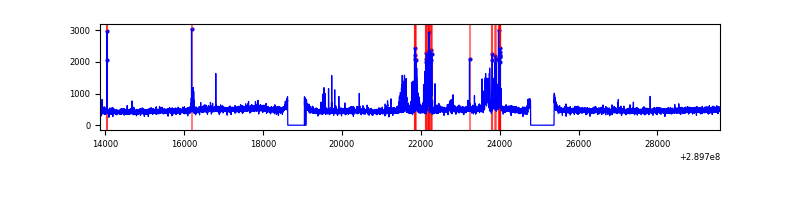 |
| D | 15722 | 14674 | 368 | 368 | 2.34% | 2.51% | 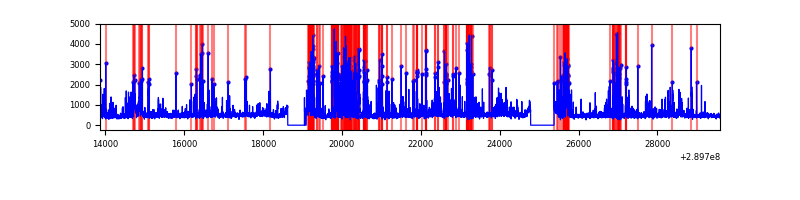 |
Top three noisy pixels from each quadrant. If the there are fewer than three noisy pixels in the level2.evt file, extra rows are filled as -1
| Pixel properties | Quadrant properties | ||||||
|---|---|---|---|---|---|---|---|
| Quadrant | DetID | PixID | Counts | Sigma | Mean | Median | Sigma |
| A | 0 | 13 | 214800 | 604.6 | 1734 | 1693 | 352.5 |
| A | 9 | 143 | 42447 | 115.62 | 1734 | 1693 | 352.5 |
| A | 13 | 254 | 22836 | 59.98 | 1734 | 1693 | 352.5 |
| B | 0 | 230 | 125177 | 374.38 | 1729 | 1685 | 329.9 |
| B | 12 | 111 | 41421 | 120.47 | 1729 | 1685 | 329.9 |
| B | 0 | 229 | 37311 | 108.01 | 1729 | 1685 | 329.9 |
| C | 3 | 233 | 617591 | 1578.35 | 1667 | 1677 | 390.2 |
| C | 14 | 238 | 257282 | 655.02 | 1667 | 1677 | 390.2 |
| C | 9 | 54 | 32122 | 78.02 | 1667 | 1677 | 390.2 |
| D | 1 | 52 | 2416191 | 5950.89 | 1679 | 1630 | 405.7 |
| D | 7 | 238 | 253133 | 619.85 | 1679 | 1630 | 405.7 |
| D | 5 | 222 | 106050 | 257.35 | 1679 | 1630 | 405.7 |
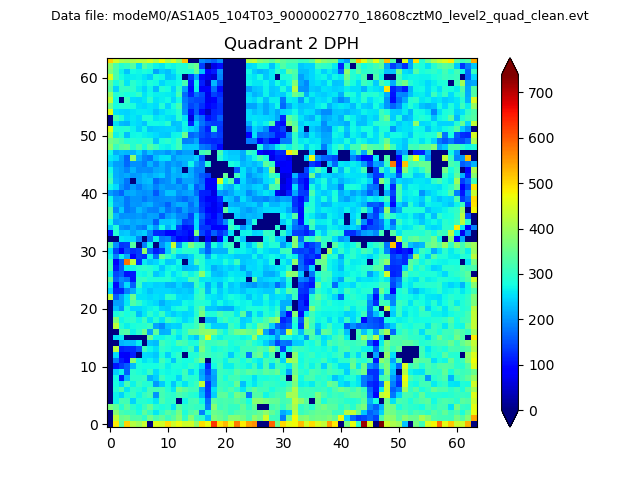
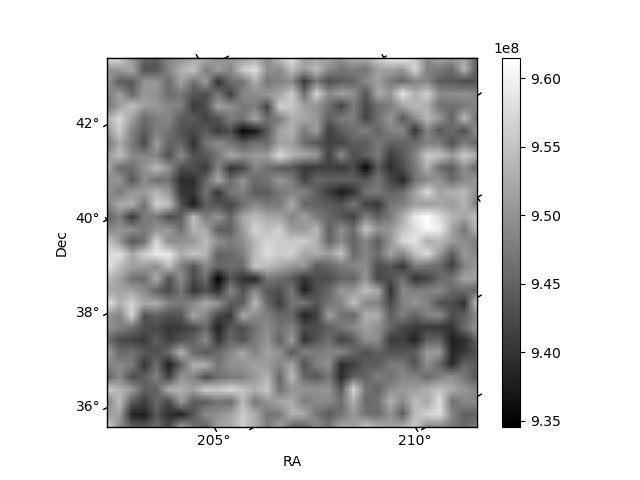
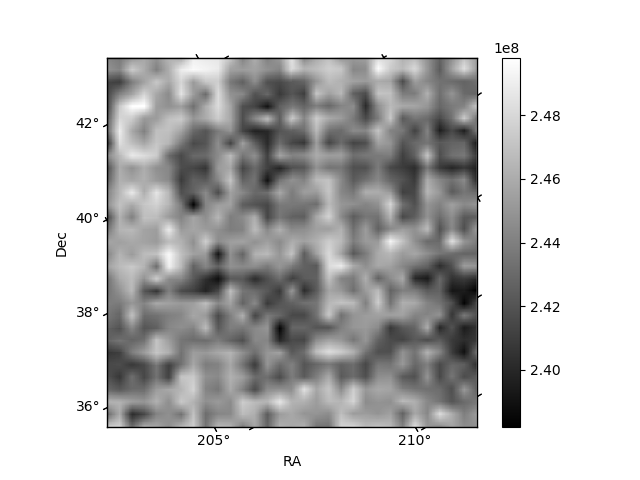
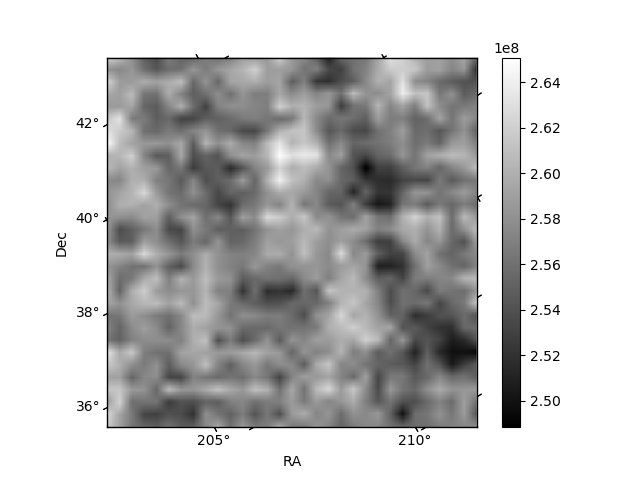
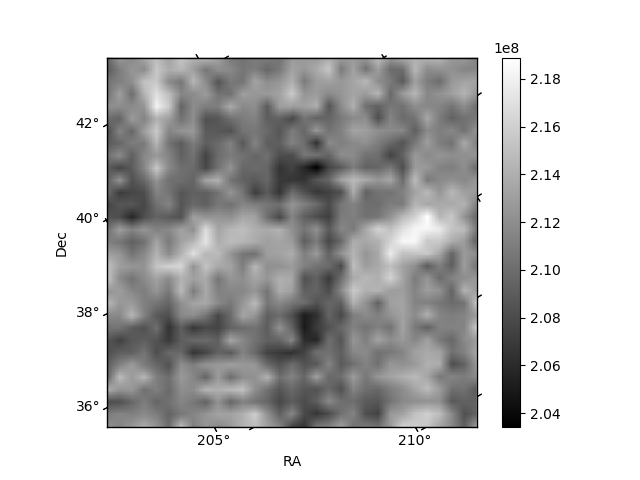
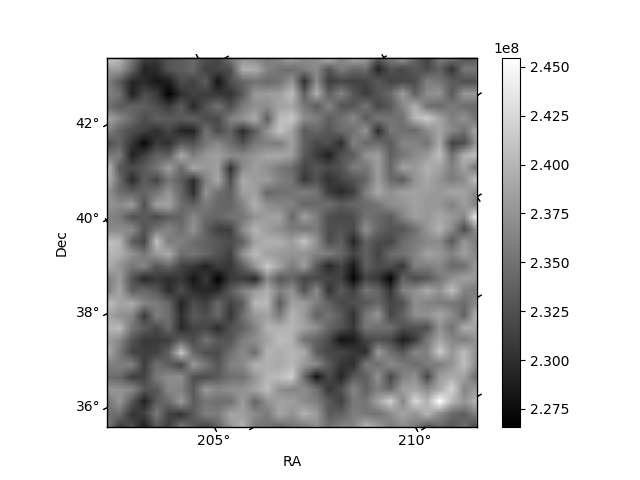
Histogram calculated using DETX and DETY for each event in the final _common_clean file
| Quadrant A | 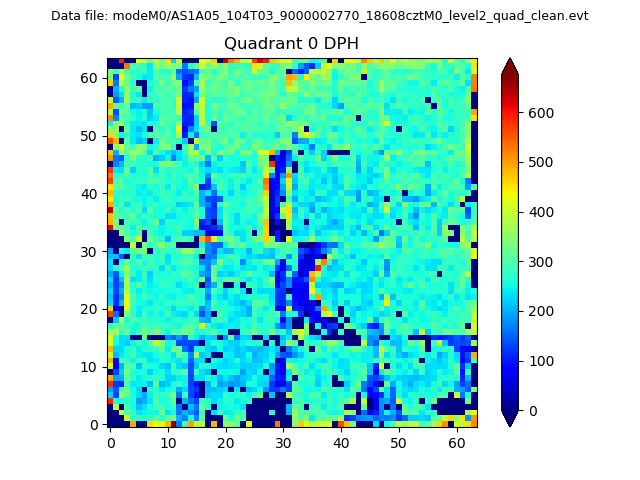 |
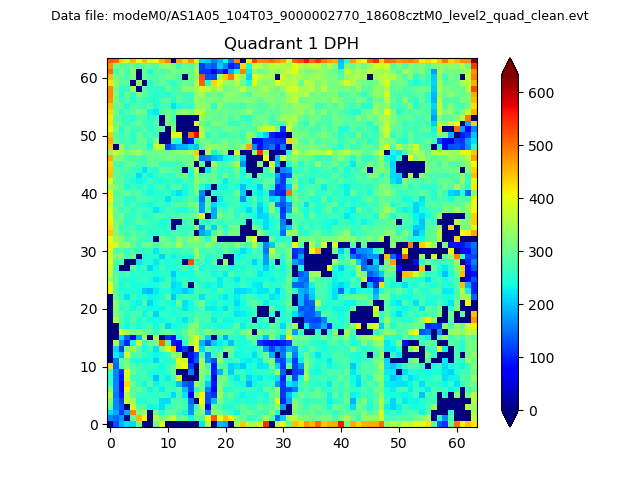 |
Quadrant B |
|---|---|---|---|
| Quadrant D | 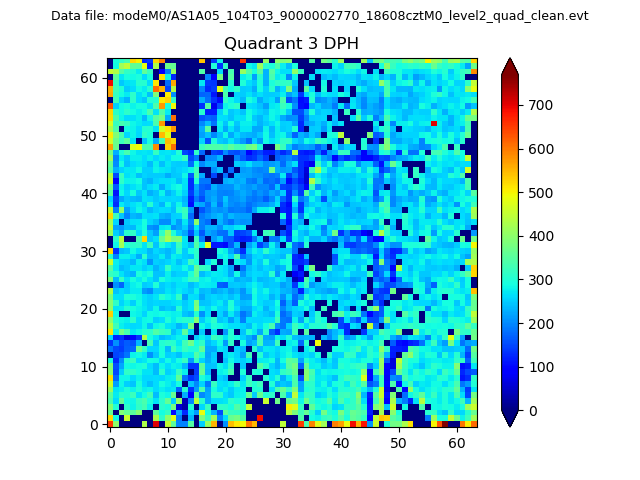 |
 |
Quadrant C |
| Plot type | Count rate plots | Images |
|---|---|---|
| Comparison with Poisson distribution Blue bars denote a histogram of data divided into 1 sec bins. Red curve is a Poisson curve with rate = median count rate of data. |
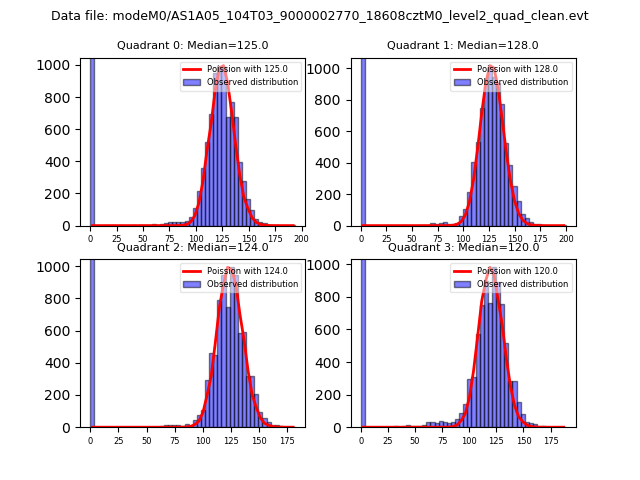 |
 |
| Quadrant-wise count rates Data is divided into 100 sec bins |
 |
|
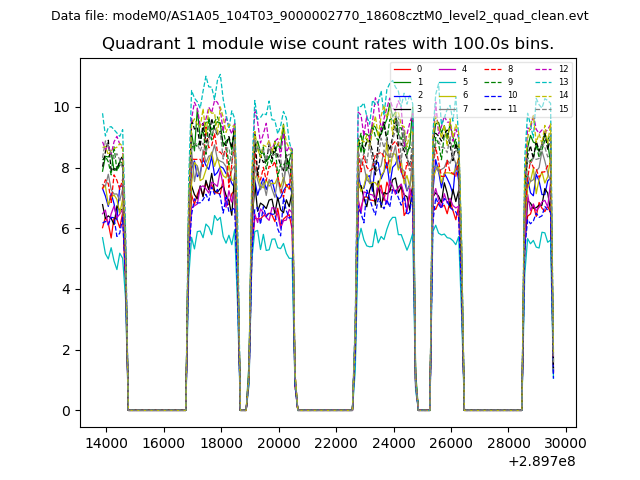
| Module-wise count rates for Quadrant A Data is divided into 100 sec bins |
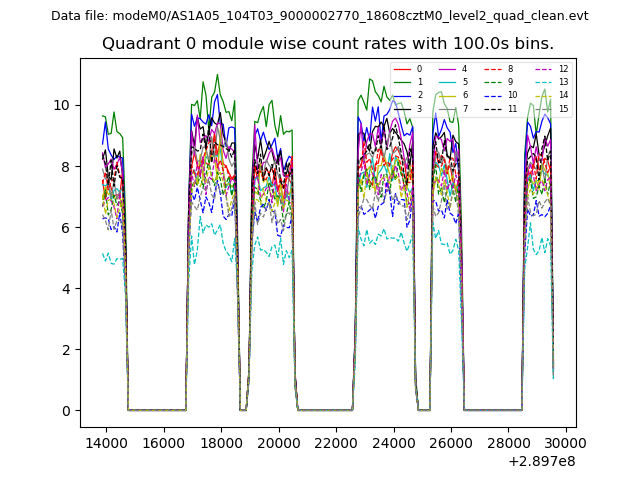 |
 |
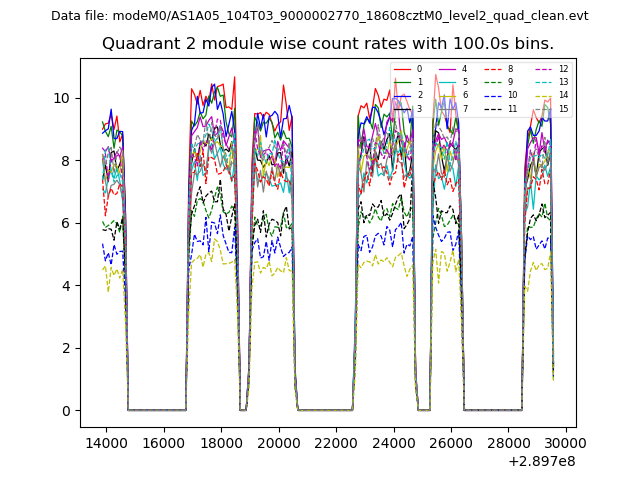
| Module-wise count rates for Quadrant B Data is divided into 100 sec bins |
 |
 |
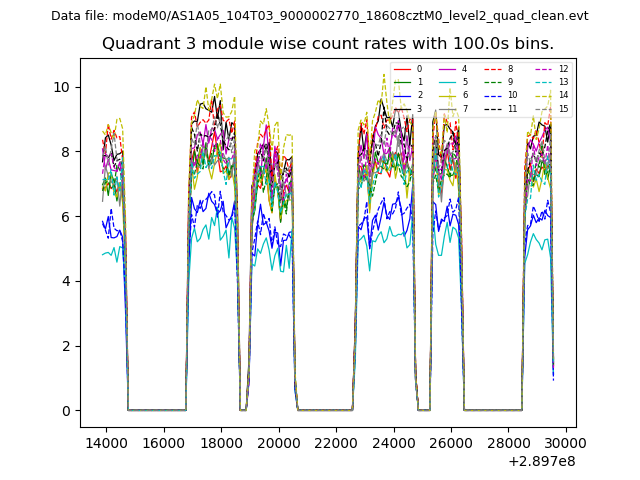
| Module-wise count rates for Quadrant C Data is divided into 100 sec bins |
 |
 |
| Module-wise count rates for Quadrant D Data is divided into 100 sec bins |
 |
 |
| Parameter | Plot |
|---|---|
| CZT HV Monitor | 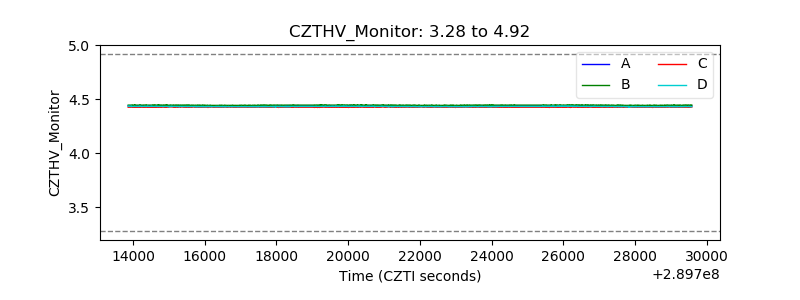 |
| D_VDD | 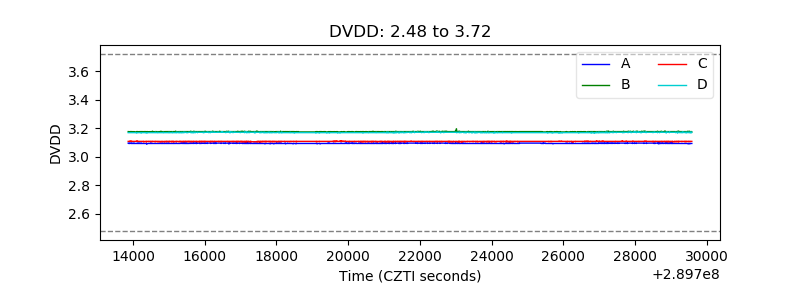 |
| Temperature 1 | 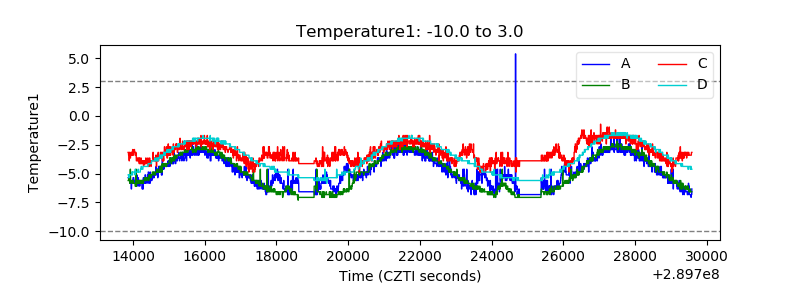 |
| Veto HV Monitor | 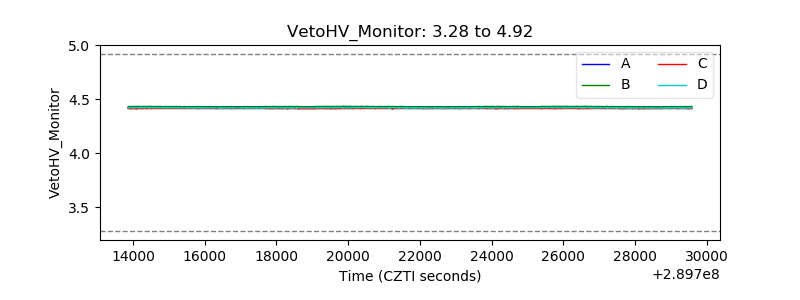 |
| Veto LLD | 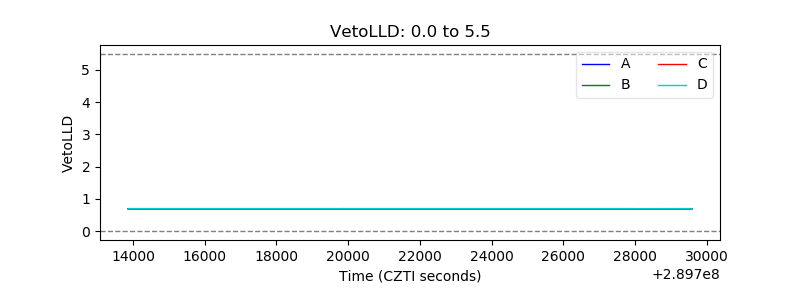 |
| Alpha Counter | 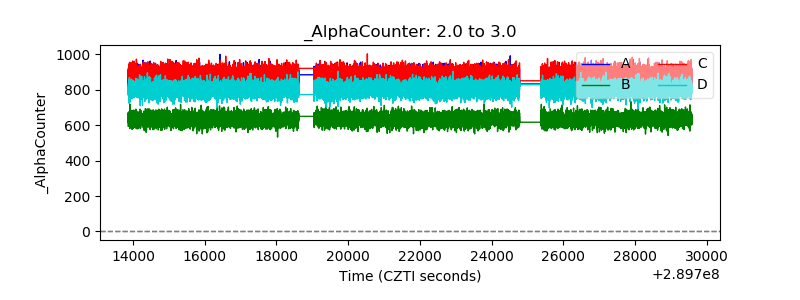 |
| _CPM_Rate | 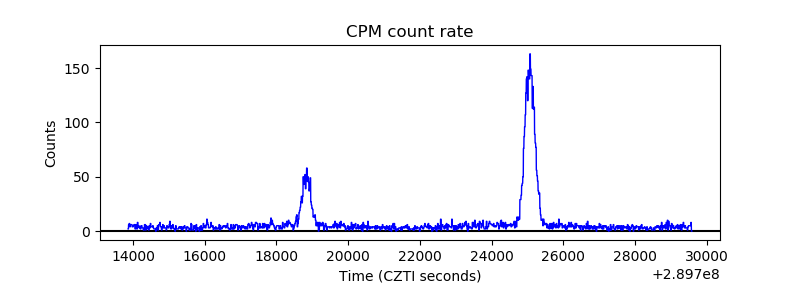 |
| CZT Counter | 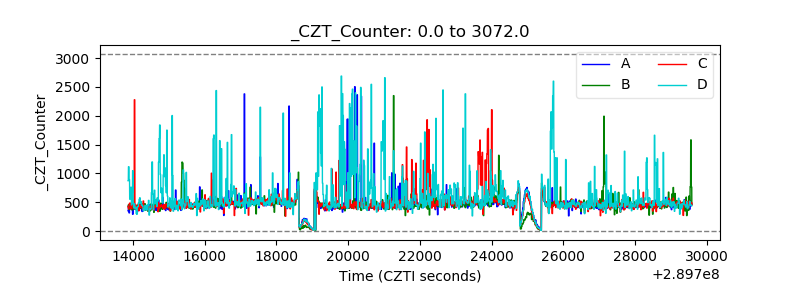 |
| +2.5 Volts monitor |  |
| +5 Volts monitor |  |
| _ROLL_ROT | 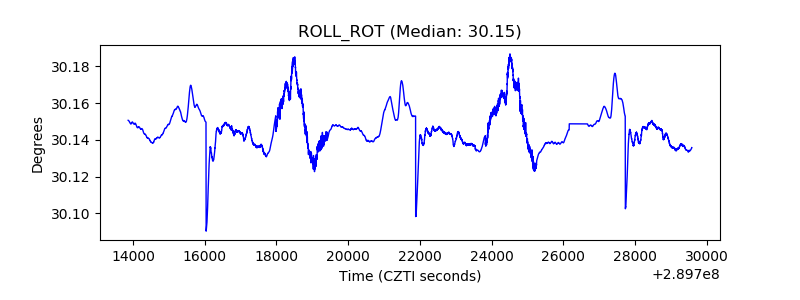 |
| _Roll_DEC | 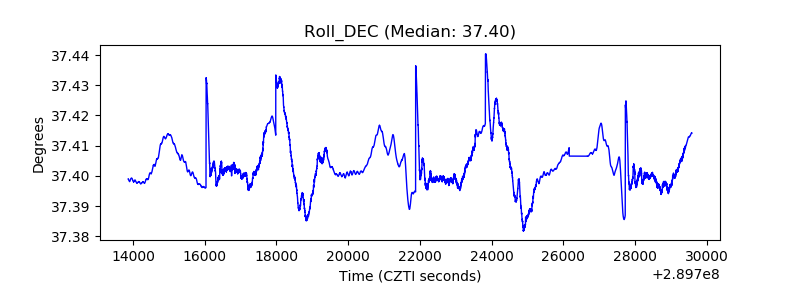 |
| _Roll_RA | 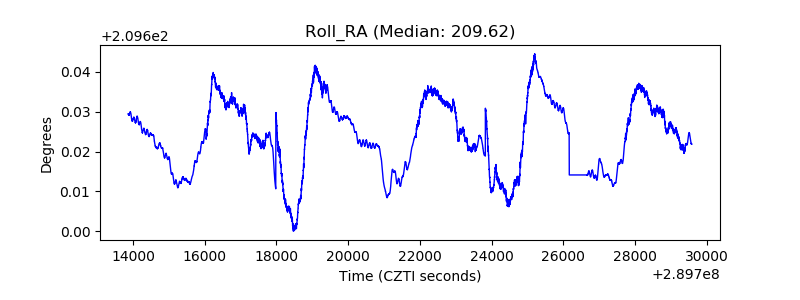 |
| Veto Counter | 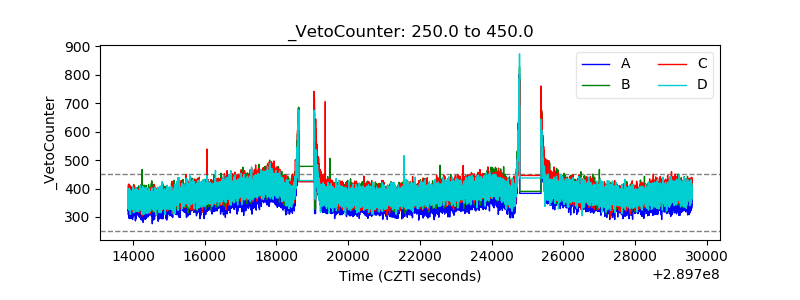 |