| Param | Original file | Final file |
|---|---|---|
| Filename | modeM0/AS1A05_082T10_9000002774cztM0_level2.fits | modeM0/AS1A05_082T10_9000002774cztM0_level2_quad_clean.evt |
| Size (bytes) | 154,428,480 | 89,688,960 |
| Size | 147.3 MB | 85.5 MB |
| Events in quadrant A | 951,458 | 443,561 |
| Events in quadrant B | 942,080 | 460,417 |
| Events in quadrant C | 977,800 | 447,195 |
| Events in quadrant D | 851,194 | 408,379 |
| Mode M9 | |||
|---|---|---|---|
| Quadrant | BADHDUFLAG | Total packets | Discarded packets |
| A | 0 | 41 | 0 |
| B | 0 | 41 | 0 |
| C | 0 | 41 | 0 |
| D | 0 | 41 | 0 |
| Mode SS | |||
|---|---|---|---|
| Quadrant | BADHDUFLAG | Total packets | Discarded packets |
| A | 0 | 280 | 0 |
| B | 0 | 280 | 0 |
| C | 0 | 280 | 0 |
| D | 0 | 280 | 0 |
| Mode M0 | |||
|---|---|---|---|
| Quadrant | BADHDUFLAG | Total packets | Discarded packets |
| A | 0 | 32942 | 0 |
| B | 0 | 30654 | 0 |
| C | 0 | 31437 | 0 |
| D | 0 | 33373 | 0 |
| Quadrant | Total seconds | Saturated seconds | Saturation percentage |
|---|---|---|---|
| A | 13832 | 288 | 2.082128% |
| B | 13832 | 233 | 1.684500% |
| C | 13832 | 368 | 2.660497% |
| D | 13832 | 243 | 1.756796% |
Noise dominated data is calculated using 1-second bins in cleaned event files. If a bin has >2000 counts, and if more than 50% of those come from <1% of pixels, then it is considered to be noise-dominated and hence unusable.
| Quadrant | # 1 sec bins | Bins with >0 counts | Bins with >2000 counts | High rate bins dominated by noise | Noise dominated (total time) | Noise dominated (detector-on time) | Marked lightcurve |
|---|---|---|---|---|---|---|---|
| A | 17857 | 13832 | 0 | 0 | 0.00% | 0.00% | 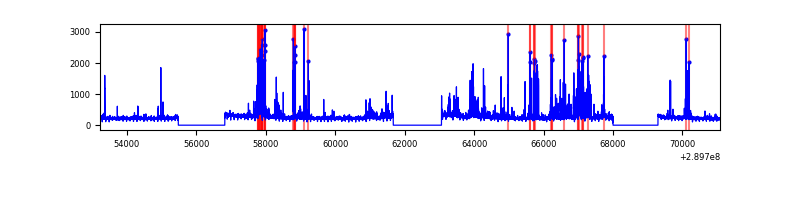 |
| B | 17857 | 13831 | 0 | 0 | 0.00% | 0.00% | 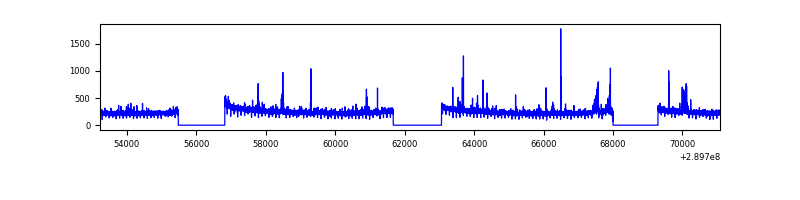 |
| C | 17857 | 13830 | 0 | 0 | 0.00% | 0.00% | 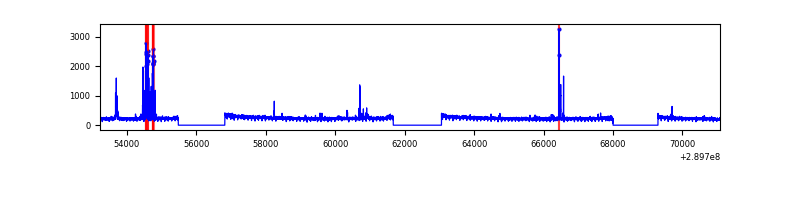 |
| D | 17857 | 13832 | 0 | 0 | 0.00% | 0.00% | 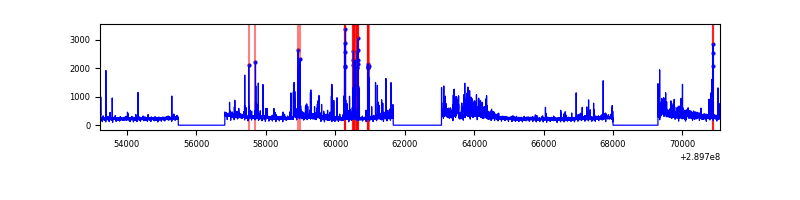 |
Top three noisy pixels from each quadrant. If the there are fewer than three noisy pixels in the level2.evt file, extra rows are filled as -1
| Pixel properties | Quadrant properties | ||||||
|---|---|---|---|---|---|---|---|
| Quadrant | DetID | PixID | Counts | Sigma | Mean | Median | Sigma |
| A | 7 | 110 | 802 | 9.1 | 248 | 234 | 62.4 |
| A | 0 | 29 | 770 | 8.59 | 248 | 234 | 62.4 |
| A | 9 | 19 | 712 | 7.66 | 248 | 234 | 62.4 |
| B | 2 | 9 | 714 | 9.29 | 249 | 240 | 51.0 |
| B | 2 | 8 | 641 | 7.86 | 249 | 240 | 51.0 |
| B | 5 | 128 | 640 | 7.84 | 249 | 240 | 51.0 |
| C | 1 | 81 | 739 | 7.34 | 257 | 244 | 67.4 |
| C | 1 | 80 | 698 | 6.73 | 257 | 244 | 67.4 |
| C | 3 | 126 | 672 | 6.35 | 257 | 244 | 67.4 |
| D | 10 | 190 | 659 | 6.76 | 242 | 224 | 64.4 |
| D | 10 | 189 | 648 | 6.58 | 242 | 224 | 64.4 |
| D | 1 | 19 | 605 | 5.92 | 242 | 224 | 64.4 |
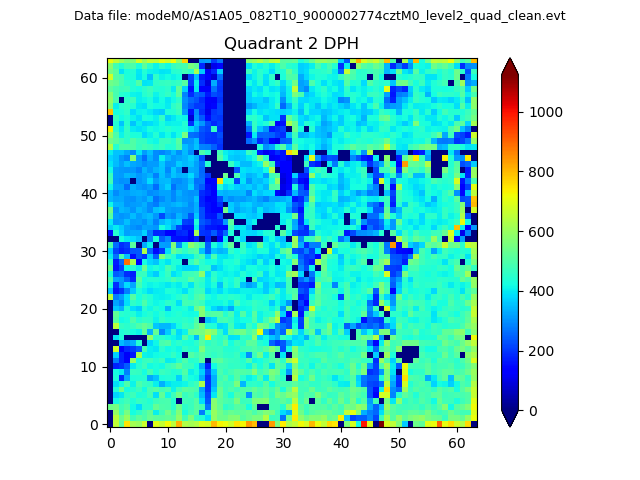
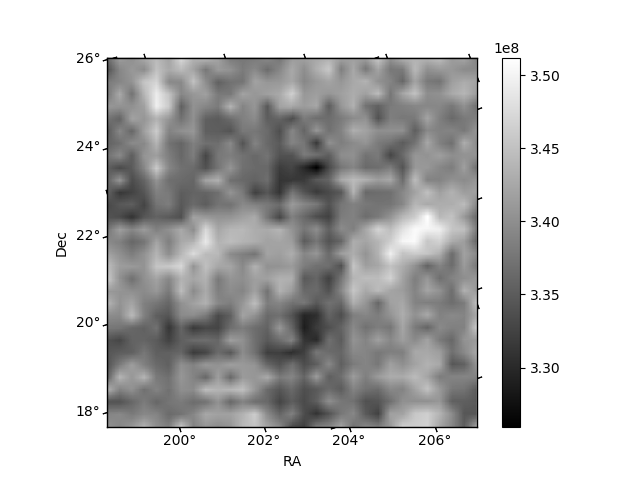
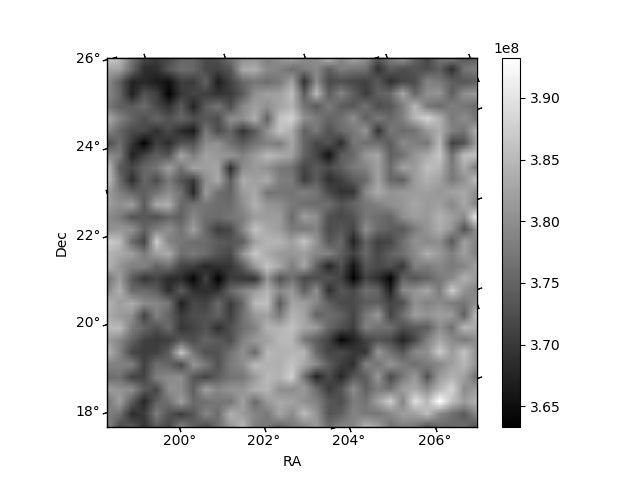
Histogram calculated using DETX and DETY for each event in the final _common_clean file
| Quadrant A | 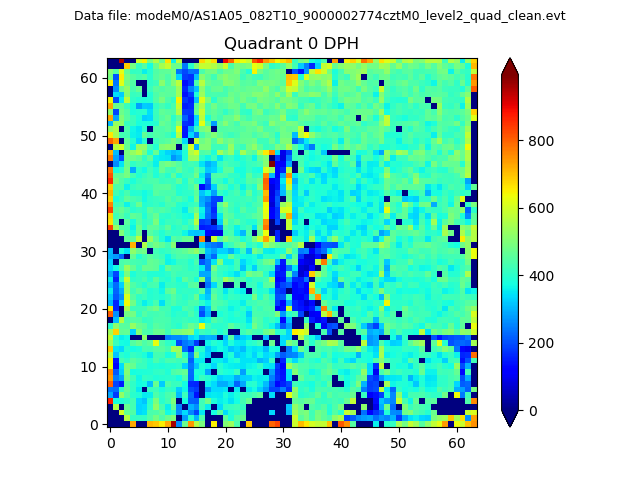 |
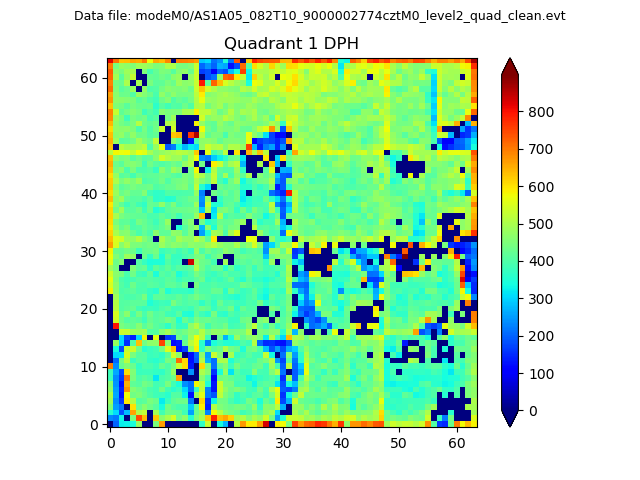 |
Quadrant B |
|---|---|---|---|
| Quadrant D | 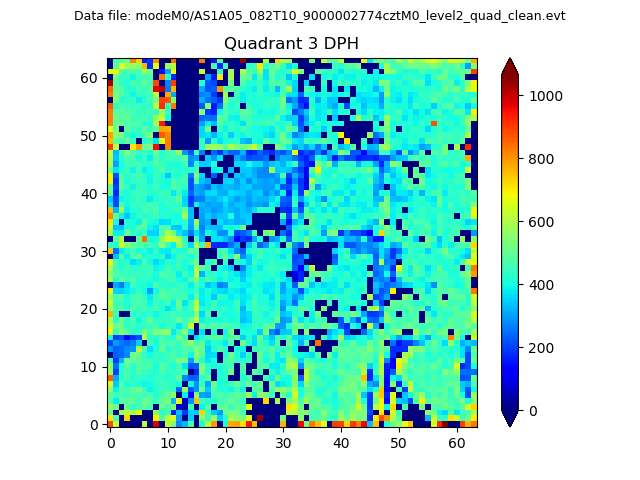 |
 |
Quadrant C |
| Plot type | Count rate plots | Images |
|---|---|---|
| Comparison with Poisson distribution Blue bars denote a histogram of data divided into 1 sec bins. Red curve is a Poisson curve with rate = median count rate of data. |
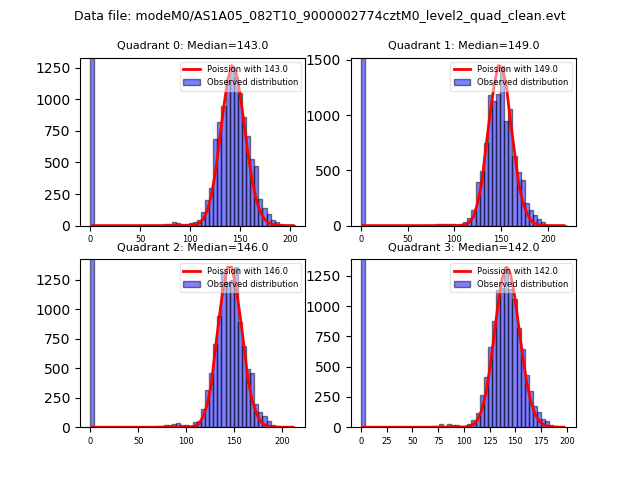 |
 |
| Quadrant-wise count rates Data is divided into 100 sec bins |
 |
|
| Module-wise count rates for Quadrant A Data is divided into 100 sec bins |
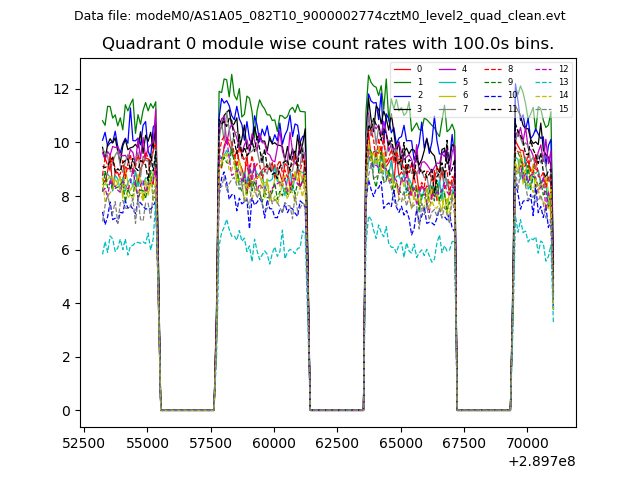 |
 |
| Module-wise count rates for Quadrant B Data is divided into 100 sec bins |
 |
 |
| Module-wise count rates for Quadrant C Data is divided into 100 sec bins |
 |
 |
| Module-wise count rates for Quadrant D Data is divided into 100 sec bins |
 |
 |
| Parameter | Plot |
|---|---|
| CZT HV Monitor |  |
| D_VDD | 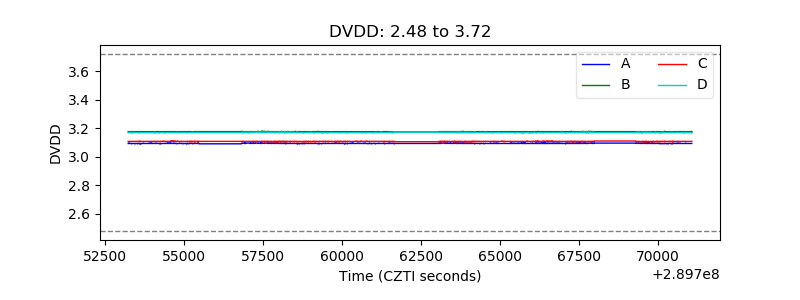 |
| Temperature 1 | 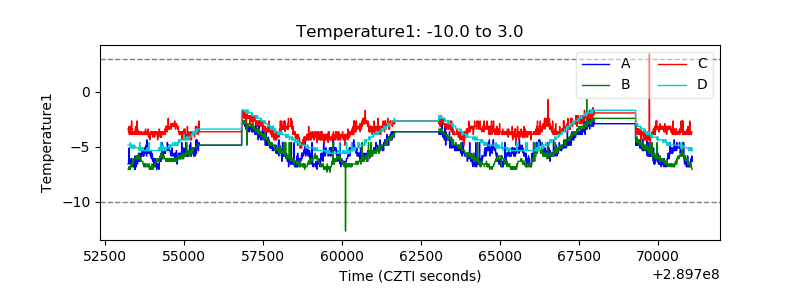 |
| Veto HV Monitor | 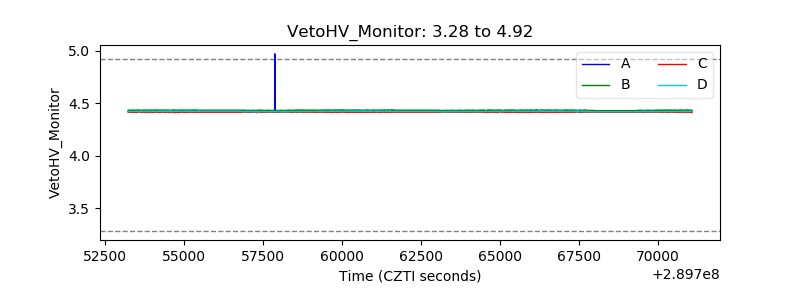 |
| Veto LLD | 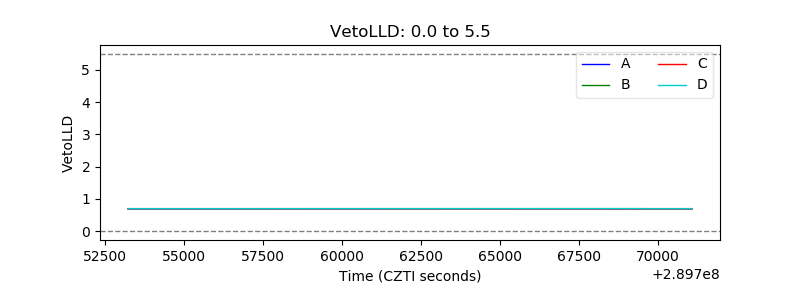 |
| Alpha Counter |  |
| _CPM_Rate | 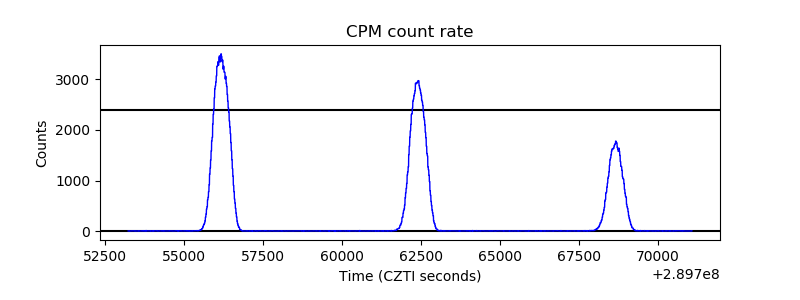 |
| CZT Counter |  |
| +2.5 Volts monitor |  |
| +5 Volts monitor |  |
| _ROLL_ROT | 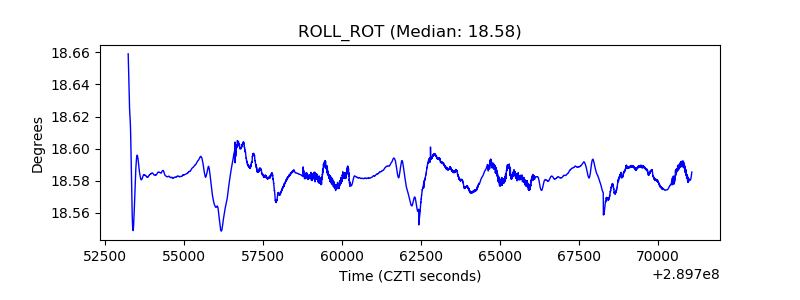 |
| _Roll_DEC | 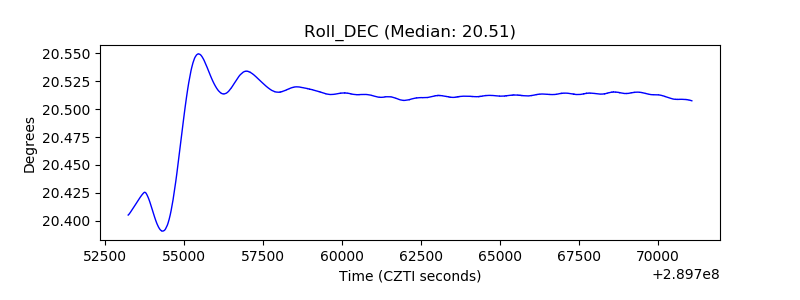 |
| _Roll_RA | 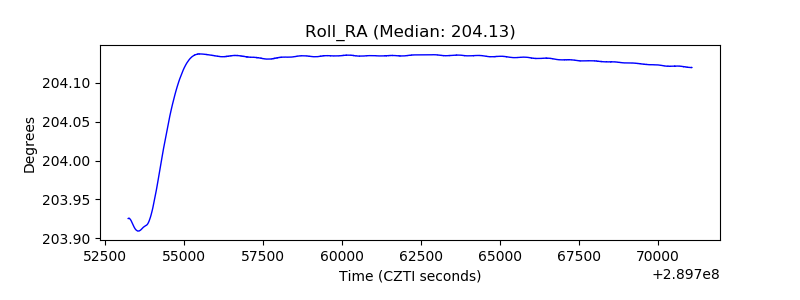 |
| Veto Counter | 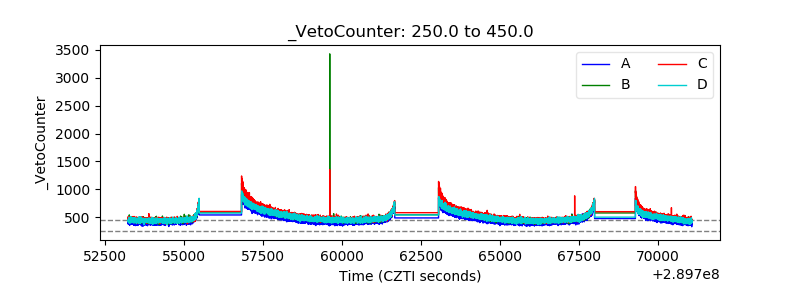 |