| Param | Original file | Final file |
|---|---|---|
| Filename | modeM0/AS1A05_082T10_9000002774_18613cztM0_level2.evt | modeM0/AS1A05_082T10_9000002774_18613cztM0_level2_quad_clean.evt |
| Size (bytes) | 269,406,720 | 54,391,680 |
| Size | 256.9 MB | 51.9 MB |
| Events in quadrant A | 2,036,663 | 348,025 |
| Events in quadrant B | 1,879,923 | 360,737 |
| Events in quadrant C | 2,131,830 | 348,717 |
| Events in quadrant D | 1,876,499 | 346,545 |
| Mode M9 | |||
|---|---|---|---|
| Quadrant | BADHDUFLAG | Total packets | Discarded packets |
| A | 0 | 14 | 0 |
| B | 0 | 14 | 0 |
| C | 0 | 14 | 0 |
| D | 0 | 14 | 0 |
| Mode SS | |||
|---|---|---|---|
| Quadrant | BADHDUFLAG | Total packets | Discarded packets |
| A | 0 | 70 | 0 |
| B | 0 | 70 | 0 |
| C | 0 | 70 | 0 |
| D | 0 | 70 | 0 |
| Mode M0 | |||
|---|---|---|---|
| Quadrant | BADHDUFLAG | Total packets | Discarded packets |
| A | 0 | 8408 | 1 |
| B | 0 | 7858 | 1 |
| C | 0 | 8639 | 1 |
| D | 0 | 7909 | 1 |
| Quadrant | Total seconds | Saturated seconds | Saturation percentage |
|---|---|---|---|
| A | 3428 | 104 | 3.033839% |
| B | 3428 | 62 | 1.808635% |
| C | 3428 | 133 | 3.879813% |
| D | 3428 | 52 | 1.516919% |
Noise dominated data is calculated using 1-second bins in cleaned event files. If a bin has >2000 counts, and if more than 50% of those come from <1% of pixels, then it is considered to be noise-dominated and hence unusable.
| Quadrant | # 1 sec bins | Bins with >0 counts | Bins with >2000 counts | High rate bins dominated by noise | Noise dominated (total time) | Noise dominated (detector-on time) | Marked lightcurve |
|---|---|---|---|---|---|---|---|
| A | 4768 | 3429 | 32 | 32 | 0.67% | 0.93% | 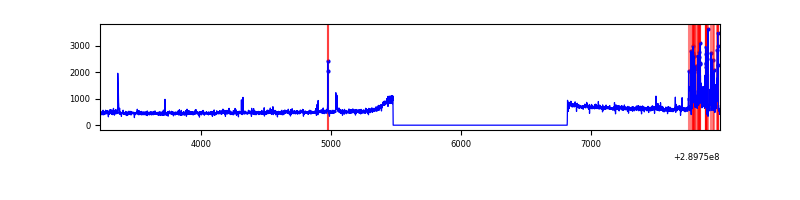 |
| B | 4768 | 3429 | 0 | 0 | 0.00% | 0.00% | 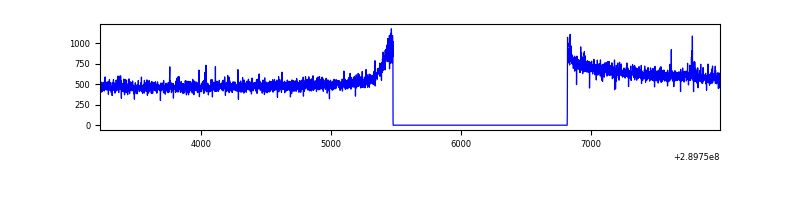 |
| C | 4768 | 3428 | 47 | 47 | 0.99% | 1.37% | 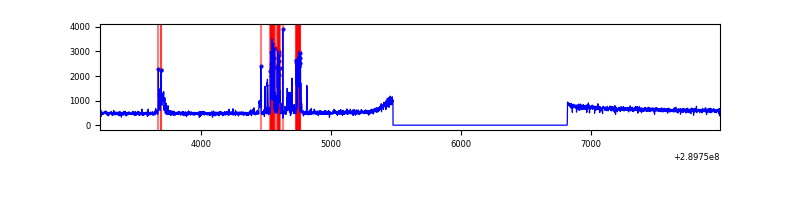 |
| D | 4768 | 3429 | 9 | 9 | 0.19% | 0.26% | 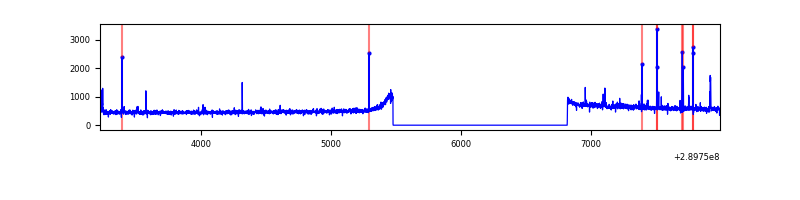 |
Top three noisy pixels from each quadrant. If the there are fewer than three noisy pixels in the level2.evt file, extra rows are filled as -1
| Pixel properties | Quadrant properties | ||||||
|---|---|---|---|---|---|---|---|
| Quadrant | DetID | PixID | Counts | Sigma | Mean | Median | Sigma |
| A | 0 | 13 | 184773 | 1920.18 | 475 | 468 | 96.0 |
| A | 9 | 143 | 10462 | 104.12 | 475 | 468 | 96.0 |
| A | 12 | 236 | 6566 | 63.53 | 475 | 468 | 96.0 |
| B | 12 | 111 | 10461 | 108.91 | 479 | 469 | 91.7 |
| B | 11 | 111 | 9044 | 93.46 | 479 | 469 | 91.7 |
| B | 14 | 111 | 8058 | 82.72 | 479 | 469 | 91.7 |
| C | 9 | 54 | 237313 | 2166.83 | 466 | 471 | 109.3 |
| C | 14 | 238 | 73928 | 672.05 | 466 | 471 | 109.3 |
| C | 3 | 233 | 5298 | 44.16 | 466 | 471 | 109.3 |
| D | 1 | 52 | 26486 | 224.42 | 473 | 460 | 116.0 |
| D | 7 | 96 | 21467 | 181.14 | 473 | 460 | 116.0 |
| D | 5 | 222 | 18575 | 156.2 | 473 | 460 | 116.0 |
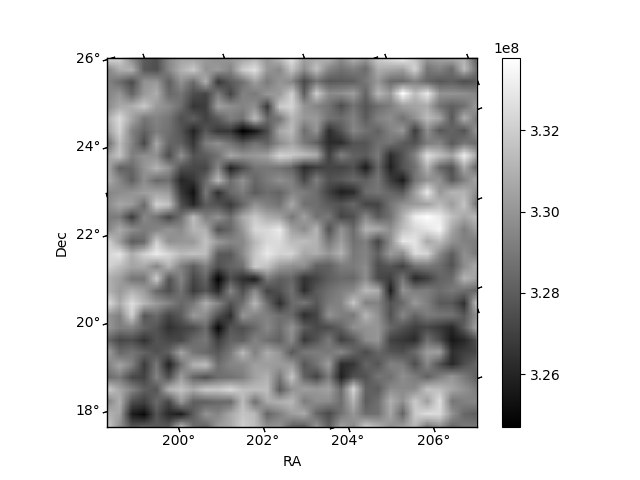
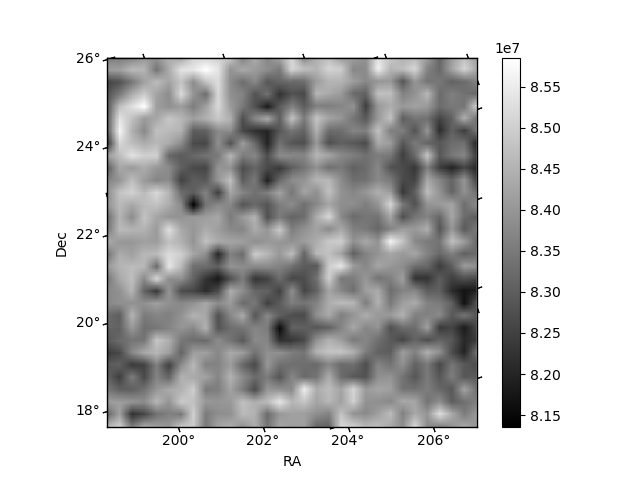
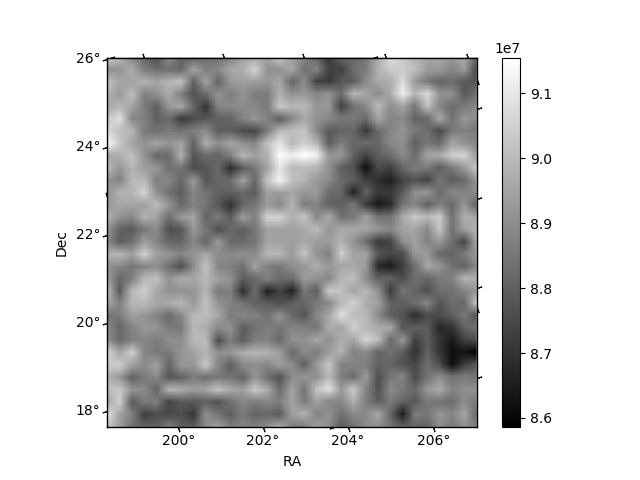
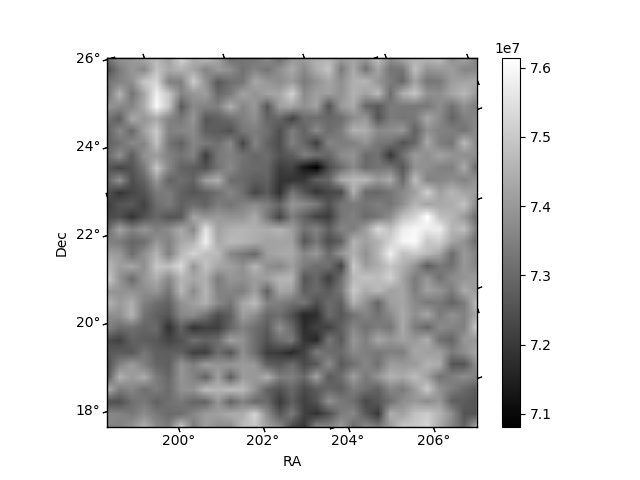
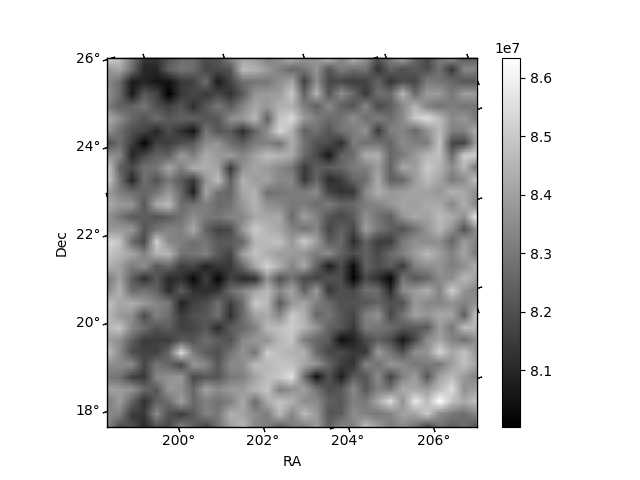
Histogram calculated using DETX and DETY for each event in the final _common_clean file
| Quadrant A | 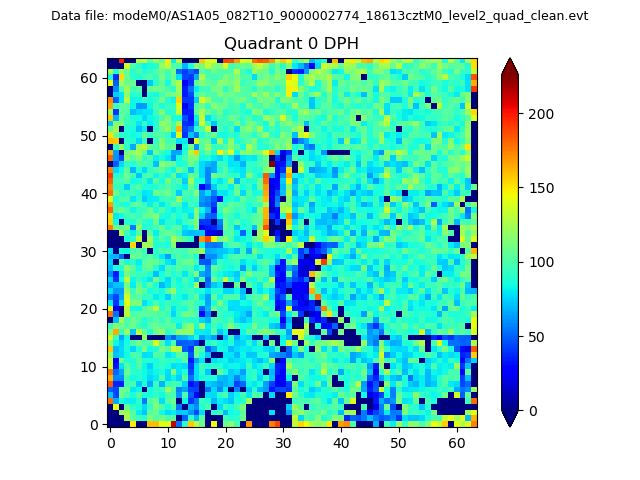 |
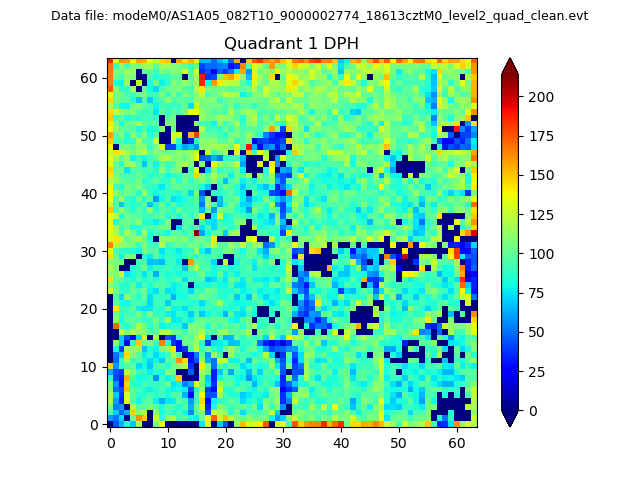 |
Quadrant B |
|---|---|---|---|
| Quadrant D |  |
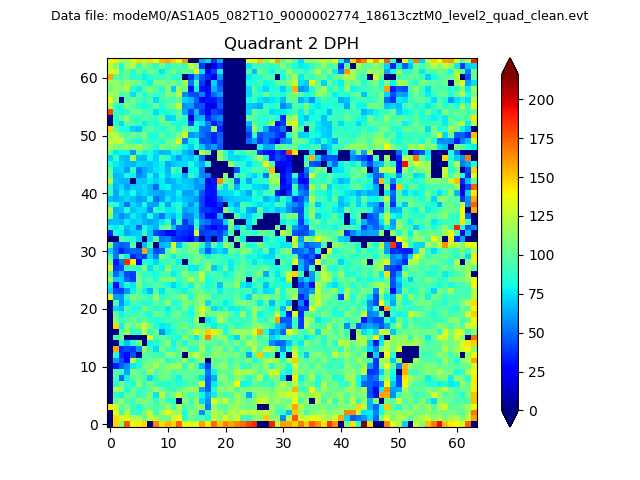 |
Quadrant C |
| Plot type | Count rate plots | Images |
|---|---|---|
| Comparison with Poisson distribution Blue bars denote a histogram of data divided into 1 sec bins. Red curve is a Poisson curve with rate = median count rate of data. |
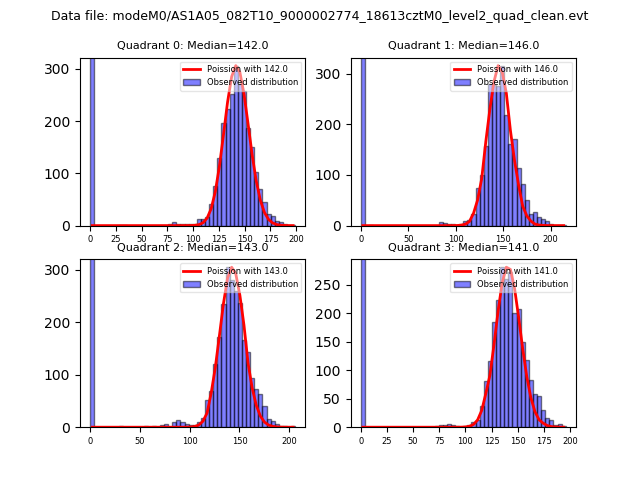 |
 |
| Quadrant-wise count rates Data is divided into 100 sec bins |
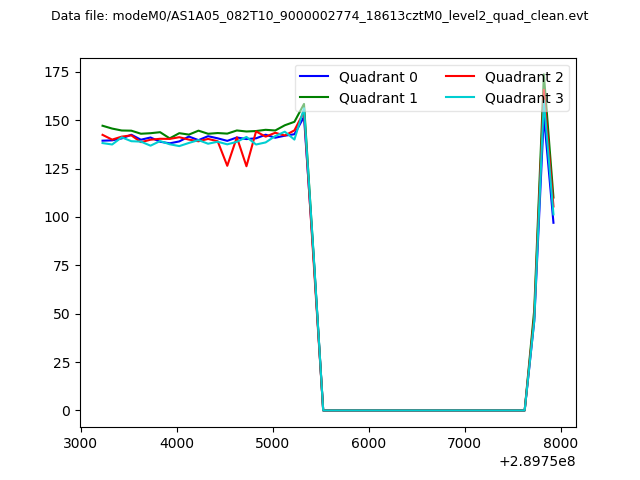 |
|
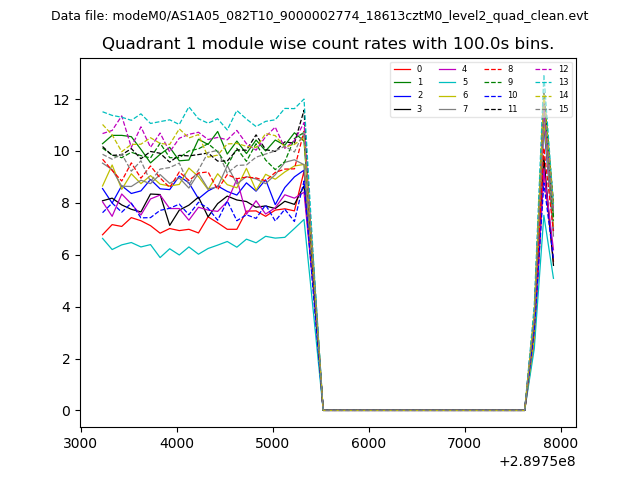
| Module-wise count rates for Quadrant A Data is divided into 100 sec bins |
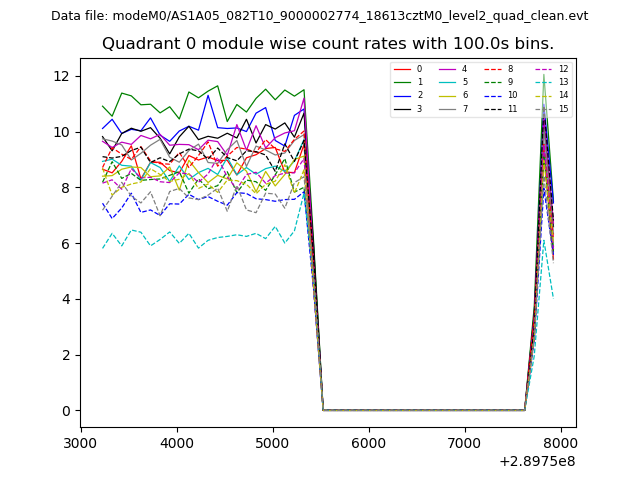 |
 |
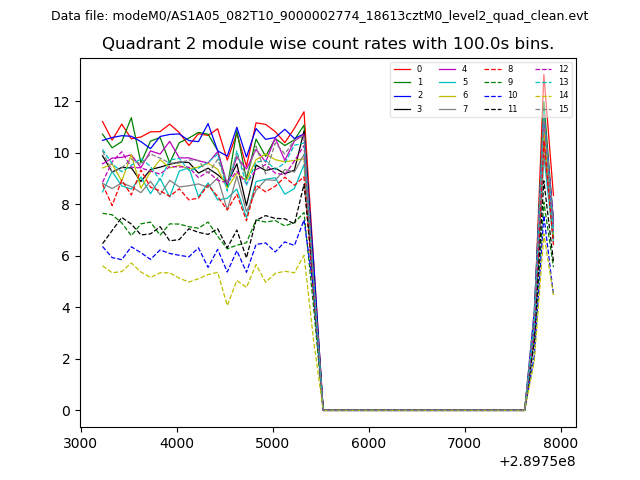
| Module-wise count rates for Quadrant B Data is divided into 100 sec bins |
 |
 |
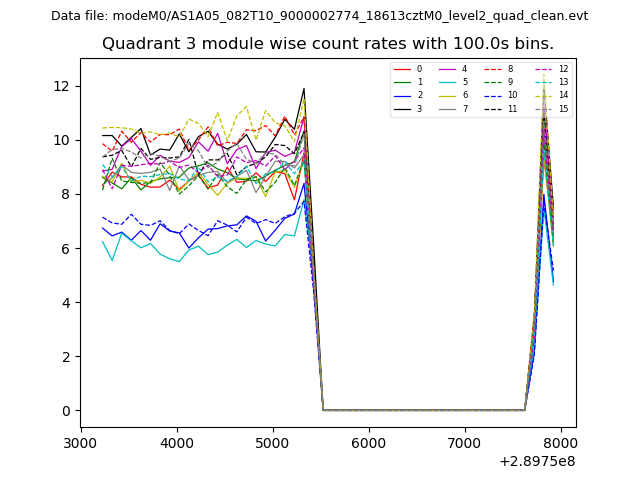
| Module-wise count rates for Quadrant C Data is divided into 100 sec bins |
 |
 |
| Module-wise count rates for Quadrant D Data is divided into 100 sec bins |
 |
 |
| Parameter | Plot |
|---|---|
| CZT HV Monitor | 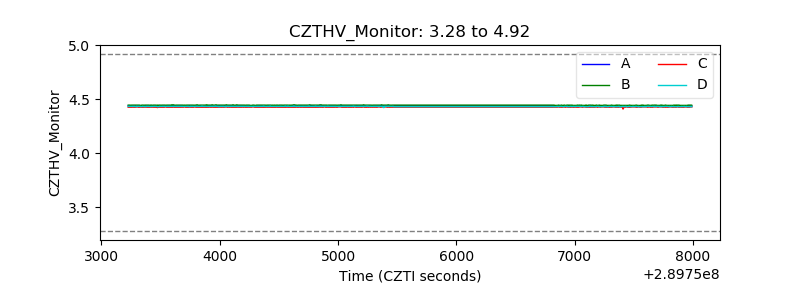 |
| D_VDD | 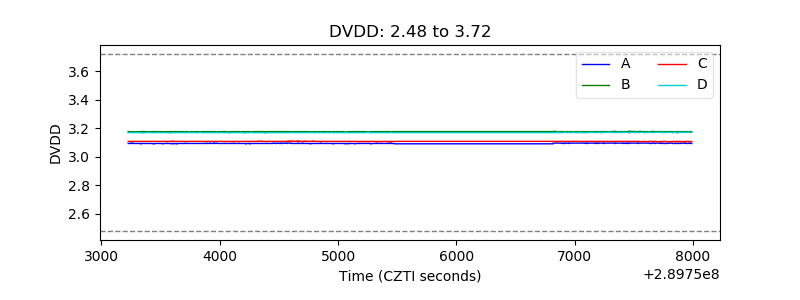 |
| Temperature 1 |  |
| Veto HV Monitor | 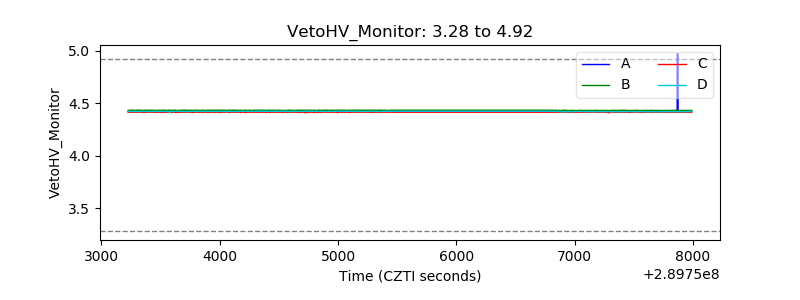 |
| Veto LLD | 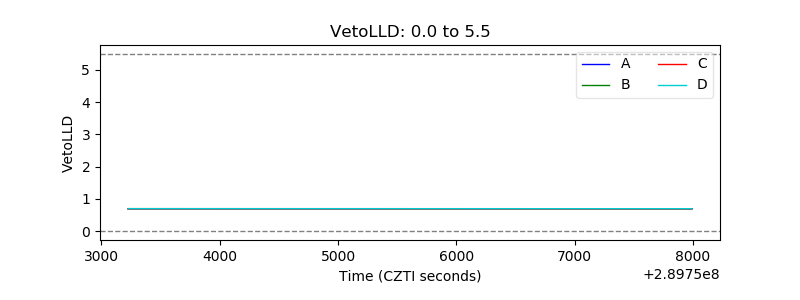 |
| Alpha Counter | 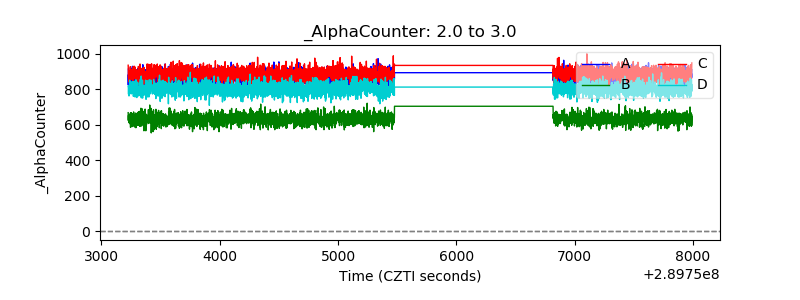 |
| _CPM_Rate | 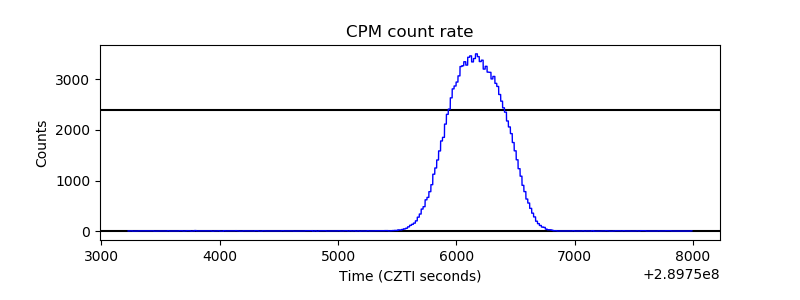 |
| CZT Counter | 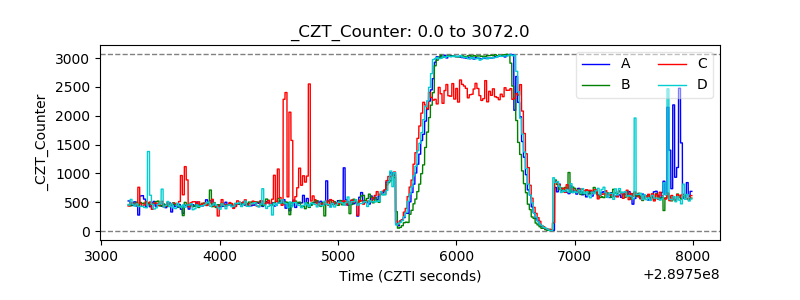 |
| +2.5 Volts monitor | 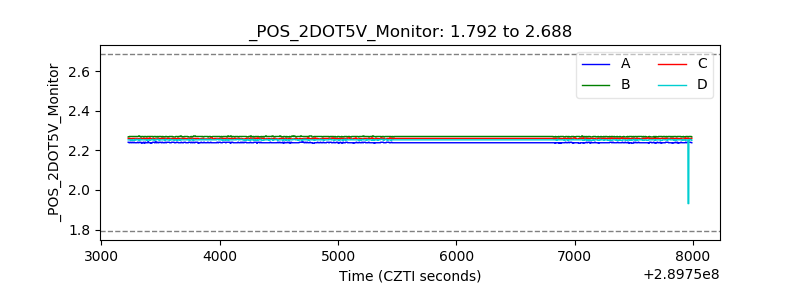 |
| +5 Volts monitor |  |
| _ROLL_ROT | 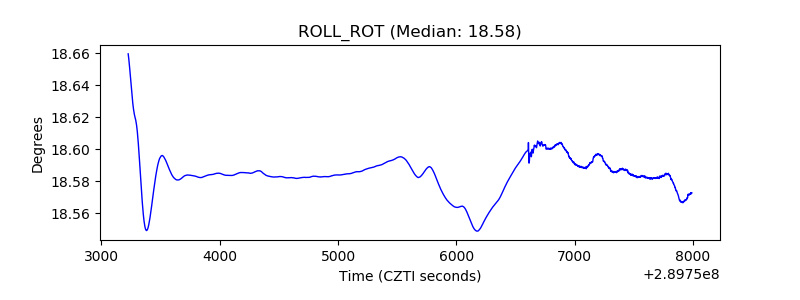 |
| _Roll_DEC | 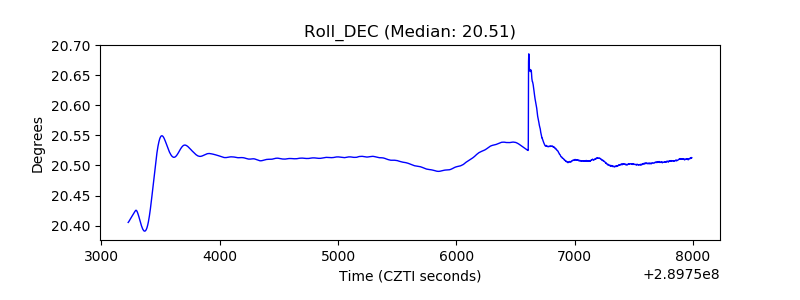 |
| _Roll_RA | 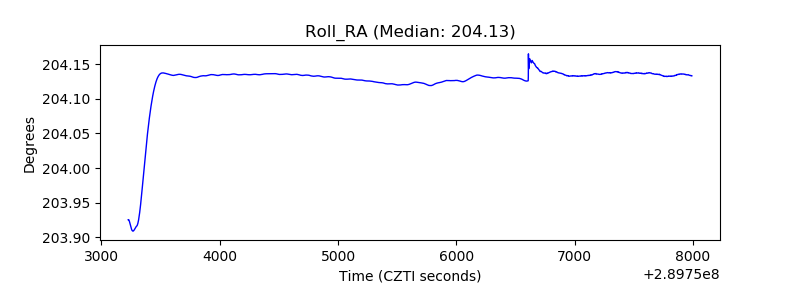 |
| Veto Counter | 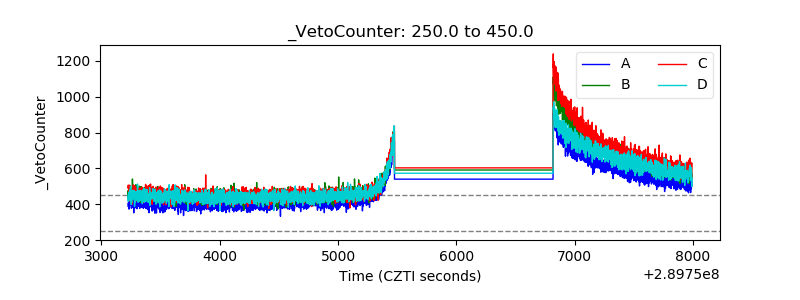 |