| Param | Original file | Final file |
|---|---|---|
| Filename | modeM0/AS1A05_082T10_9000002774_18614cztM0_level2.evt | modeM0/AS1A05_082T10_9000002774_18614cztM0_level2_quad_clean.evt |
| Size (bytes) | 489,415,680 | 97,637,760 |
| Size | 466.7 MB | 93.1 MB |
| Events in quadrant A | 3,666,095 | 625,553 |
| Events in quadrant B | 3,359,210 | 653,572 |
| Events in quadrant C | 3,420,540 | 640,430 |
| Events in quadrant D | 3,965,455 | 614,395 |
| Mode M9 | |||
|---|---|---|---|
| Quadrant | BADHDUFLAG | Total packets | Discarded packets |
| A | 0 | 14 | 0 |
| B | 0 | 14 | 0 |
| C | 0 | 14 | 0 |
| D | 0 | 14 | 0 |
| Mode SS | |||
|---|---|---|---|
| Quadrant | BADHDUFLAG | Total packets | Discarded packets |
| A | 0 | 124 | 0 |
| B | 0 | 124 | 0 |
| C | 0 | 124 | 0 |
| D | 0 | 124 | 0 |
| Mode M0 | |||
|---|---|---|---|
| Quadrant | BADHDUFLAG | Total packets | Discarded packets |
| A | 0 | 15036 | 2 |
| B | 0 | 13899 | 2 |
| C | 0 | 14103 | 2 |
| D | 0 | 15883 | 2 |
| Quadrant | Total seconds | Saturated seconds | Saturation percentage |
|---|---|---|---|
| A | 6056 | 116 | 1.915456% |
| B | 6056 | 63 | 1.040291% |
| C | 6057 | 100 | 1.650982% |
| D | 6056 | 107 | 1.766843% |
Noise dominated data is calculated using 1-second bins in cleaned event files. If a bin has >2000 counts, and if more than 50% of those come from <1% of pixels, then it is considered to be noise-dominated and hence unusable.
| Quadrant | # 1 sec bins | Bins with >0 counts | Bins with >2000 counts | High rate bins dominated by noise | Noise dominated (total time) | Noise dominated (detector-on time) | Marked lightcurve |
|---|---|---|---|---|---|---|---|
| A | 7446 | 6057 | 44 | 44 | 0.59% | 0.73% | 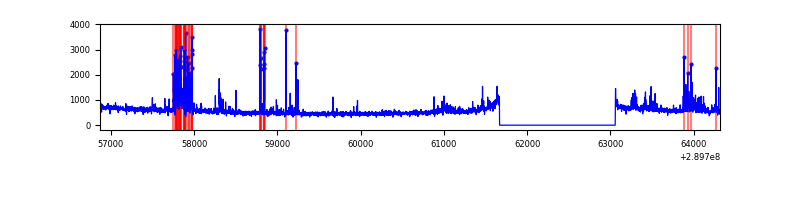 |
| B | 7446 | 6057 | 0 | 0 | 0.00% | 0.00% | 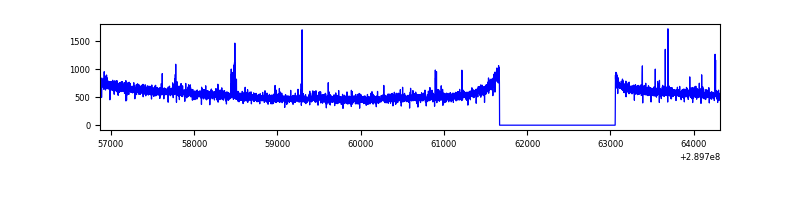 |
| C | 7447 | 6058 | 0 | 0 | 0.00% | 0.00% | 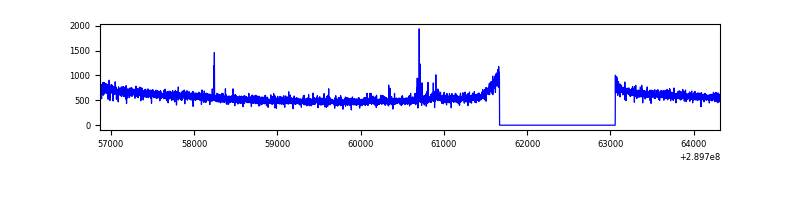 |
| D | 7446 | 6057 | 65 | 65 | 0.87% | 1.07% |  |
Top three noisy pixels from each quadrant. If the there are fewer than three noisy pixels in the level2.evt file, extra rows are filled as -1
| Pixel properties | Quadrant properties | ||||||
|---|---|---|---|---|---|---|---|
| Quadrant | DetID | PixID | Counts | Sigma | Mean | Median | Sigma |
| A | 0 | 13 | 439061 | 2605.65 | 837 | 825 | 168.2 |
| A | 13 | 254 | 10484 | 57.43 | 837 | 825 | 168.2 |
| A | 0 | 226 | 7301 | 38.5 | 837 | 825 | 168.2 |
| B | 12 | 111 | 18005 | 108.68 | 848 | 830 | 158.0 |
| B | 4 | 173 | 17299 | 104.21 | 848 | 830 | 158.0 |
| B | 11 | 111 | 15701 | 94.1 | 848 | 830 | 158.0 |
| C | 14 | 238 | 132838 | 690.06 | 833 | 843 | 191.3 |
| C | 3 | 233 | 24844 | 125.48 | 833 | 843 | 191.3 |
| C | 9 | 54 | 18022 | 89.81 | 833 | 843 | 191.3 |
| D | 5 | 222 | 368748 | 1838.38 | 835 | 813 | 200.1 |
| D | 1 | 52 | 332863 | 1659.08 | 835 | 813 | 200.1 |
| D | 7 | 96 | 54551 | 268.5 | 835 | 813 | 200.1 |
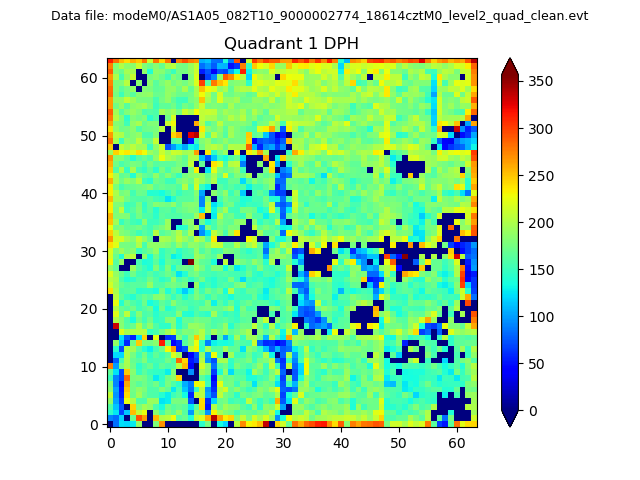
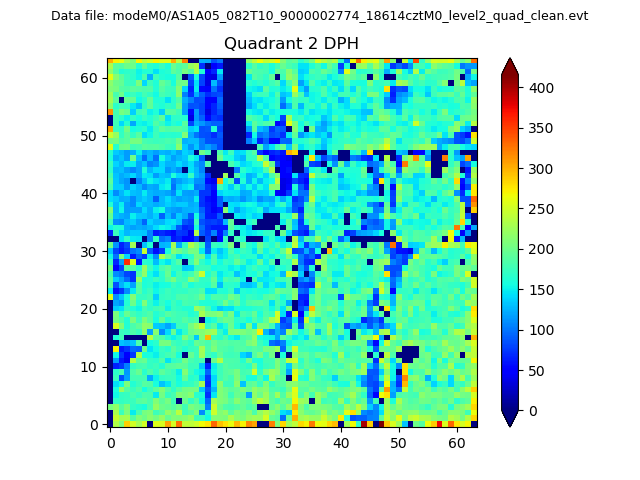
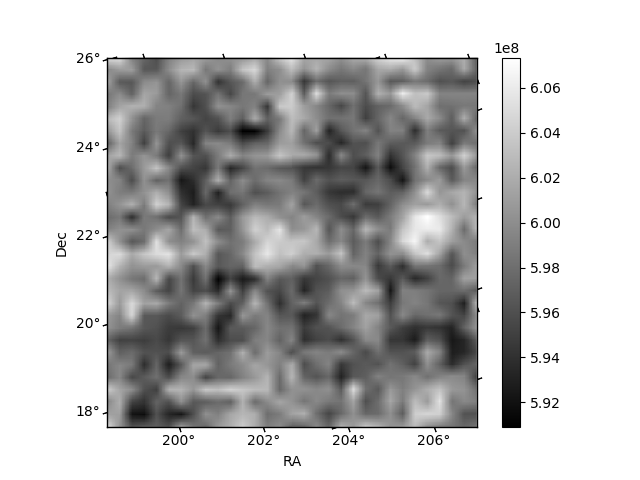
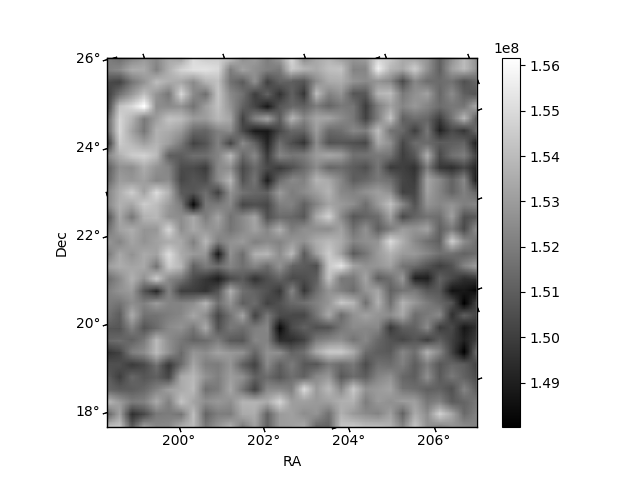
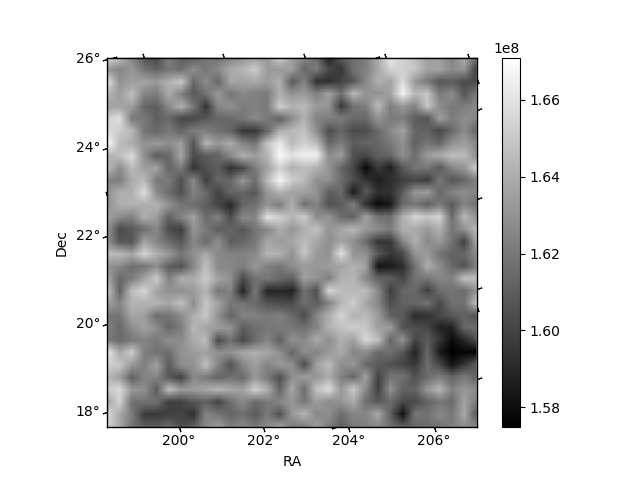
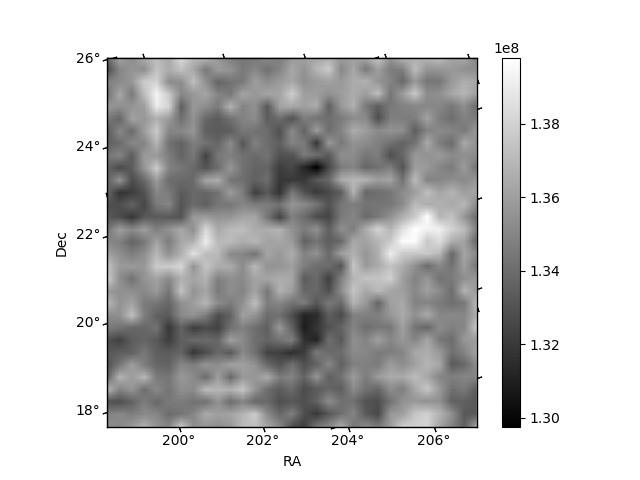
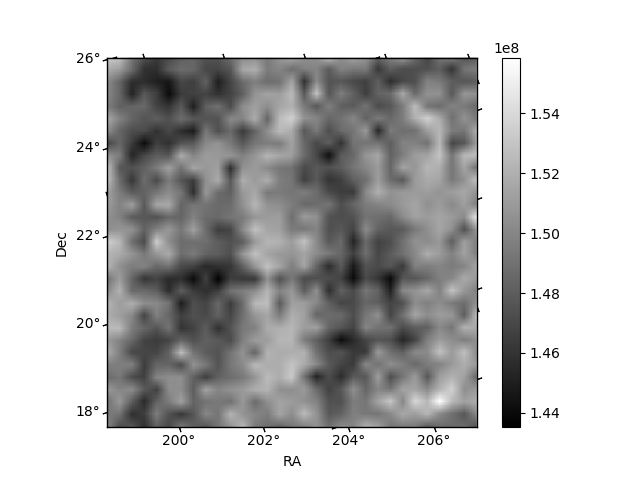
Histogram calculated using DETX and DETY for each event in the final _common_clean file
| Quadrant A | 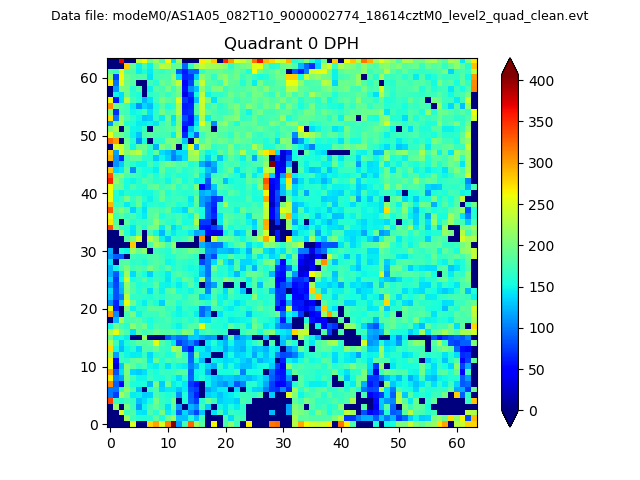 |
 |
Quadrant B |
|---|---|---|---|
| Quadrant D | 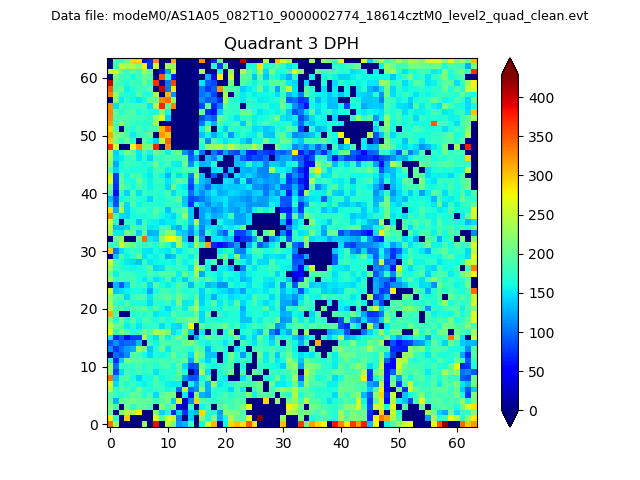 |
 |
Quadrant C |
| Plot type | Count rate plots | Images |
|---|---|---|
| Comparison with Poisson distribution Blue bars denote a histogram of data divided into 1 sec bins. Red curve is a Poisson curve with rate = median count rate of data. |
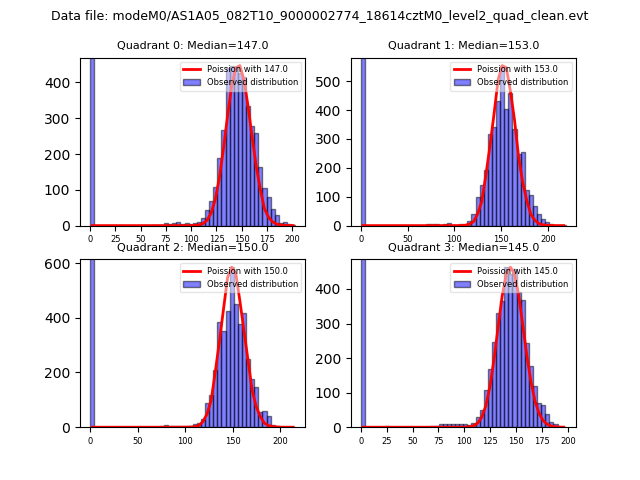 |
 |
| Quadrant-wise count rates Data is divided into 100 sec bins |
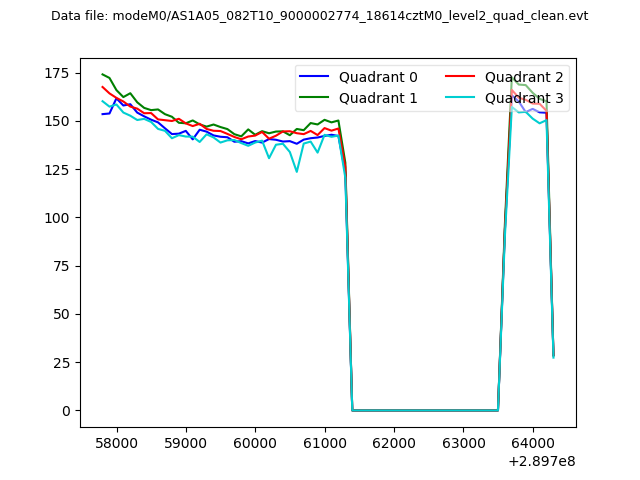 |
|
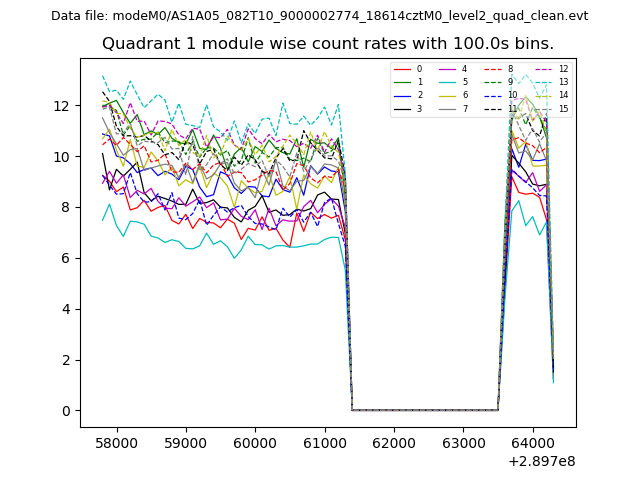
| Module-wise count rates for Quadrant A Data is divided into 100 sec bins |
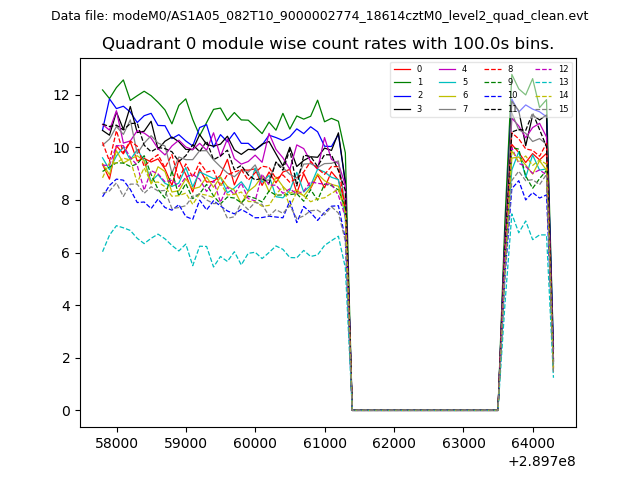 |
 |
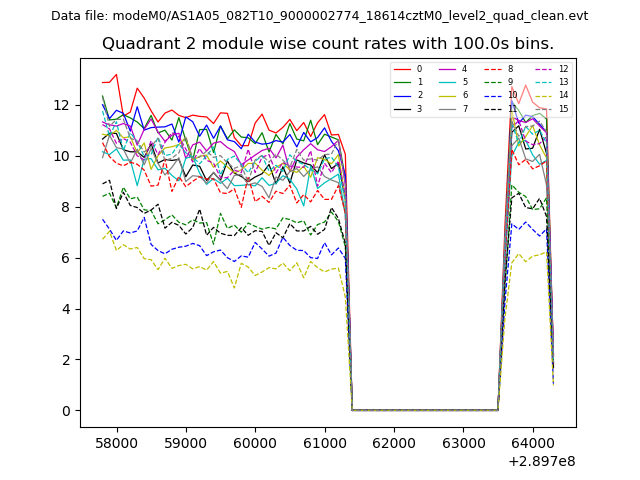
| Module-wise count rates for Quadrant B Data is divided into 100 sec bins |
 |
 |
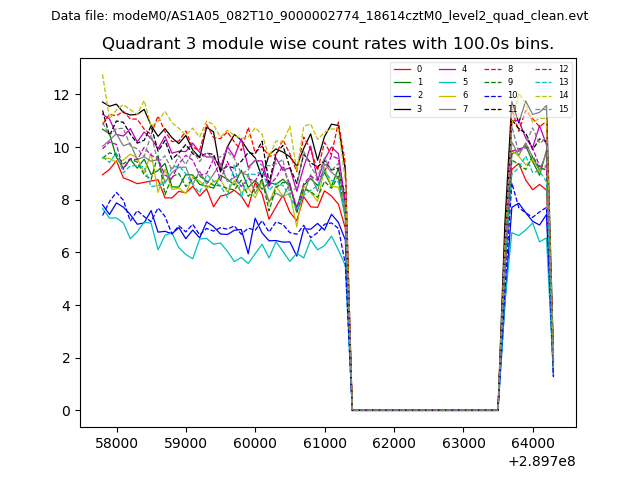
| Module-wise count rates for Quadrant C Data is divided into 100 sec bins |
 |
 |
| Module-wise count rates for Quadrant D Data is divided into 100 sec bins |
 |
 |
| Parameter | Plot |
|---|---|
| CZT HV Monitor | 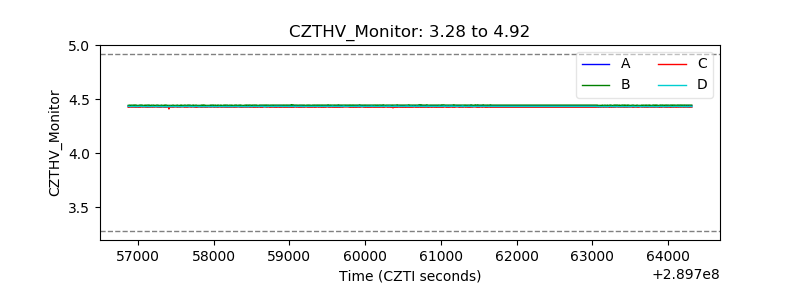 |
| D_VDD | 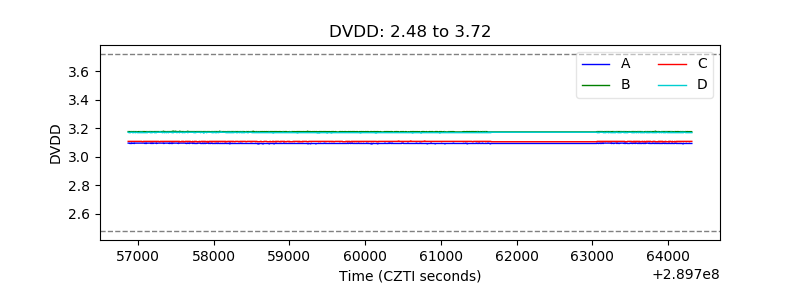 |
| Temperature 1 | 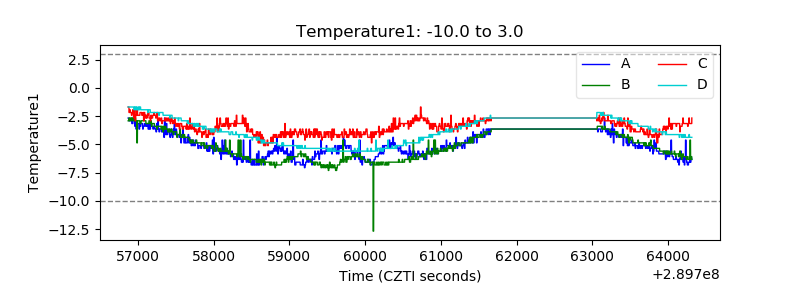 |
| Veto HV Monitor | 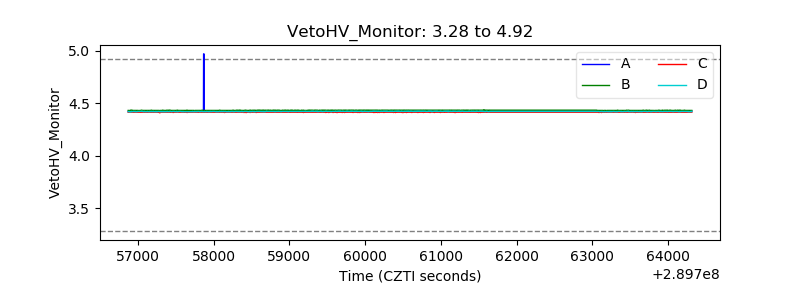 |
| Veto LLD | 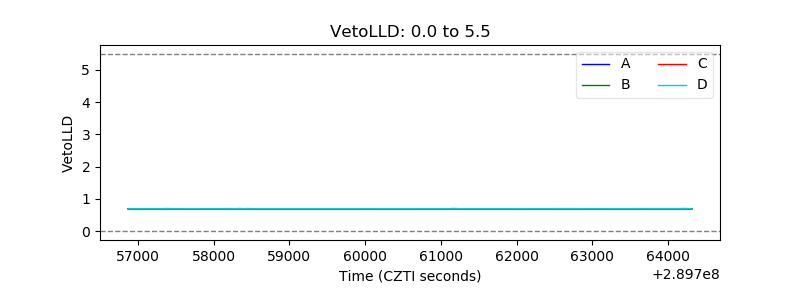 |
| Alpha Counter | 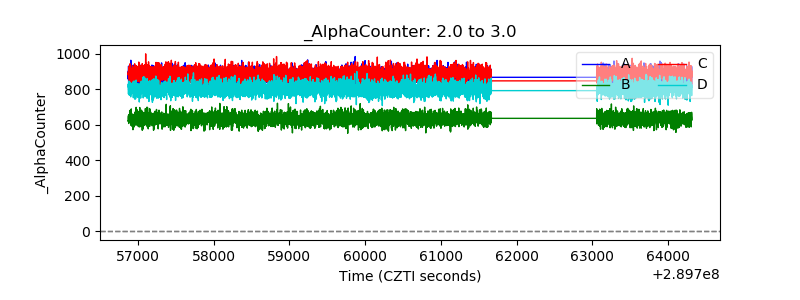 |
| _CPM_Rate | 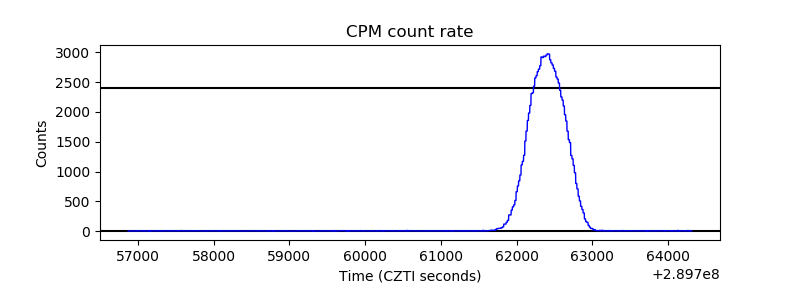 |
| CZT Counter | 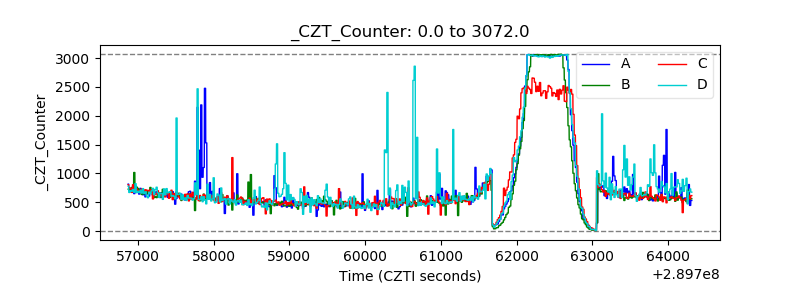 |
| +2.5 Volts monitor |  |
| +5 Volts monitor |  |
| _ROLL_ROT | 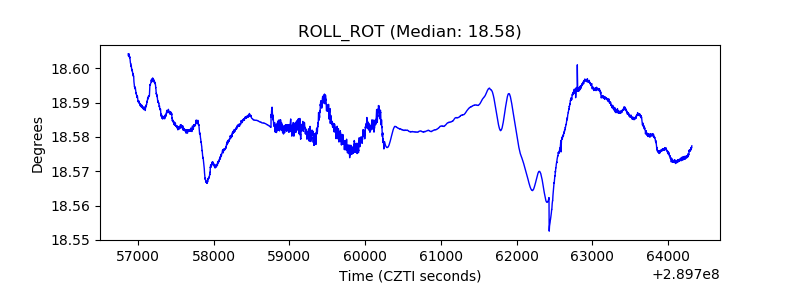 |
| _Roll_DEC | 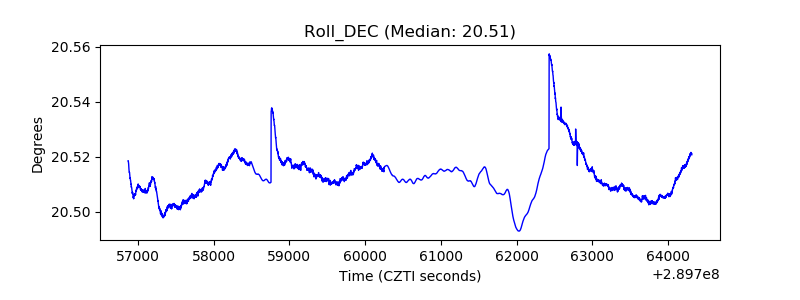 |
| _Roll_RA | 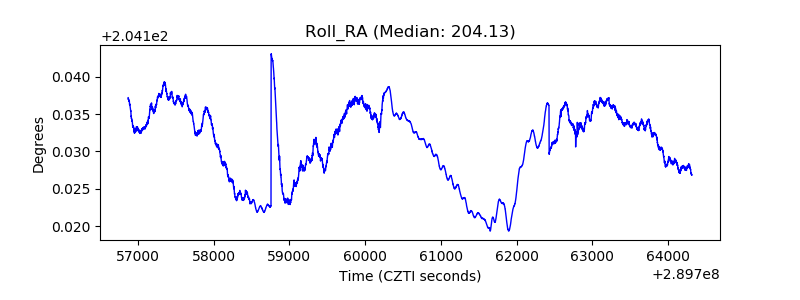 |
| Veto Counter | 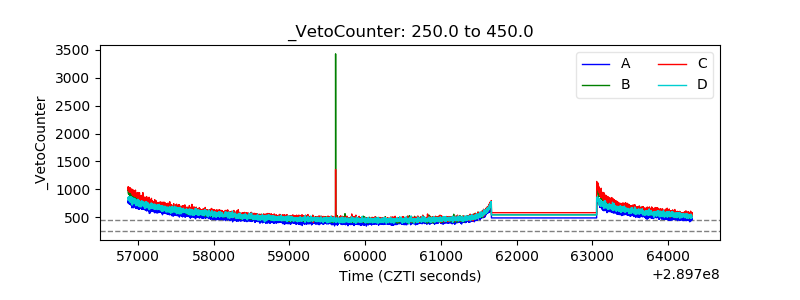 |