| Param | Original file | Final file |
|---|---|---|
| Filename | modeM0/AS1A05_082T10_9000002774_18615cztM0_level2.evt | modeM0/AS1A05_082T10_9000002774_18615cztM0_level2_quad_clean.evt |
| Size (bytes) | 482,783,040 | 103,020,480 |
| Size | 460.4 MB | 98.2 MB |
| Events in quadrant A | 3,797,015 | 662,812 |
| Events in quadrant B | 3,360,208 | 693,105 |
| Events in quadrant C | 3,372,721 | 677,381 |
| Events in quadrant D | 3,672,870 | 656,519 |
| Mode M9 | |||
|---|---|---|---|
| Quadrant | BADHDUFLAG | Total packets | Discarded packets |
| A | 0 | 23 | 0 |
| B | 0 | 24 | 0 |
| C | 0 | 24 | 0 |
| D | 0 | 24 | 0 |
| Mode SS | |||
|---|---|---|---|
| Quadrant | BADHDUFLAG | Total packets | Discarded packets |
| A | 0 | 126 | 0 |
| B | 0 | 126 | 0 |
| C | 0 | 126 | 0 |
| D | 0 | 126 | 0 |
| Mode M0 | |||
|---|---|---|---|
| Quadrant | BADHDUFLAG | Total packets | Discarded packets |
| A | 0 | 15308 | 2 |
| B | 0 | 13899 | 2 |
| C | 0 | 13846 | 3 |
| D | 0 | 15206 | 2 |
| Quadrant | Total seconds | Saturated seconds | Saturation percentage |
|---|---|---|---|
| A | 6163 | 131 | 2.125588% |
| B | 6163 | 122 | 1.979555% |
| C | 6162 | 168 | 2.726388% |
| D | 6162 | 99 | 1.606621% |
Noise dominated data is calculated using 1-second bins in cleaned event files. If a bin has >2000 counts, and if more than 50% of those come from <1% of pixels, then it is considered to be noise-dominated and hence unusable.
| Quadrant | # 1 sec bins | Bins with >0 counts | Bins with >2000 counts | High rate bins dominated by noise | Noise dominated (total time) | Noise dominated (detector-on time) | Marked lightcurve |
|---|---|---|---|---|---|---|---|
| A | 7458 | 6164 | 41 | 41 | 0.55% | 0.67% | 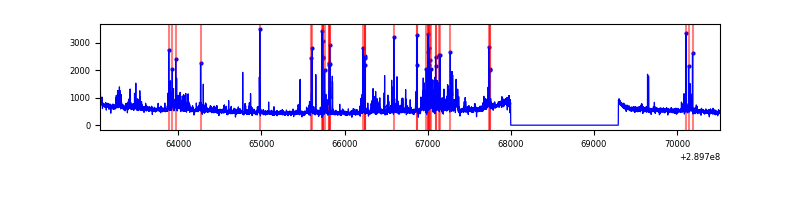 |
| B | 7458 | 6163 | 1 | 1 | 0.01% | 0.02% | 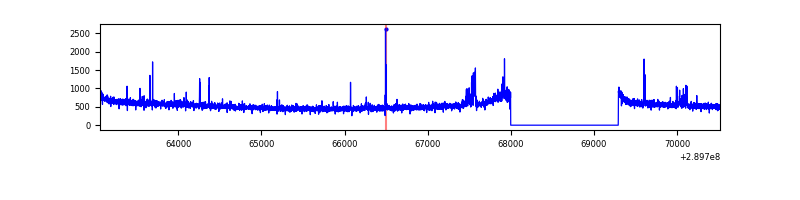 |
| C | 7457 | 6163 | 11 | 11 | 0.15% | 0.18% | 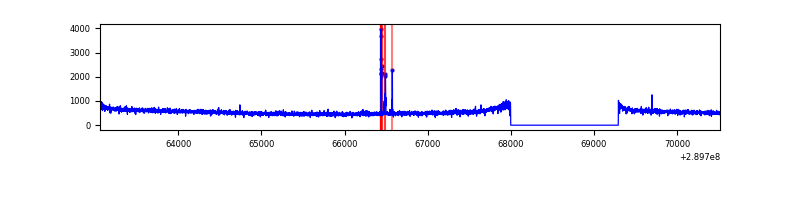 |
| D | 7457 | 6163 | 4 | 4 | 0.05% | 0.06% | 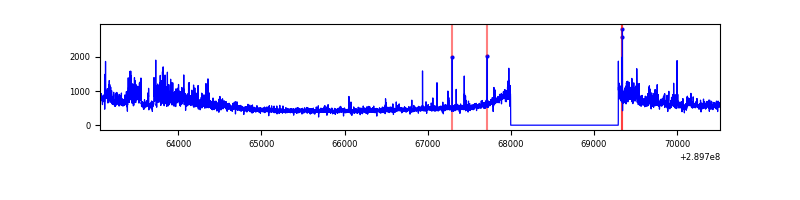 |
Top three noisy pixels from each quadrant. If the there are fewer than three noisy pixels in the level2.evt file, extra rows are filled as -1
| Pixel properties | Quadrant properties | ||||||
|---|---|---|---|---|---|---|---|
| Quadrant | DetID | PixID | Counts | Sigma | Mean | Median | Sigma |
| A | 0 | 13 | 604391 | 3615.19 | 826 | 809 | 167.0 |
| A | 13 | 254 | 10756 | 59.58 | 826 | 809 | 167.0 |
| A | 9 | 143 | 8696 | 47.24 | 826 | 809 | 167.0 |
| B | 0 | 230 | 38078 | 236.75 | 837 | 817 | 157.4 |
| B | 4 | 80 | 20345 | 124.08 | 837 | 817 | 157.4 |
| B | 12 | 111 | 18285 | 110.99 | 837 | 817 | 157.4 |
| C | 14 | 238 | 128394 | 672.34 | 818 | 826 | 189.7 |
| C | 9 | 54 | 48525 | 251.39 | 818 | 826 | 189.7 |
| C | 3 | 233 | 6585 | 30.35 | 818 | 826 | 189.7 |
| D | 5 | 222 | 332605 | 1680.26 | 824 | 805 | 197.5 |
| D | 1 | 52 | 161068 | 811.58 | 824 | 805 | 197.5 |
| D | 7 | 238 | 22830 | 111.54 | 824 | 805 | 197.5 |
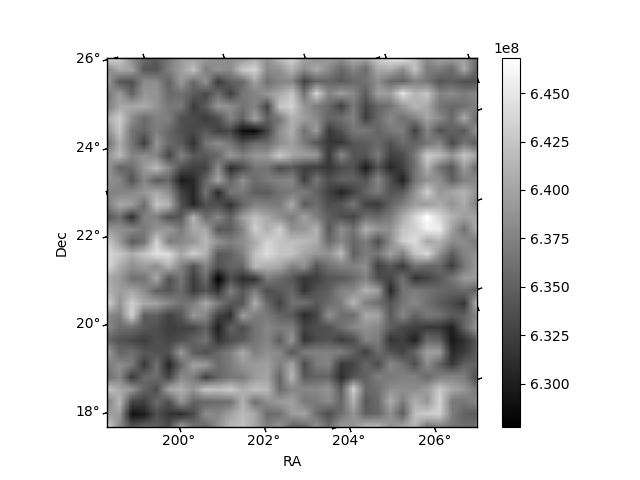
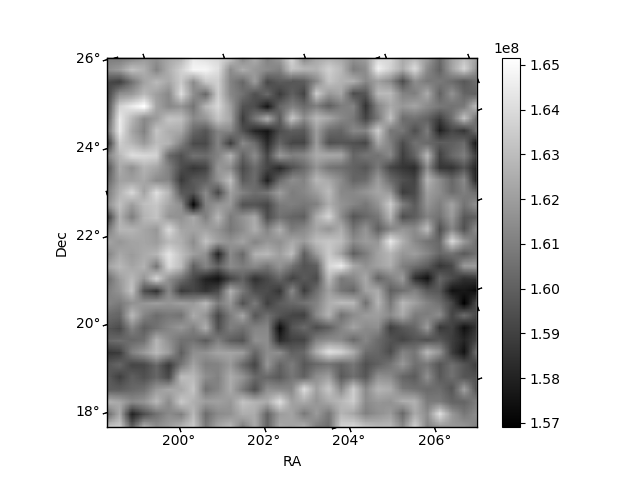
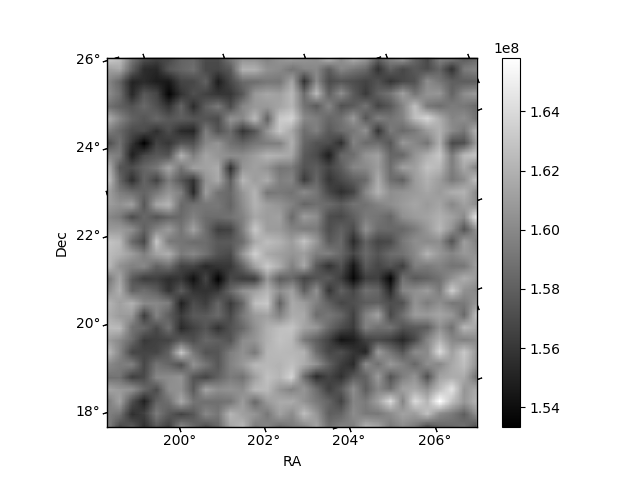
Histogram calculated using DETX and DETY for each event in the final _common_clean file
| Quadrant A | 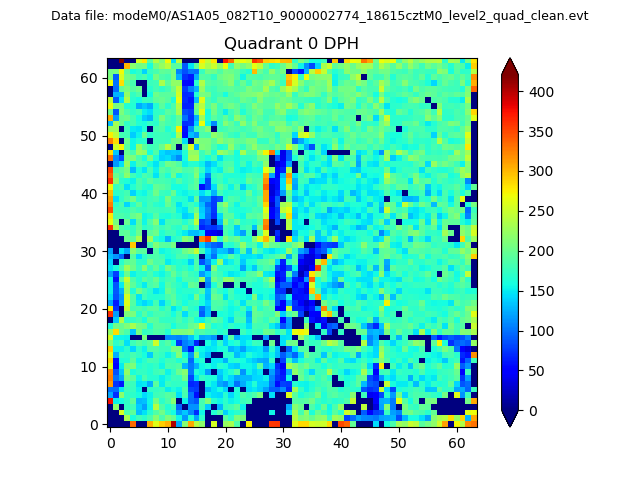 |
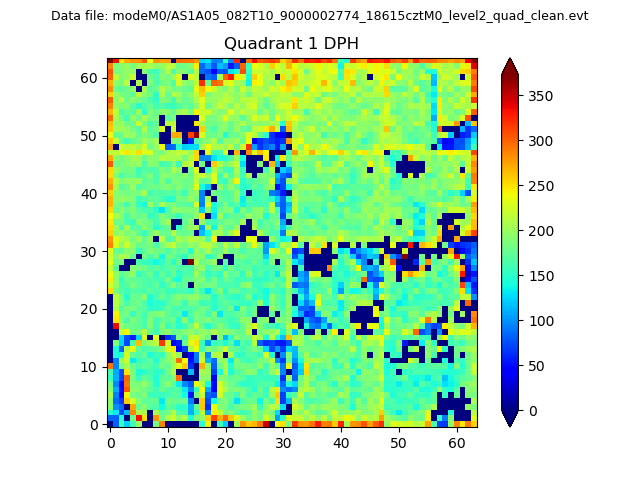 |
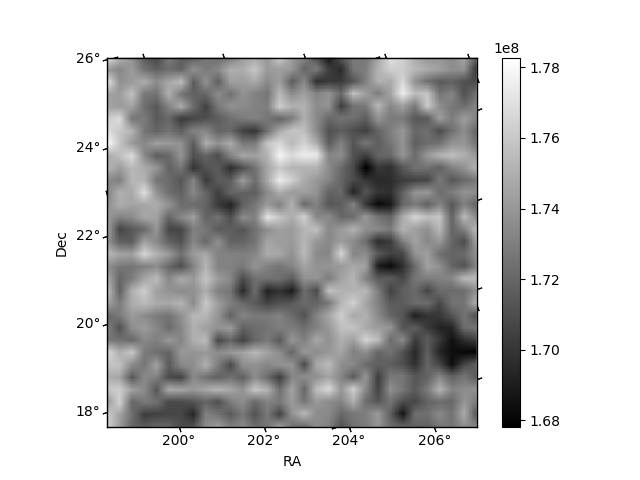
Quadrant B |
|---|---|---|---|
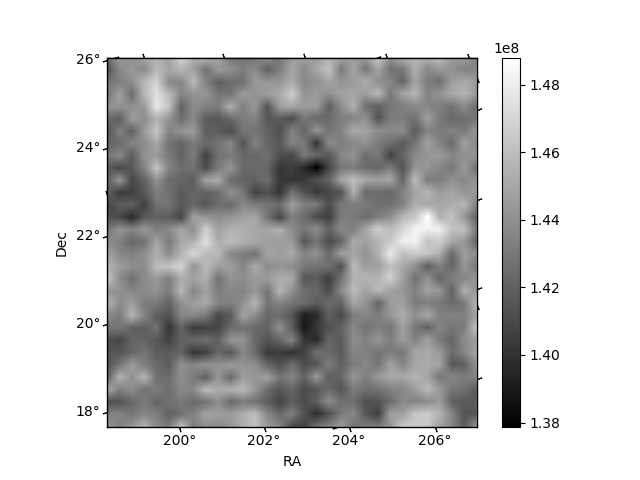
| Quadrant D | 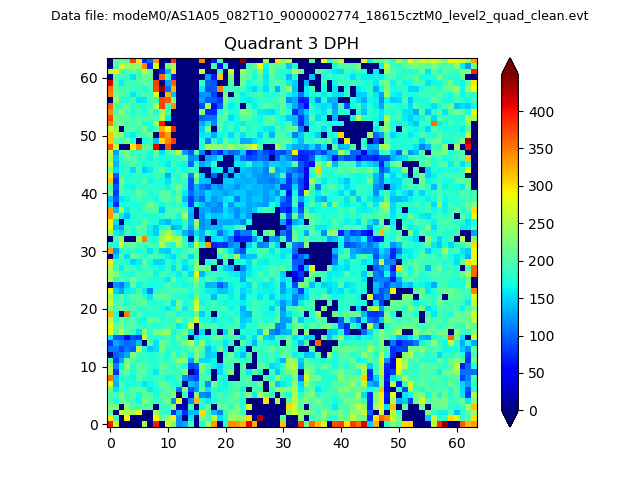 |
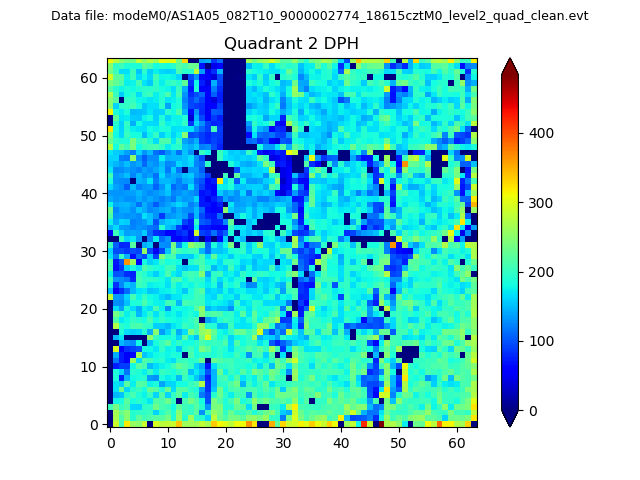 |
Quadrant C |
| Plot type | Count rate plots | Images |
|---|---|---|
| Comparison with Poisson distribution Blue bars denote a histogram of data divided into 1 sec bins. Red curve is a Poisson curve with rate = median count rate of data. |
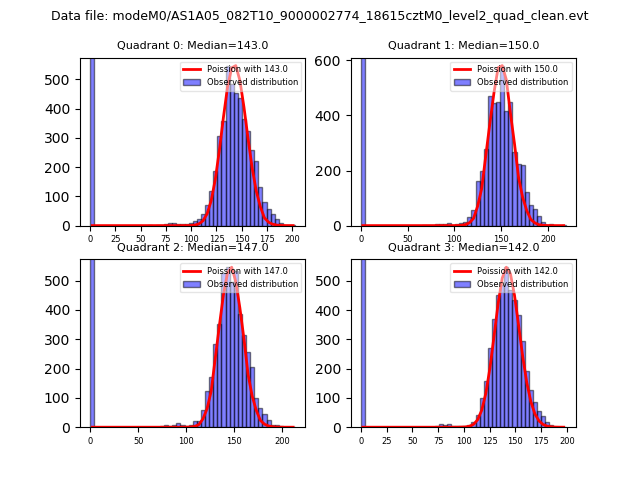 |
 |
| Quadrant-wise count rates Data is divided into 100 sec bins |
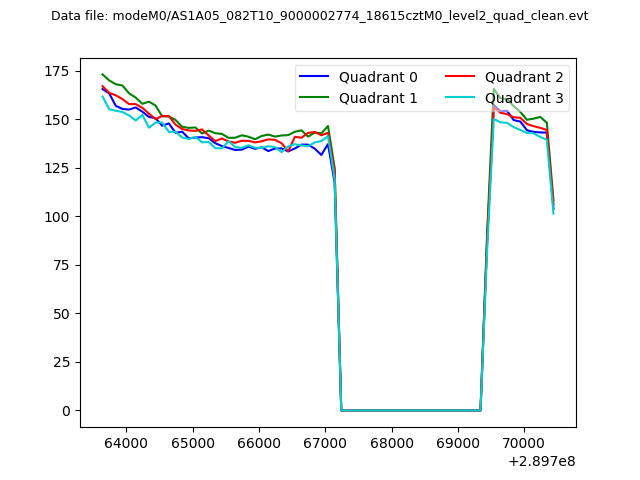 |
|
| Module-wise count rates for Quadrant A Data is divided into 100 sec bins |
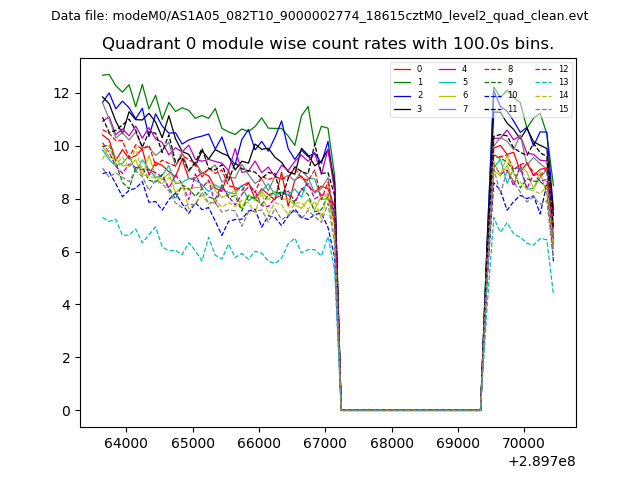 |
 |
| Module-wise count rates for Quadrant B Data is divided into 100 sec bins |
 |
 |
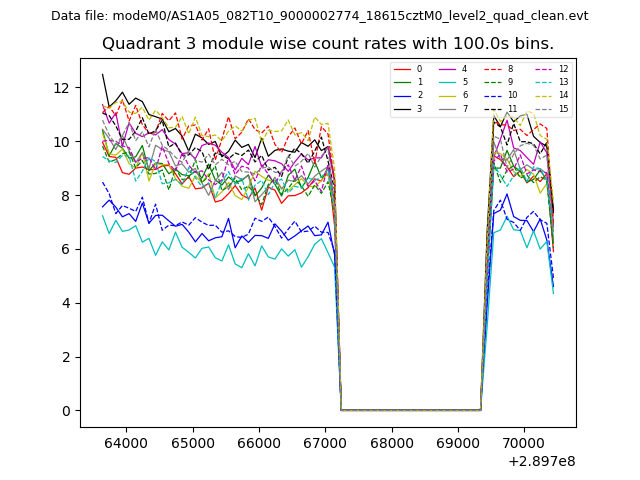
| Module-wise count rates for Quadrant C Data is divided into 100 sec bins |
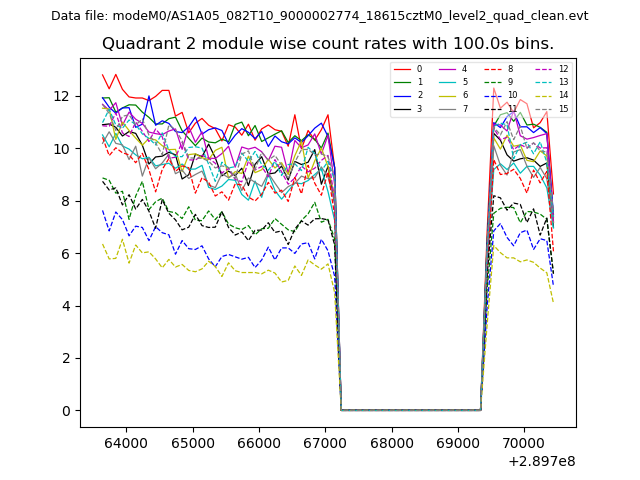 |
 |
| Module-wise count rates for Quadrant D Data is divided into 100 sec bins |
 |
 |
| Parameter | Plot |
|---|---|
| CZT HV Monitor | 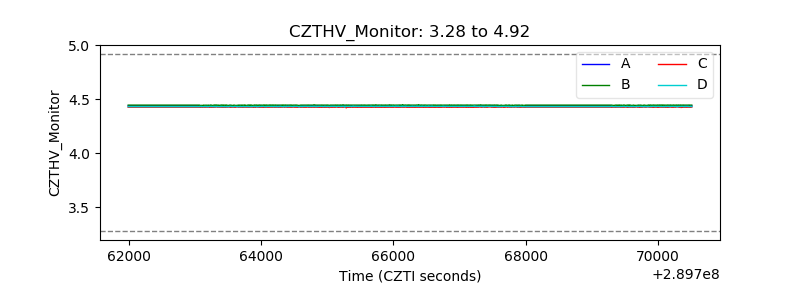 |
| D_VDD | 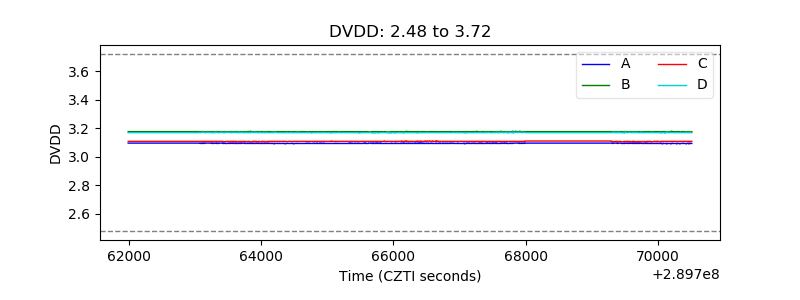 |
| Temperature 1 | 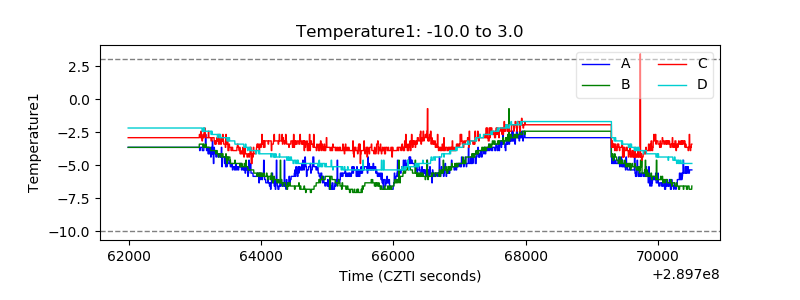 |
| Veto HV Monitor | 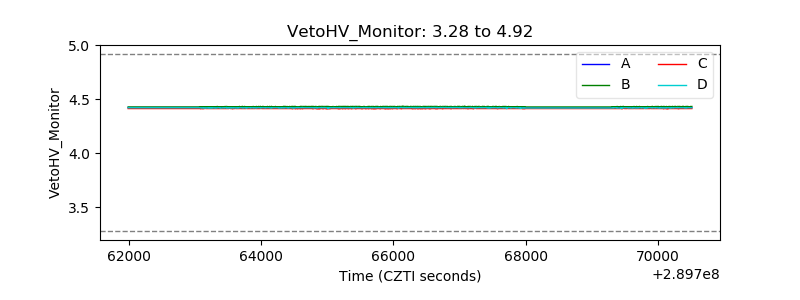 |
| Veto LLD |  |
| Alpha Counter | 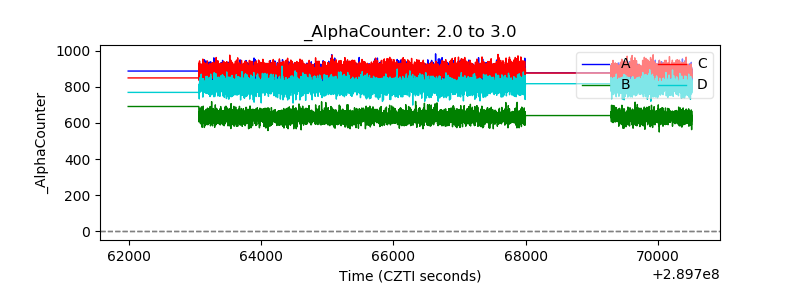 |
| _CPM_Rate | 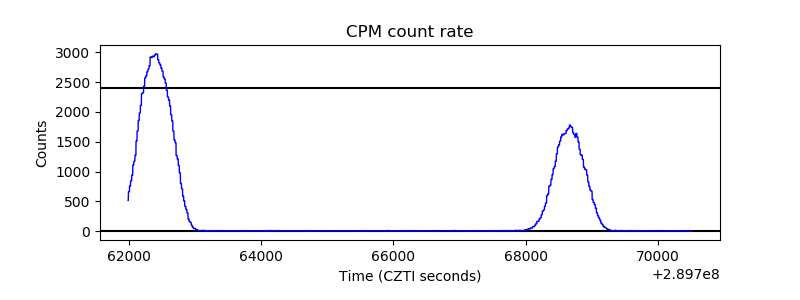 |
| CZT Counter | 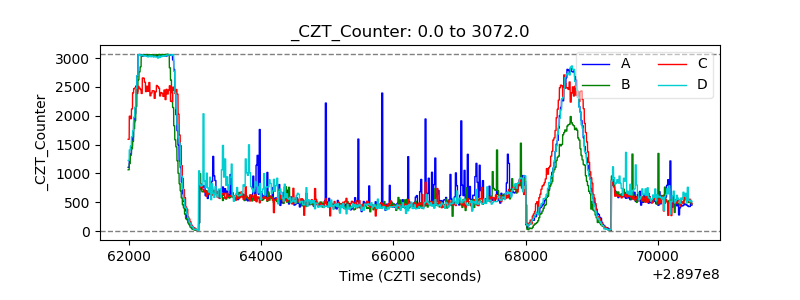 |
| +2.5 Volts monitor | 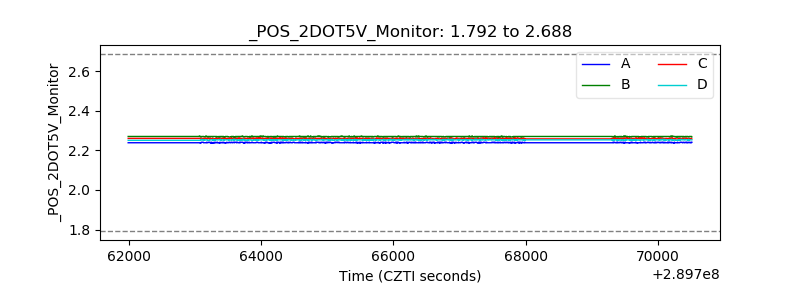 |
| +5 Volts monitor |  |
| _ROLL_ROT | 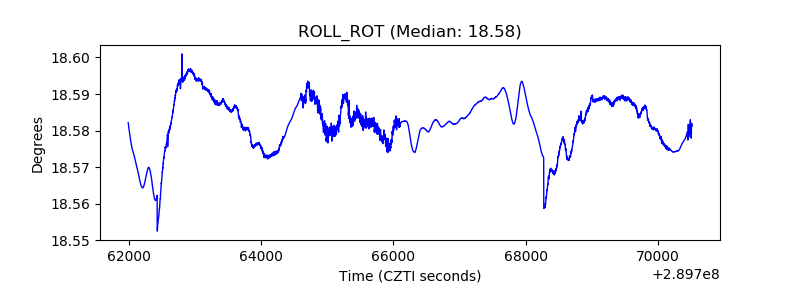 |
| _Roll_DEC | 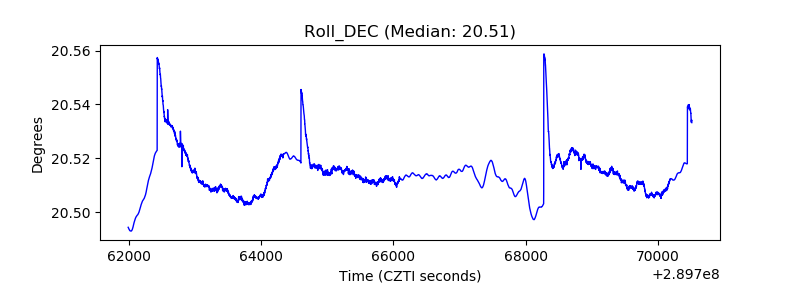 |
| _Roll_RA | 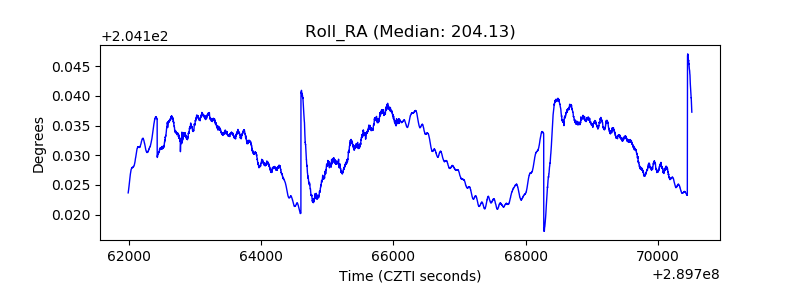 |
| Veto Counter |  |