| Param | Original file | Final file |
|---|---|---|
| Filename | modeM0/AS1A05_083T01_9000002772cztM0_level2.fits | modeM0/AS1A05_083T01_9000002772cztM0_level2_quad_clean.evt |
| Size (bytes) | 192,479,040 | 161,372,160 |
| Size | 183.6 MB | 153.9 MB |
| Events in quadrant A | 1,183,030 | 927,183 |
| Events in quadrant B | 1,148,066 | 938,855 |
| Events in quadrant C | 1,181,472 | 898,546 |
| Events in quadrant D | 1,030,164 | 834,954 |
| Mode M9 | |||
|---|---|---|---|
| Quadrant | BADHDUFLAG | Total packets | Discarded packets |
| A | 0 | 41 | 0 |
| B | 0 | 41 | 0 |
| C | 0 | 41 | 0 |
| D | 0 | 41 | 0 |
| Mode M0 | |||
|---|---|---|---|
| Quadrant | BADHDUFLAG | Total packets | Discarded packets |
| A | 0 | 41195 | 0 |
| B | 0 | 40407 | 0 |
| C | 0 | 40515 | 0 |
| D | 0 | 42982 | 0 |
| Mode SS | |||
|---|---|---|---|
| Quadrant | BADHDUFLAG | Total packets | Discarded packets |
| A | 0 | 382 | 0 |
| B | 0 | 382 | 0 |
| C | 0 | 382 | 0 |
| D | 0 | 382 | 0 |
| Quadrant | Total seconds | Saturated seconds | Saturation percentage |
|---|---|---|---|
| A | 18674 | 294 | 1.574381% |
| B | 18674 | 269 | 1.440506% |
| C | 18674 | 346 | 1.852844% |
| D | 18674 | 375 | 2.008140% |
Noise dominated data is calculated using 1-second bins in cleaned event files. If a bin has >2000 counts, and if more than 50% of those come from <1% of pixels, then it is considered to be noise-dominated and hence unusable.
| Quadrant | # 1 sec bins | Bins with >0 counts | Bins with >2000 counts | High rate bins dominated by noise | Noise dominated (total time) | Noise dominated (detector-on time) | Marked lightcurve |
|---|---|---|---|---|---|---|---|
| A | 22799 | 18669 | 0 | 0 | 0.00% | 0.00% |  |
| B | 22799 | 18669 | 0 | 0 | 0.00% | 0.00% |  |
| C | 22799 | 18670 | 0 | 0 | 0.00% | 0.00% |  |
| D | 22799 | 18658 | 0 | 0 | 0.00% | 0.00% | 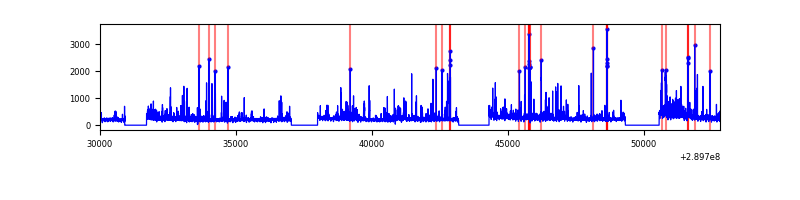 |
Top three noisy pixels from each quadrant. If the there are fewer than three noisy pixels in the level2.evt file, extra rows are filled as -1
| Pixel properties | Quadrant properties | ||||||
|---|---|---|---|---|---|---|---|
| Quadrant | DetID | PixID | Counts | Sigma | Mean | Median | Sigma |
| A | 0 | 29 | 958 | 8.65 | 308 | 290 | 77.2 |
| A | 7 | 110 | 948 | 8.52 | 308 | 290 | 77.2 |
| A | 9 | 19 | 891 | 7.79 | 308 | 290 | 77.2 |
| B | 2 | 9 | 960 | 10.71 | 303 | 288 | 62.8 |
| B | 2 | 8 | 785 | 7.92 | 303 | 288 | 62.8 |
| B | 3 | 17 | 727 | 6.99 | 303 | 288 | 62.8 |
| C | 3 | 126 | 826 | 6.56 | 312 | 293 | 81.3 |
| C | 12 | 250 | 802 | 6.26 | 312 | 293 | 81.3 |
| C | 12 | 249 | 802 | 6.26 | 312 | 293 | 81.3 |
| D | 10 | 190 | 757 | 6.38 | 293 | 269 | 76.5 |
| D | 3 | 14 | 742 | 6.19 | 293 | 269 | 76.5 |
| D | 3 | 31 | 735 | 6.09 | 293 | 269 | 76.5 |
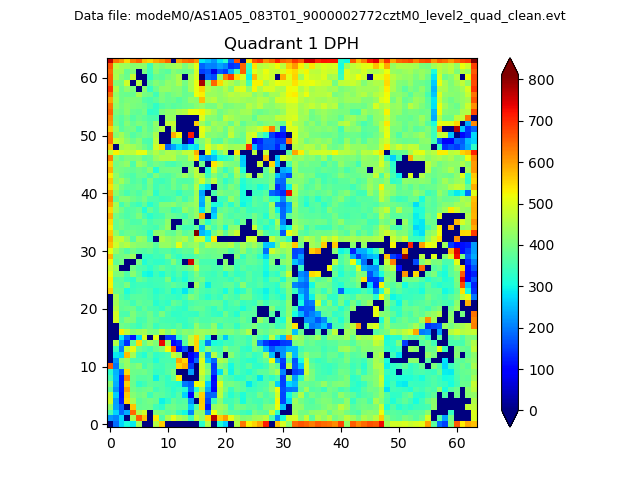
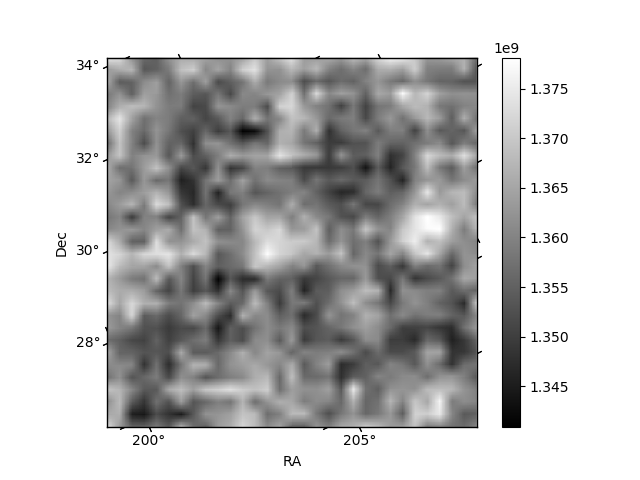
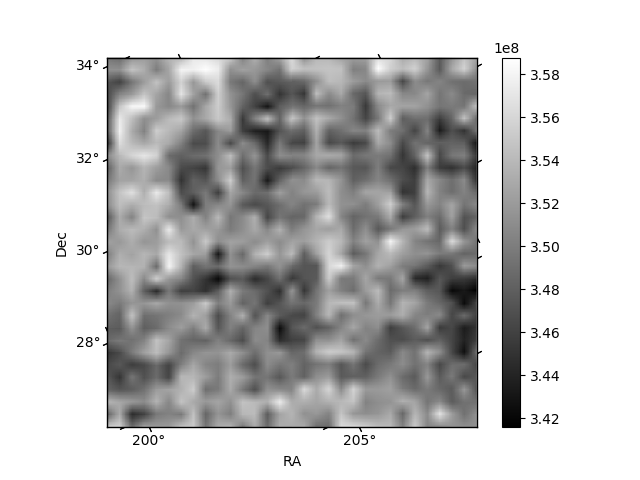
Histogram calculated using DETX and DETY for each event in the final _common_clean file
| Quadrant A |  |
 |
Quadrant B |
|---|---|---|---|
| Quadrant D | 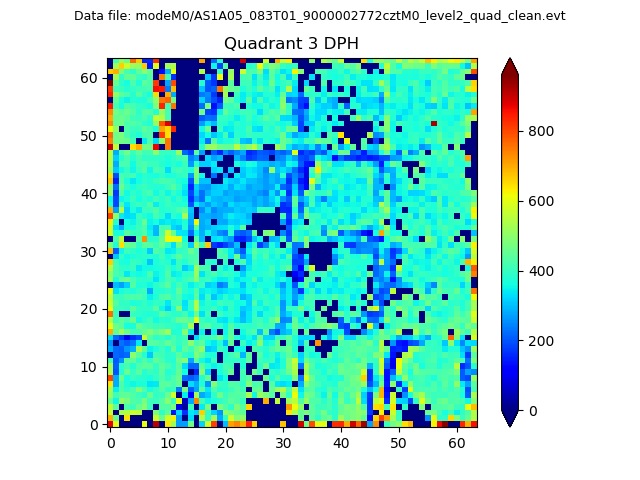 |
 |
Quadrant C |
| Plot type | Count rate plots | Images |
|---|---|---|
| Comparison with Poisson distribution Blue bars denote a histogram of data divided into 1 sec bins. Red curve is a Poisson curve with rate = median count rate of data. |
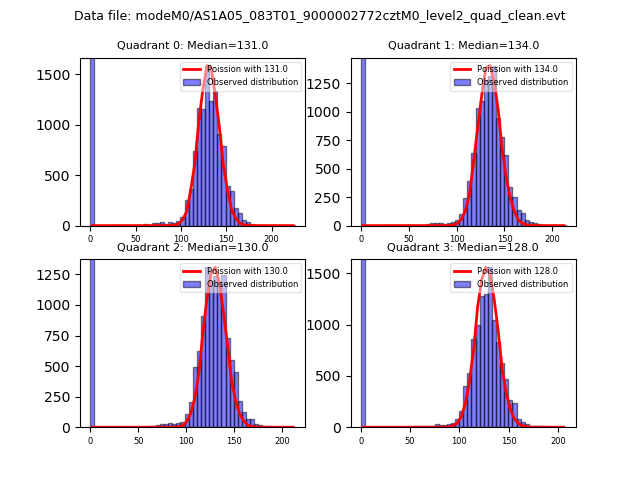 |
 |
| Quadrant-wise count rates Data is divided into 100 sec bins |
 |
|
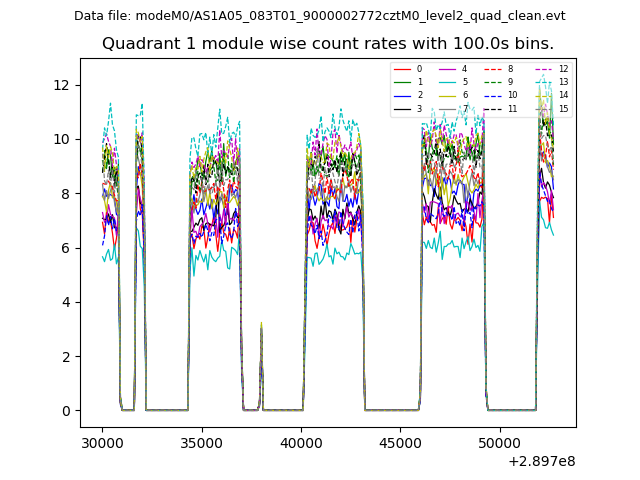
| Module-wise count rates for Quadrant A Data is divided into 100 sec bins |
 |
 |
| Module-wise count rates for Quadrant B Data is divided into 100 sec bins |
 |
 |
| Module-wise count rates for Quadrant C Data is divided into 100 sec bins |
 |
 |
| Module-wise count rates for Quadrant D Data is divided into 100 sec bins |
 |
 |
| Parameter | Plot |
|---|---|
| CZT HV Monitor | 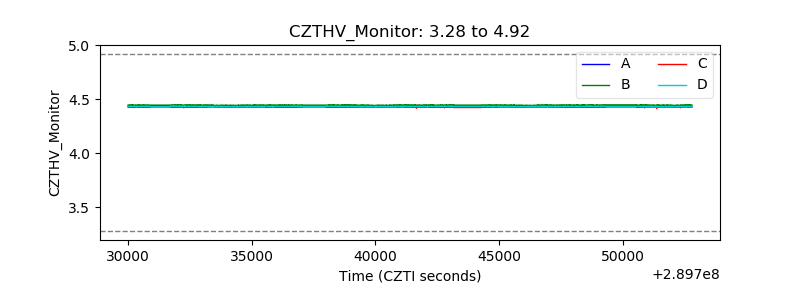 |
| D_VDD |  |
| Temperature 1 |  |
| Veto HV Monitor |  |
| Veto LLD |  |
| Alpha Counter |  |
| _CPM_Rate |  |
| CZT Counter |  |
| +2.5 Volts monitor |  |
| +5 Volts monitor |  |
| _ROLL_ROT | 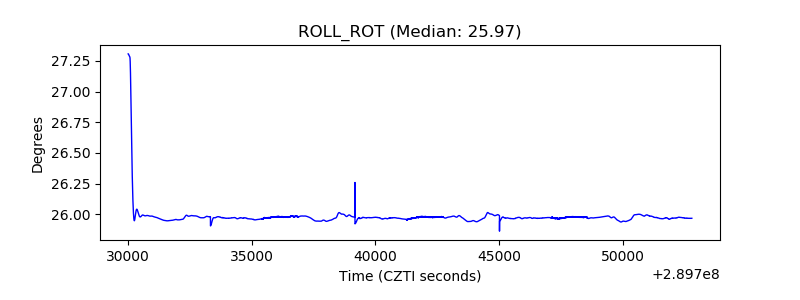 |
| _Roll_DEC | 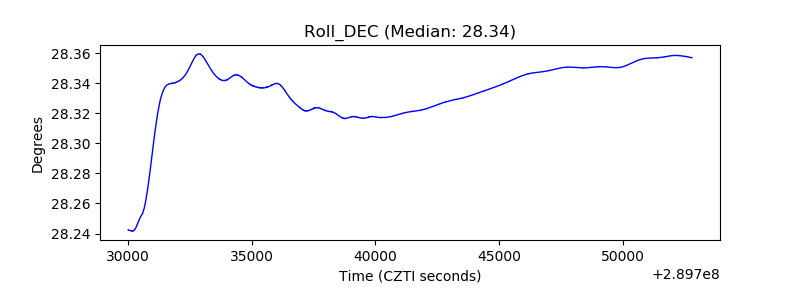 |
| _Roll_RA |  |
| Veto Counter |  |