| Param | Original file | Final file |
|---|---|---|
| Filename | modeM0/AS1A05_083T01_9000002772_18608cztM0_level2.evt | modeM0/AS1A05_083T01_9000002772_18608cztM0_level2_quad_clean.evt |
| Size (bytes) | 171,181,440 | 29,427,840 |
| Size | 163.3 MB | 28.1 MB |
| Events in quadrant A | 1,175,704 | 180,073 |
| Events in quadrant B | 1,300,710 | 184,884 |
| Events in quadrant C | 1,256,431 | 178,398 |
| Events in quadrant D | 1,288,367 | 176,793 |
| Mode M9 | |||
|---|---|---|---|
| Quadrant | BADHDUFLAG | Total packets | Discarded packets |
| A | 0 | 8 | 0 |
| B | 0 | 8 | 0 |
| C | 0 | 8 | 0 |
| D | 0 | 8 | 0 |
| Mode M0 | |||
|---|---|---|---|
| Quadrant | BADHDUFLAG | Total packets | Discarded packets |
| A | 0 | 4893 | 1 |
| B | 0 | 5235 | 1 |
| C | 0 | 5130 | 1 |
| D | 0 | 5349 | 1 |
| Mode SS | |||
|---|---|---|---|
| Quadrant | BADHDUFLAG | Total packets | Discarded packets |
| A | 0 | 48 | 0 |
| B | 0 | 48 | 0 |
| C | 0 | 48 | 0 |
| D | 0 | 48 | 0 |
| Quadrant | Total seconds | Saturated seconds | Saturation percentage |
|---|---|---|---|
| A | 2370 | 54 | 2.278481% |
| B | 2370 | 67 | 2.827004% |
| C | 2370 | 68 | 2.869198% |
| D | 2370 | 57 | 2.405063% |
Noise dominated data is calculated using 1-second bins in cleaned event files. If a bin has >2000 counts, and if more than 50% of those come from <1% of pixels, then it is considered to be noise-dominated and hence unusable.
| Quadrant | # 1 sec bins | Bins with >0 counts | Bins with >2000 counts | High rate bins dominated by noise | Noise dominated (total time) | Noise dominated (detector-on time) | Marked lightcurve |
|---|---|---|---|---|---|---|---|
| A | 3170 | 2370 | 0 | 0 | 0.00% | 0.00% | 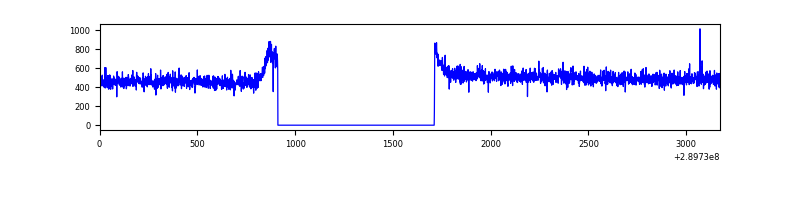 |
| B | 3170 | 2370 | 3 | 3 | 0.09% | 0.13% | 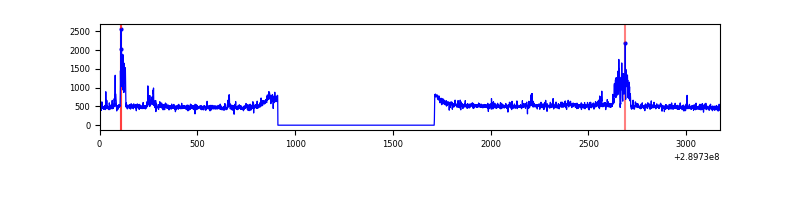 |
| C | 3170 | 2370 | 12 | 12 | 0.38% | 0.51% | 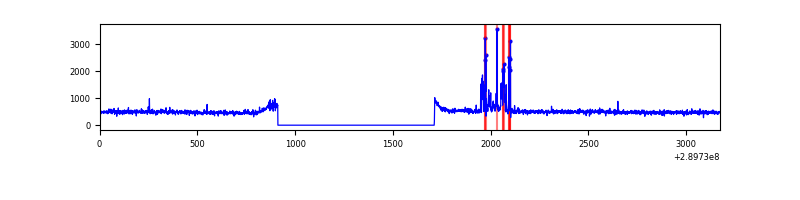 |
| D | 3170 | 2370 | 13 | 13 | 0.41% | 0.55% | 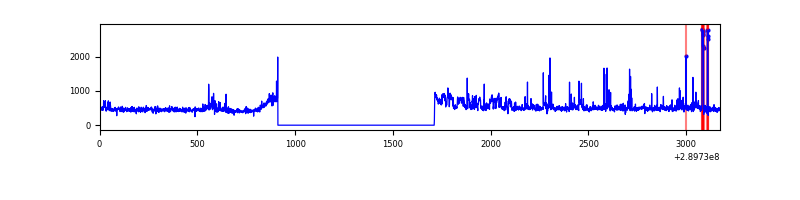 |
Top three noisy pixels from each quadrant. If the there are fewer than three noisy pixels in the level2.evt file, extra rows are filled as -1
| Pixel properties | Quadrant properties | ||||||
|---|---|---|---|---|---|---|---|
| Quadrant | DetID | PixID | Counts | Sigma | Mean | Median | Sigma |
| A | 13 | 254 | 3597 | 51.78 | 304 | 297 | 63.7 |
| A | 0 | 226 | 2629 | 36.59 | 304 | 297 | 63.7 |
| A | 3 | 137 | 2421 | 33.33 | 304 | 297 | 63.7 |
| B | 0 | 230 | 91074 | 1497.92 | 302 | 293 | 60.6 |
| B | 0 | 198 | 12319 | 198.43 | 302 | 293 | 60.6 |
| B | 0 | 229 | 9714 | 155.45 | 302 | 293 | 60.6 |
| C | 9 | 54 | 77713 | 1116.37 | 289 | 291 | 69.4 |
| C | 14 | 238 | 44987 | 644.49 | 289 | 291 | 69.4 |
| C | 3 | 233 | 5550 | 75.83 | 289 | 291 | 69.4 |
| D | 1 | 52 | 135581 | 1847.02 | 294 | 285 | 73.3 |
| D | 7 | 238 | 20888 | 281.27 | 294 | 285 | 73.3 |
| D | 8 | 195 | 9148 | 120.99 | 294 | 285 | 73.3 |
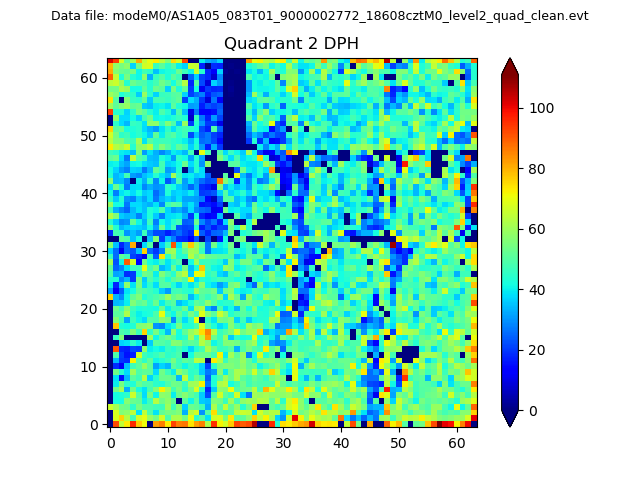
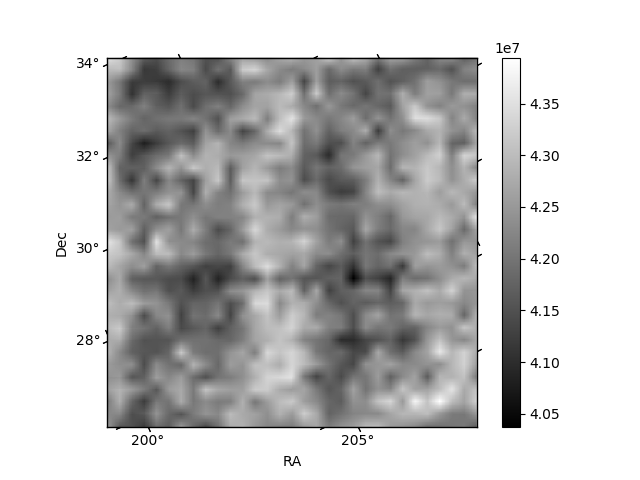
Histogram calculated using DETX and DETY for each event in the final _common_clean file
| Quadrant A | 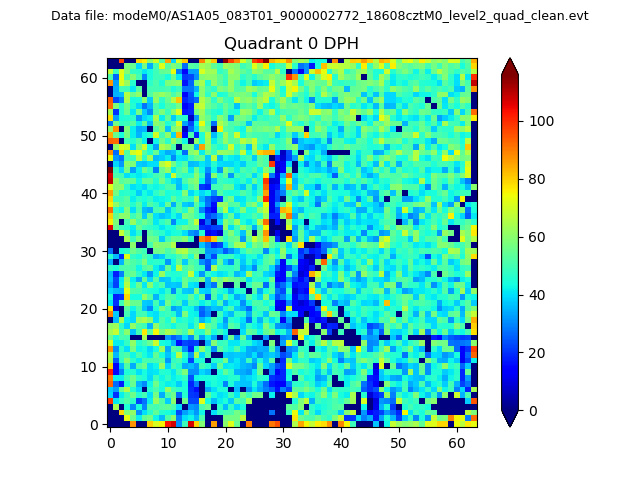 |
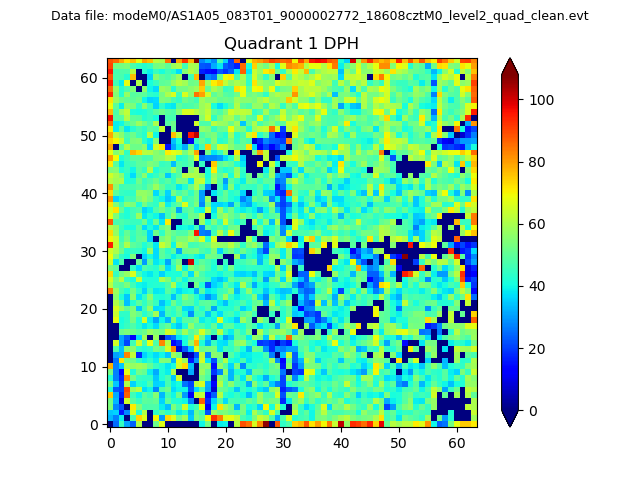 |
Quadrant B |
|---|---|---|---|
| Quadrant D | 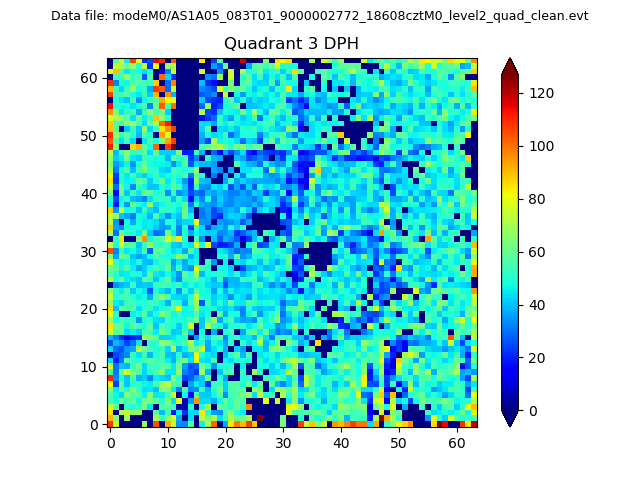 |
 |
Quadrant C |
| Plot type | Count rate plots | Images |
|---|---|---|
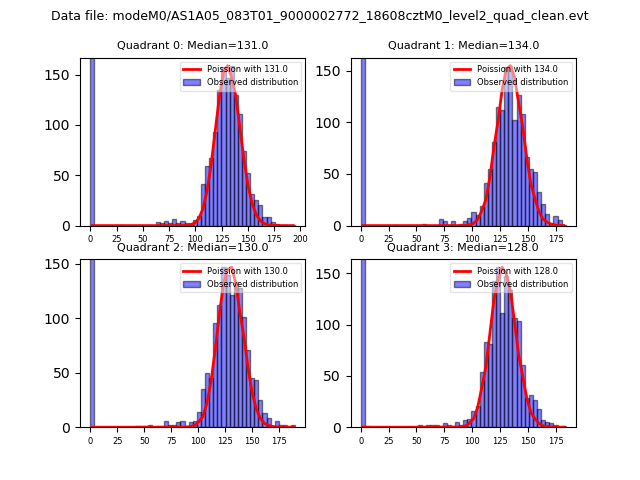
| Comparison with Poisson distribution Blue bars denote a histogram of data divided into 1 sec bins. Red curve is a Poisson curve with rate = median count rate of data. |
 |
 |
| Quadrant-wise count rates Data is divided into 100 sec bins |
 |
|
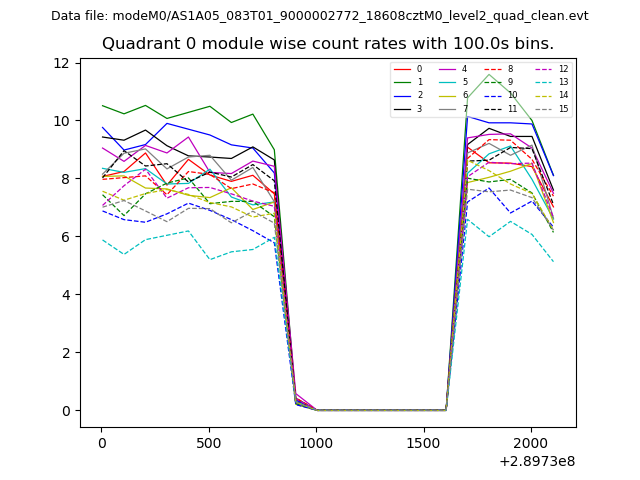
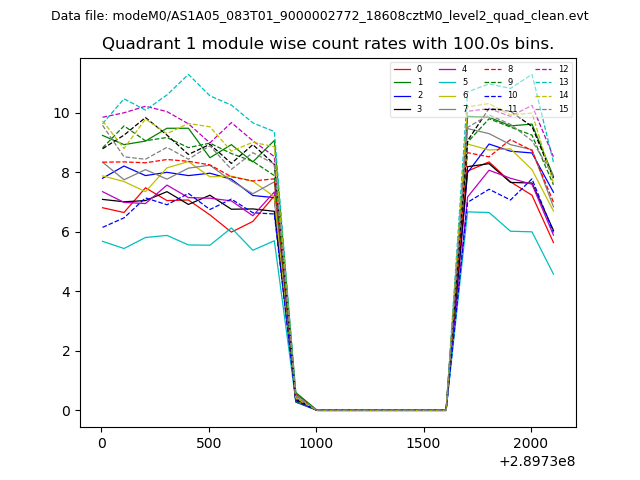
| Module-wise count rates for Quadrant A Data is divided into 100 sec bins |
 |
 |
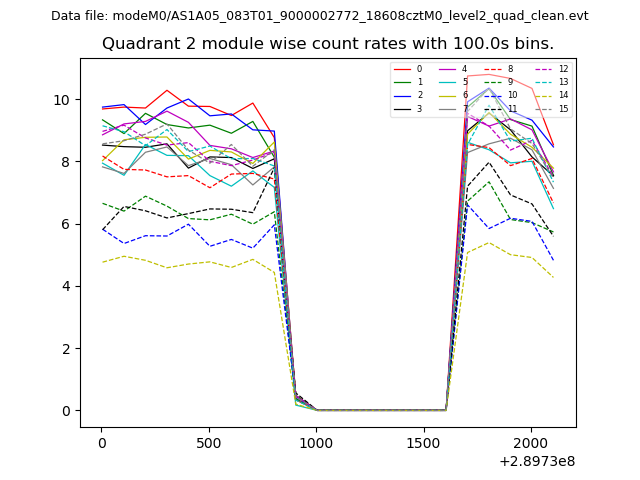
| Module-wise count rates for Quadrant B Data is divided into 100 sec bins |
 |
 |
| Module-wise count rates for Quadrant C Data is divided into 100 sec bins |
 |
 |
| Module-wise count rates for Quadrant D Data is divided into 100 sec bins |
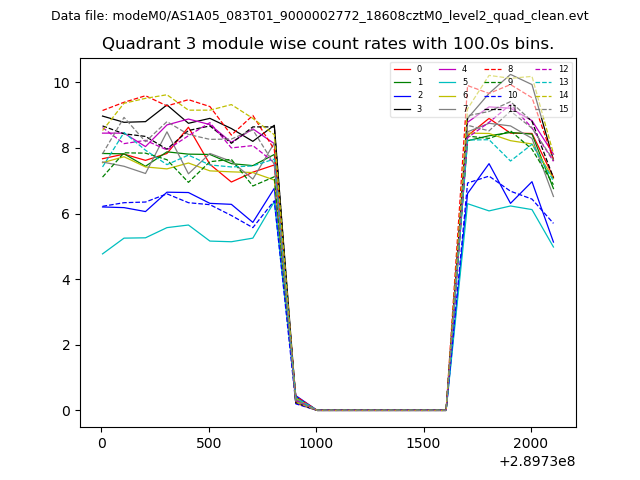 |
 |
| Parameter | Plot |
|---|---|
| CZT HV Monitor | 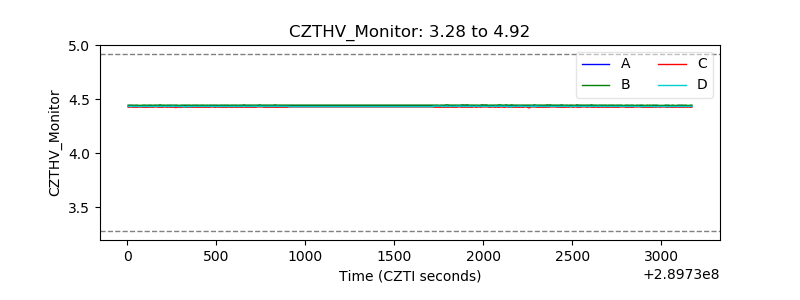 |
| D_VDD | 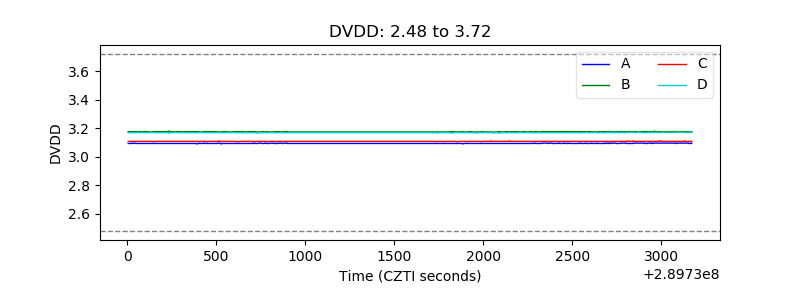 |
| Temperature 1 | 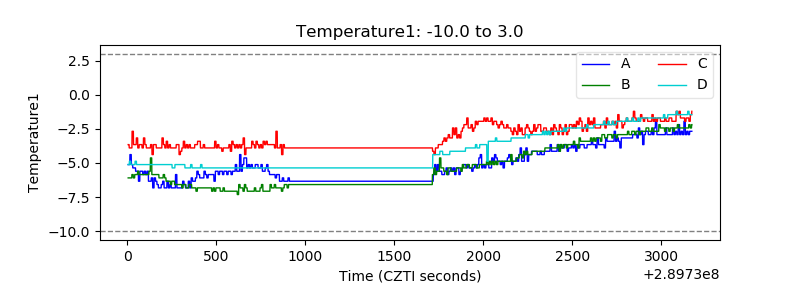 |
| Veto HV Monitor | 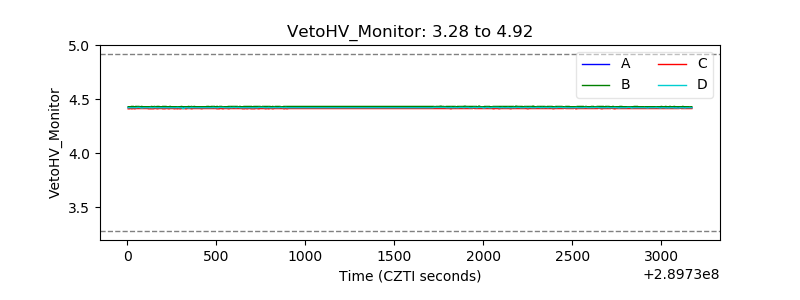 |
| Veto LLD |  |
| Alpha Counter |  |
| _CPM_Rate | 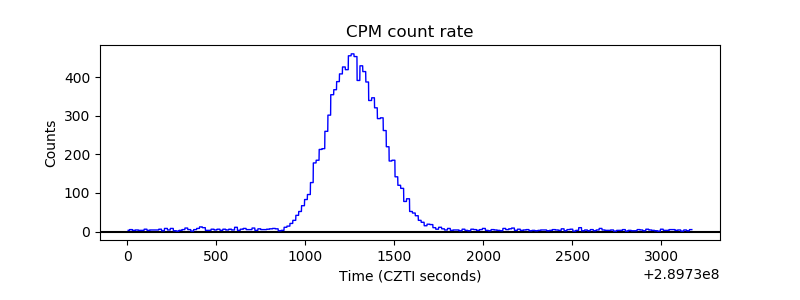 |
| CZT Counter | 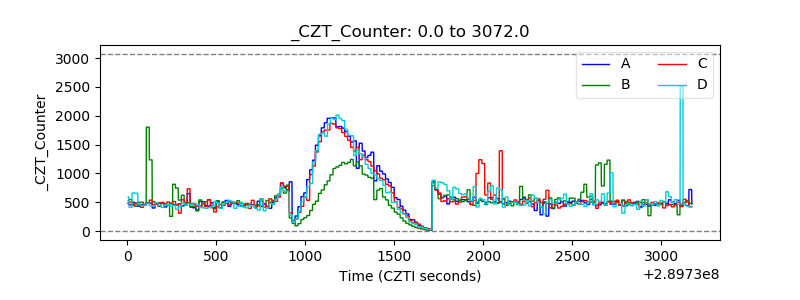 |
| +2.5 Volts monitor | 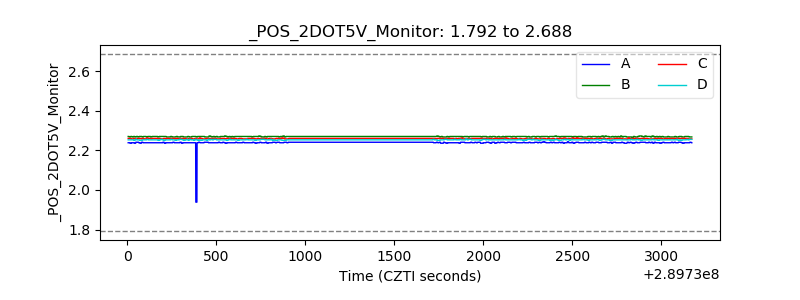 |
| +5 Volts monitor |  |
| _ROLL_ROT | 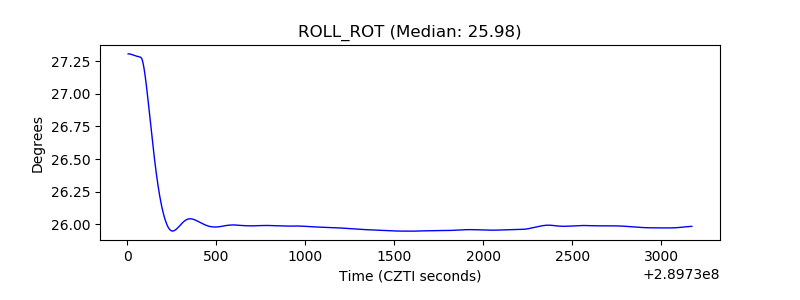 |
| _Roll_DEC | 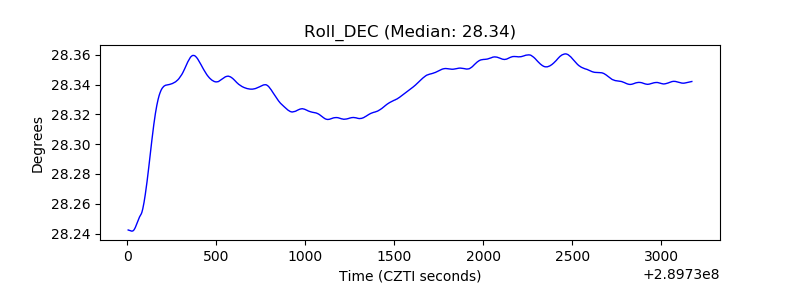 |
| _Roll_RA | 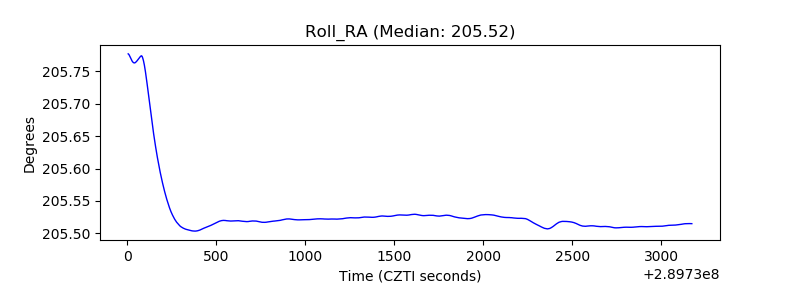 |
| Veto Counter | 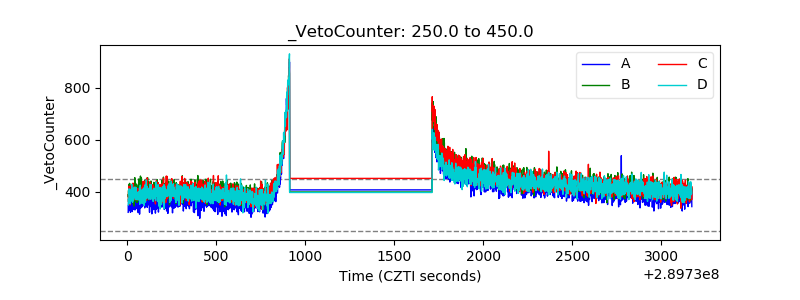 |