| Param | Original file | Final file |
|---|---|---|
| Filename | modeM0/AS1A05_083T01_9000002772_18609cztM0_level2.evt | modeM0/AS1A05_083T01_9000002772_18609cztM0_level2_quad_clean.evt |
| Size (bytes) | 462,608,640 | 68,008,320 |
| Size | 441.2 MB | 64.9 MB |
| Events in quadrant A | 3,293,526 | 401,875 |
| Events in quadrant B | 3,415,107 | 407,837 |
| Events in quadrant C | 3,349,436 | 394,689 |
| Events in quadrant D | 3,499,406 | 390,150 |
| Mode M9 | |||
|---|---|---|---|
| Quadrant | BADHDUFLAG | Total packets | Discarded packets |
| A | 0 | 14 | 0 |
| B | 0 | 15 | 0 |
| C | 0 | 15 | 0 |
| D | 0 | 15 | 0 |
| Mode M0 | |||
|---|---|---|---|
| Quadrant | BADHDUFLAG | Total packets | Discarded packets |
| A | 0 | 13963 | 2 |
| B | 0 | 14238 | 2 |
| C | 0 | 13998 | 2 |
| D | 0 | 14736 | 2 |
| Mode SS | |||
|---|---|---|---|
| Quadrant | BADHDUFLAG | Total packets | Discarded packets |
| A | 0 | 134 | 0 |
| B | 0 | 134 | 0 |
| C | 0 | 134 | 0 |
| D | 0 | 134 | 0 |
| Quadrant | Total seconds | Saturated seconds | Saturation percentage |
|---|---|---|---|
| A | 6668 | 60 | 0.899820% |
| B | 6667 | 78 | 1.169942% |
| C | 6667 | 105 | 1.574921% |
| D | 6667 | 99 | 1.484926% |
Noise dominated data is calculated using 1-second bins in cleaned event files. If a bin has >2000 counts, and if more than 50% of those come from <1% of pixels, then it is considered to be noise-dominated and hence unusable.
| Quadrant | # 1 sec bins | Bins with >0 counts | Bins with >2000 counts | High rate bins dominated by noise | Noise dominated (total time) | Noise dominated (detector-on time) | Marked lightcurve |
|---|---|---|---|---|---|---|---|
| A | 7633 | 6668 | 1 | 1 | 0.01% | 0.01% | 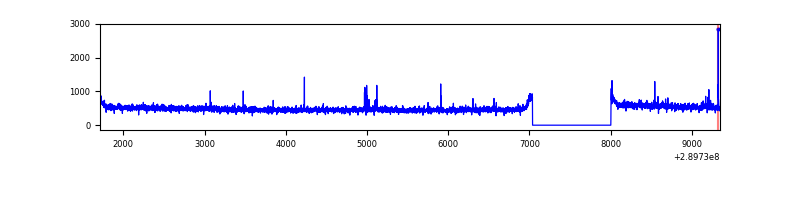 |
| B | 7632 | 6667 | 2 | 2 | 0.03% | 0.03% | 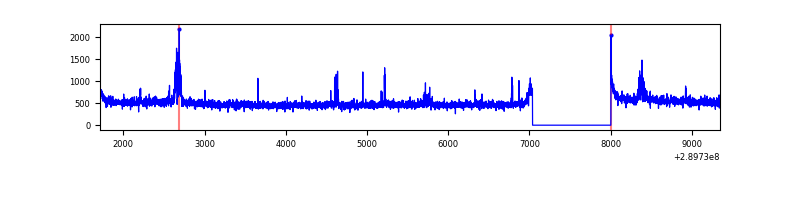 |
| C | 7632 | 6667 | 12 | 12 | 0.16% | 0.18% |  |
| D | 7632 | 6667 | 49 | 49 | 0.64% | 0.73% | 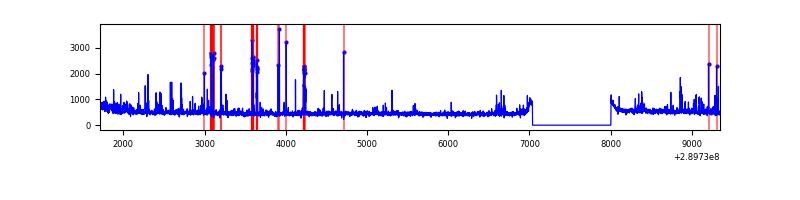 |
Top three noisy pixels from each quadrant. If the there are fewer than three noisy pixels in the level2.evt file, extra rows are filled as -1
| Pixel properties | Quadrant properties | ||||||
|---|---|---|---|---|---|---|---|
| Quadrant | DetID | PixID | Counts | Sigma | Mean | Median | Sigma |
| A | 0 | 13 | 53086 | 307.47 | 838 | 820 | 170.0 |
| A | 13 | 254 | 10063 | 54.37 | 838 | 820 | 170.0 |
| A | 9 | 143 | 8795 | 46.91 | 838 | 820 | 170.0 |
| B | 0 | 230 | 89510 | 552.61 | 834 | 813 | 160.5 |
| B | 0 | 198 | 20410 | 122.1 | 834 | 813 | 160.5 |
| B | 12 | 111 | 19451 | 116.12 | 834 | 813 | 160.5 |
| C | 14 | 238 | 124430 | 658.22 | 800 | 806 | 187.8 |
| C | 9 | 54 | 78382 | 413.04 | 800 | 806 | 187.8 |
| C | 3 | 233 | 29460 | 152.56 | 800 | 806 | 187.8 |
| D | 1 | 52 | 295379 | 1481.24 | 816 | 793 | 198.9 |
| D | 7 | 238 | 37433 | 184.23 | 816 | 793 | 198.9 |
| D | 2 | 234 | 25162 | 122.53 | 816 | 793 | 198.9 |
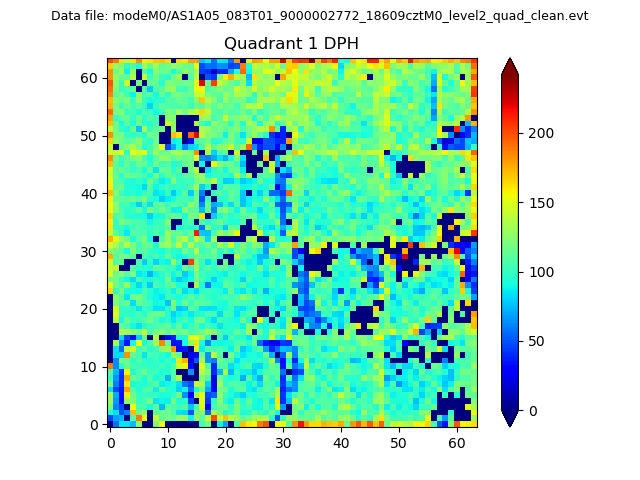
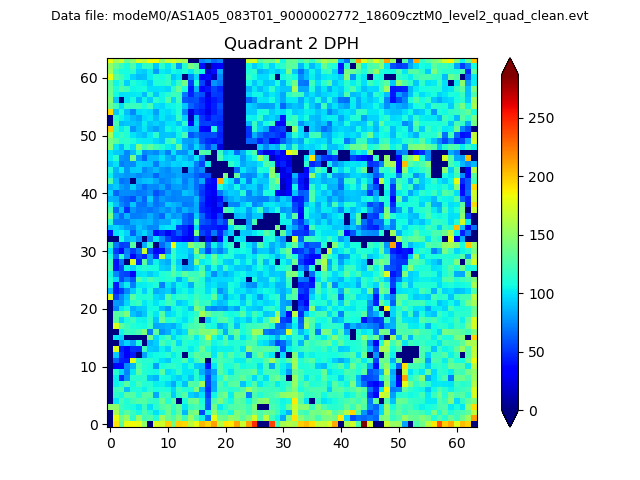
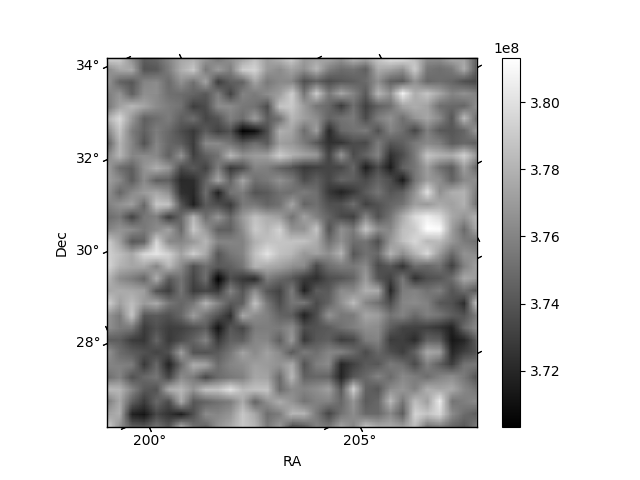
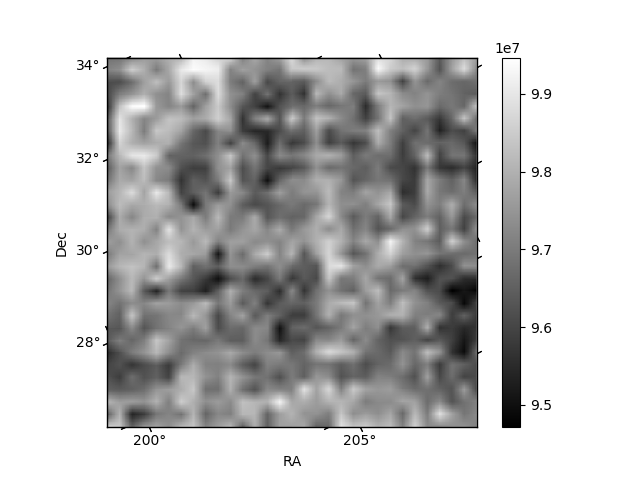
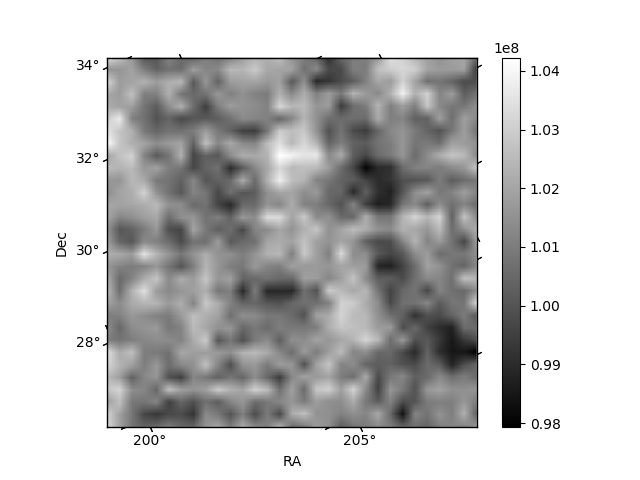
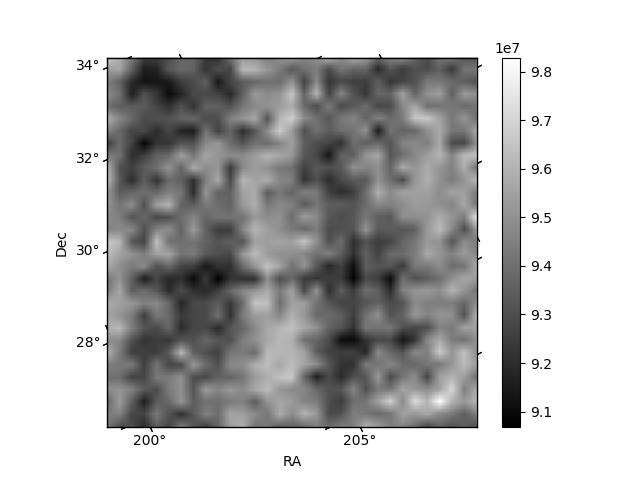
Histogram calculated using DETX and DETY for each event in the final _common_clean file
| Quadrant A | 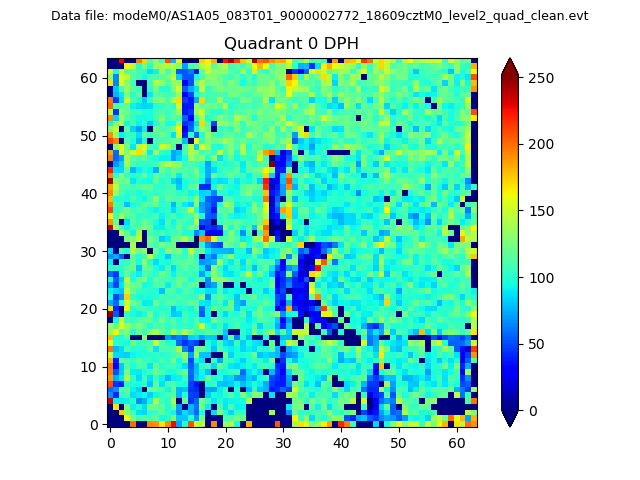 |
 |
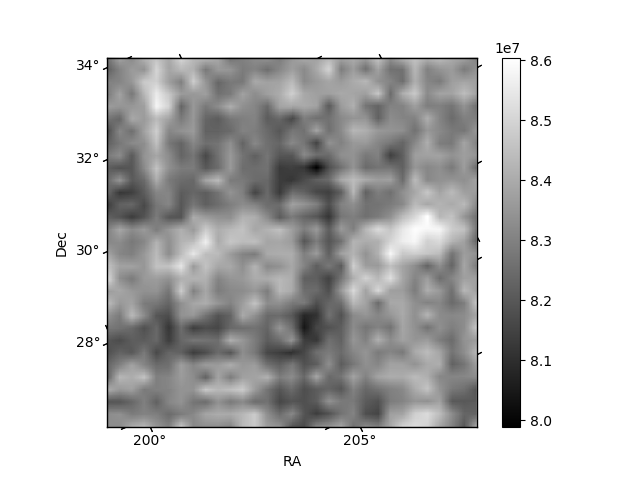
Quadrant B |
|---|---|---|---|
| Quadrant D | 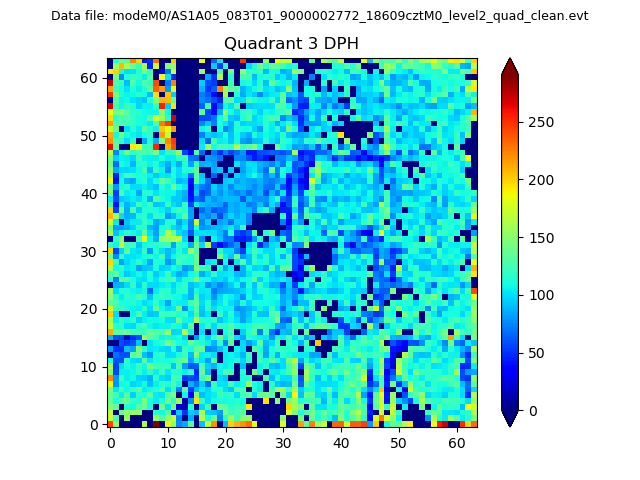 |
 |
Quadrant C |
| Plot type | Count rate plots | Images |
|---|---|---|
| Comparison with Poisson distribution Blue bars denote a histogram of data divided into 1 sec bins. Red curve is a Poisson curve with rate = median count rate of data. |
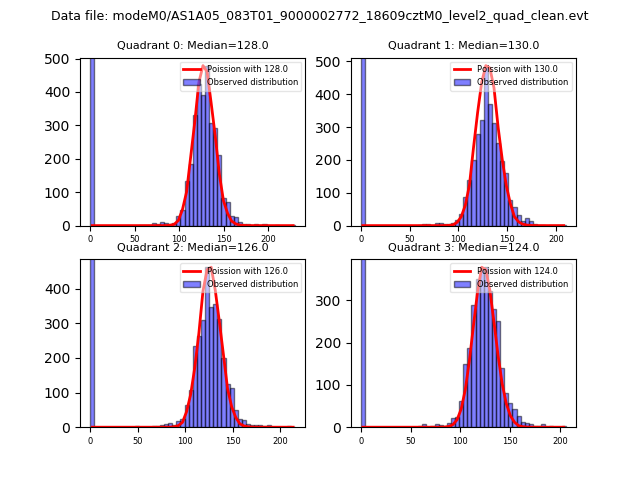 |
 |
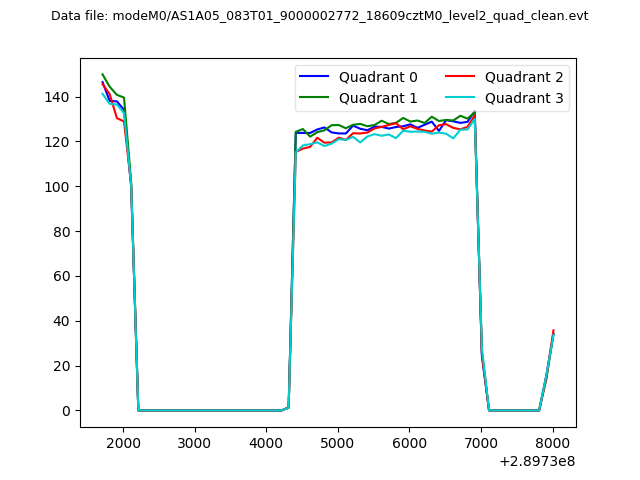
| Quadrant-wise count rates Data is divided into 100 sec bins |
 |
|
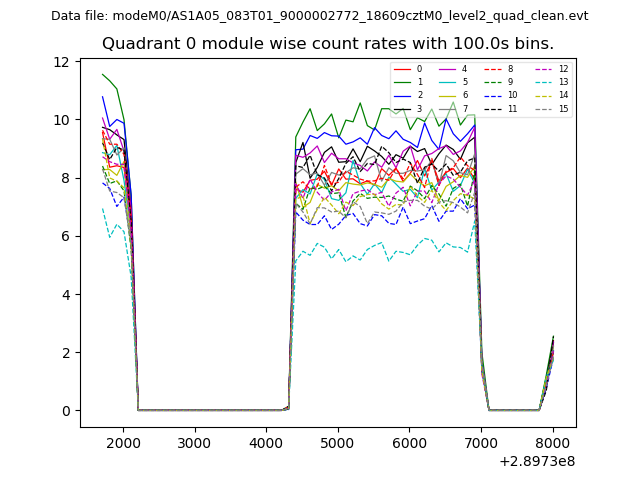
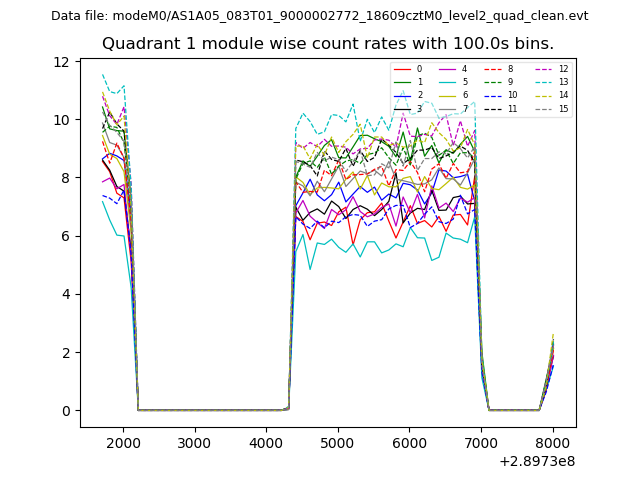
| Module-wise count rates for Quadrant A Data is divided into 100 sec bins |
 |
 |
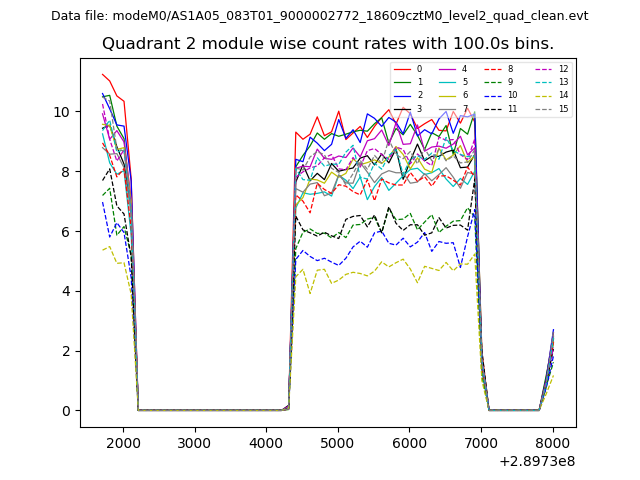
| Module-wise count rates for Quadrant B Data is divided into 100 sec bins |
 |
 |
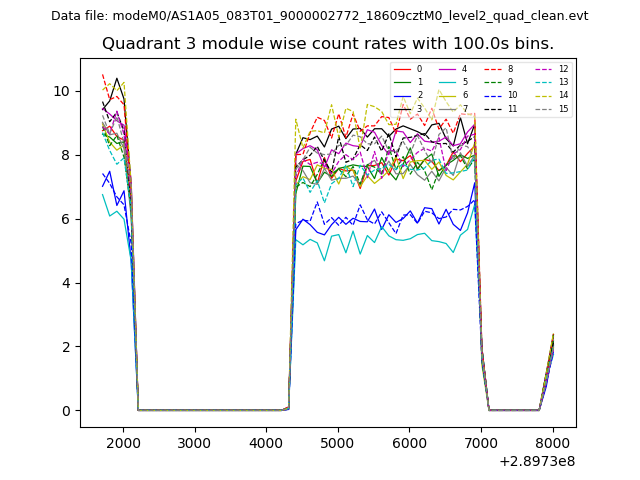
| Module-wise count rates for Quadrant C Data is divided into 100 sec bins |
 |
 |
| Module-wise count rates for Quadrant D Data is divided into 100 sec bins |
 |
 |
| Parameter | Plot |
|---|---|
| CZT HV Monitor | 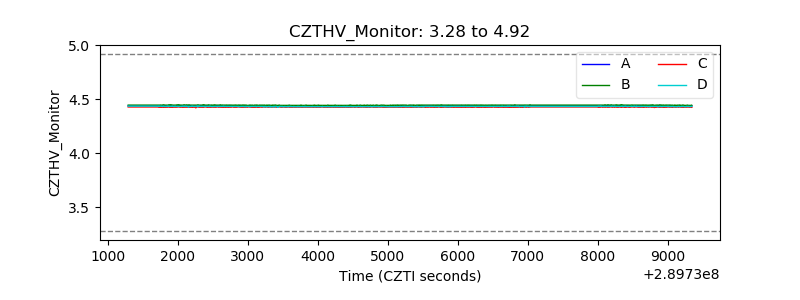 |
| D_VDD | 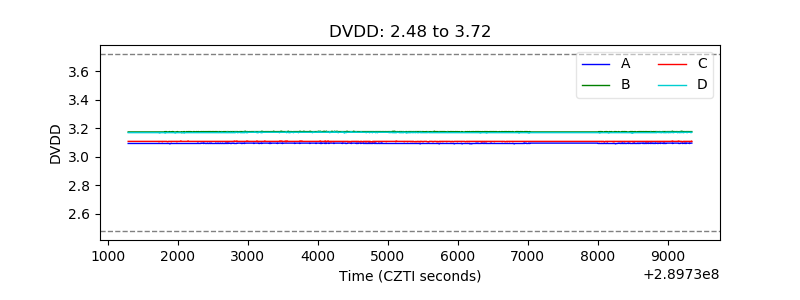 |
| Temperature 1 | 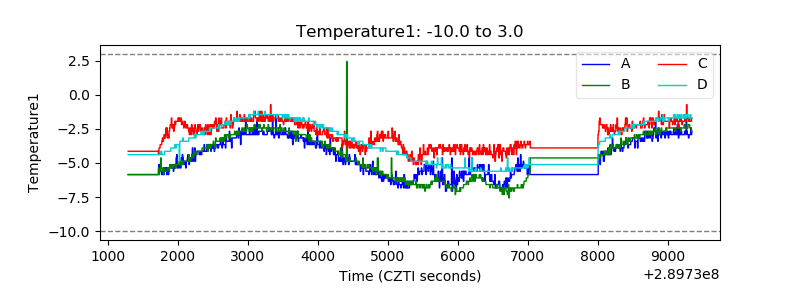 |
| Veto HV Monitor | 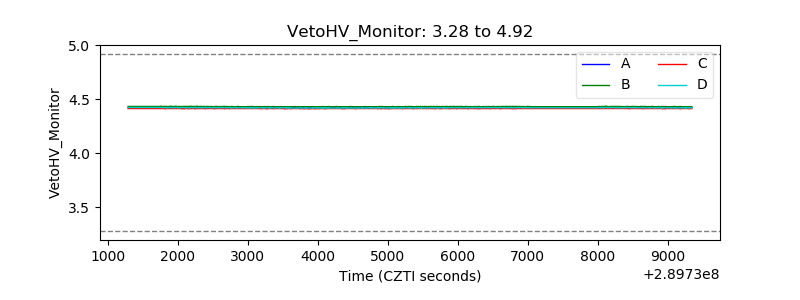 |
| Veto LLD | 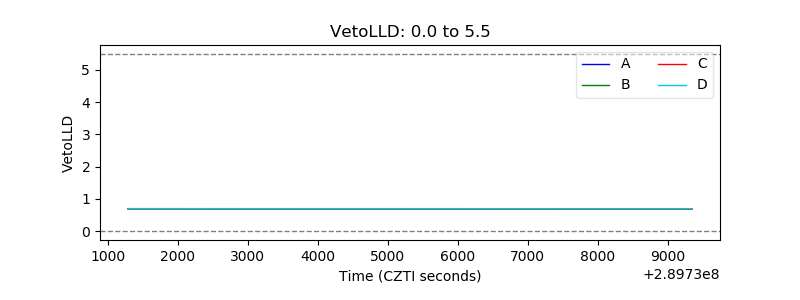 |
| Alpha Counter | 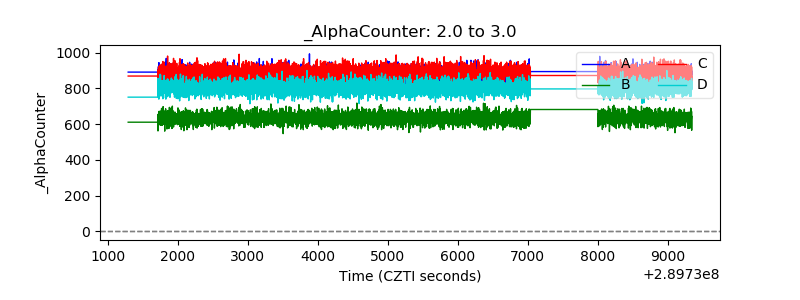 |
| _CPM_Rate | 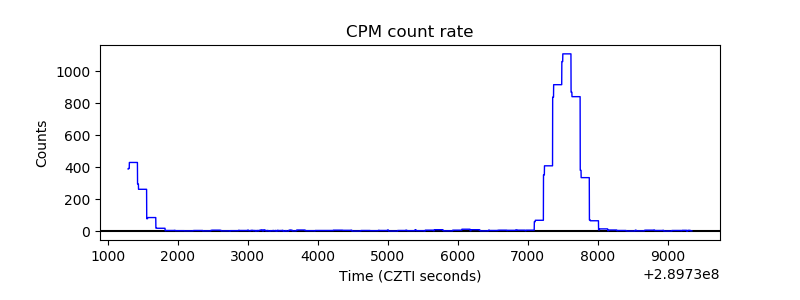 |
| CZT Counter | 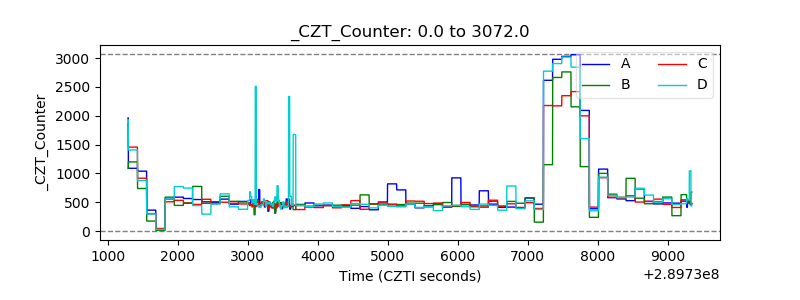 |
| +2.5 Volts monitor |  |
| +5 Volts monitor |  |
| _ROLL_ROT | 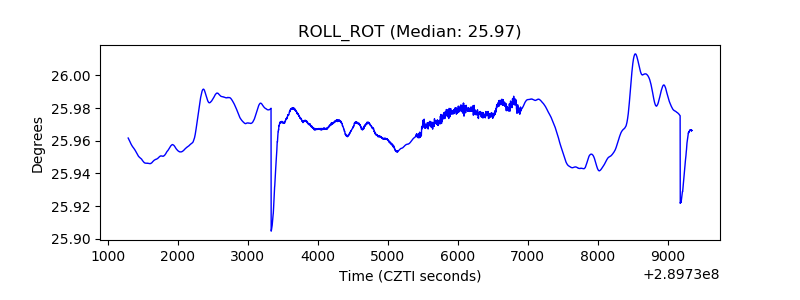 |
| _Roll_DEC | 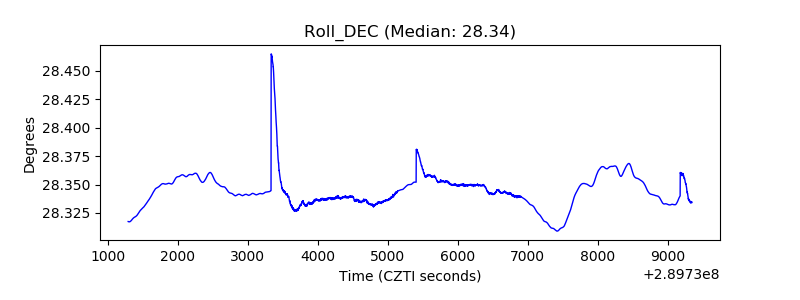 |
| _Roll_RA | 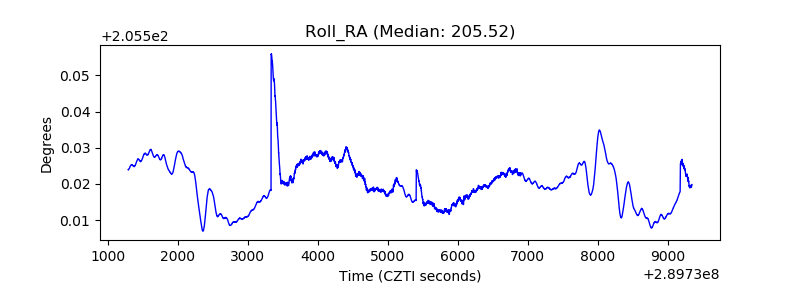 |
| Veto Counter | 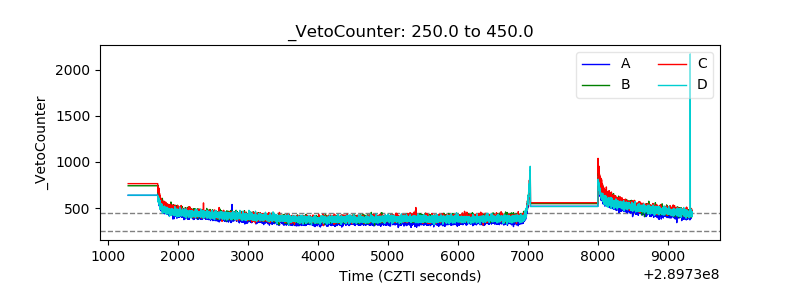 |