| Param | Original file | Final file |
|---|---|---|
| Filename | modeM0/AS1A05_083T01_9000002772_18612cztM0_level2.evt | modeM0/AS1A05_083T01_9000002772_18612cztM0_level2_quad_clean.evt |
| Size (bytes) | 486,201,600 | 71,688,960 |
| Size | 463.7 MB | 68.4 MB |
| Events in quadrant A | 3,454,517 | 433,865 |
| Events in quadrant B | 3,417,948 | 443,426 |
| Events in quadrant C | 3,510,203 | 430,686 |
| Events in quadrant D | 3,912,897 | 421,493 |
| Mode M9 | |||
|---|---|---|---|
| Quadrant | BADHDUFLAG | Total packets | Discarded packets |
| A | 0 | 18 | 0 |
| B | 0 | 19 | 0 |
| C | 0 | 19 | 0 |
| D | 0 | 19 | 0 |
| Mode M0 | |||
|---|---|---|---|
| Quadrant | BADHDUFLAG | Total packets | Discarded packets |
| A | 0 | 14499 | 2 |
| B | 0 | 14279 | 2 |
| C | 0 | 14624 | 2 |
| D | 0 | 15877 | 2 |
| Mode SS | |||
|---|---|---|---|
| Quadrant | BADHDUFLAG | Total packets | Discarded packets |
| A | 0 | 128 | 0 |
| B | 0 | 128 | 0 |
| C | 0 | 128 | 0 |
| D | 0 | 128 | 0 |
| Quadrant | Total seconds | Saturated seconds | Saturation percentage |
|---|---|---|---|
| A | 6325 | 59 | 0.932806% |
| B | 6325 | 70 | 1.106719% |
| C | 6325 | 112 | 1.770751% |
| D | 6324 | 155 | 2.450980% |
Noise dominated data is calculated using 1-second bins in cleaned event files. If a bin has >2000 counts, and if more than 50% of those come from <1% of pixels, then it is considered to be noise-dominated and hence unusable.
| Quadrant | # 1 sec bins | Bins with >0 counts | Bins with >2000 counts | High rate bins dominated by noise | Noise dominated (total time) | Noise dominated (detector-on time) | Marked lightcurve |
|---|---|---|---|---|---|---|---|
| A | 7570 | 6325 | 3 | 3 | 0.04% | 0.05% | 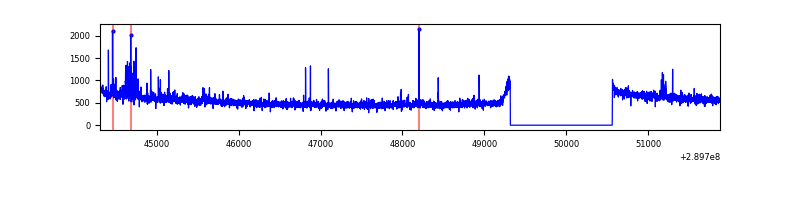 |
| B | 7570 | 6325 | 1 | 1 | 0.01% | 0.02% | 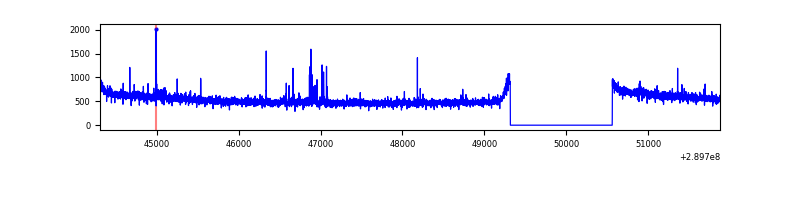 |
| C | 7570 | 6325 | 4 | 4 | 0.05% | 0.06% | 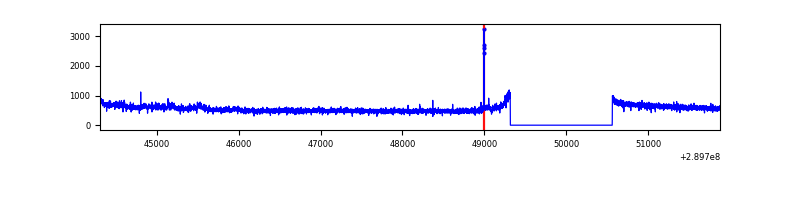 |
| D | 7569 | 6324 | 92 | 92 | 1.22% | 1.45% | 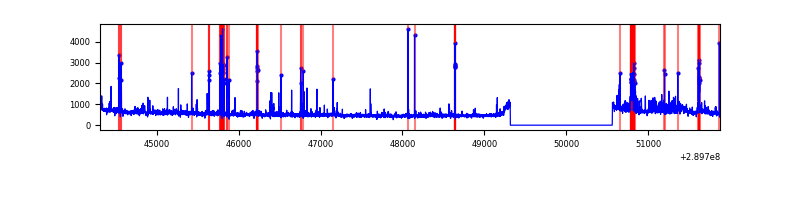 |
Top three noisy pixels from each quadrant. If the there are fewer than three noisy pixels in the level2.evt file, extra rows are filled as -1
| Pixel properties | Quadrant properties | ||||||
|---|---|---|---|---|---|---|---|
| Quadrant | DetID | PixID | Counts | Sigma | Mean | Median | Sigma |
| A | 0 | 13 | 84978 | 489.1 | 865 | 848 | 172.0 |
| A | 9 | 143 | 20531 | 114.43 | 865 | 848 | 172.0 |
| A | 14 | 111 | 12037 | 65.05 | 865 | 848 | 172.0 |
| B | 12 | 111 | 18694 | 109.71 | 865 | 846 | 162.7 |
| B | 11 | 111 | 16445 | 95.89 | 865 | 846 | 162.7 |
| B | 0 | 189 | 15502 | 90.09 | 865 | 846 | 162.7 |
| C | 14 | 238 | 134142 | 686.67 | 840 | 847 | 194.1 |
| C | 3 | 233 | 88365 | 450.85 | 840 | 847 | 194.1 |
| C | 9 | 54 | 12547 | 60.27 | 840 | 847 | 194.1 |
| D | 5 | 222 | 290196 | 1408.36 | 846 | 823 | 205.5 |
| D | 1 | 52 | 235385 | 1141.6 | 846 | 823 | 205.5 |
| D | 7 | 238 | 77365 | 372.52 | 846 | 823 | 205.5 |
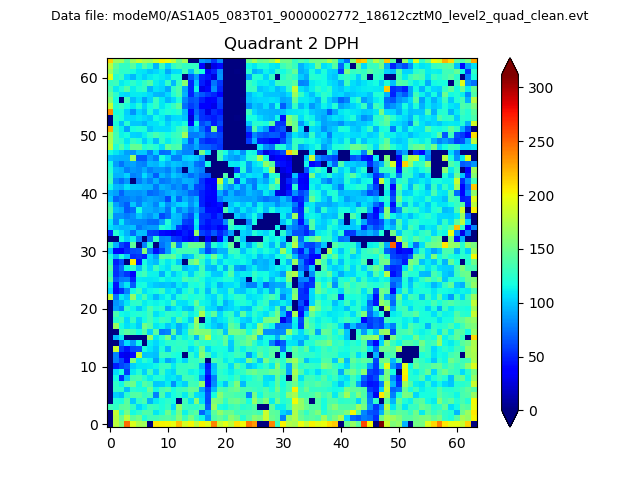
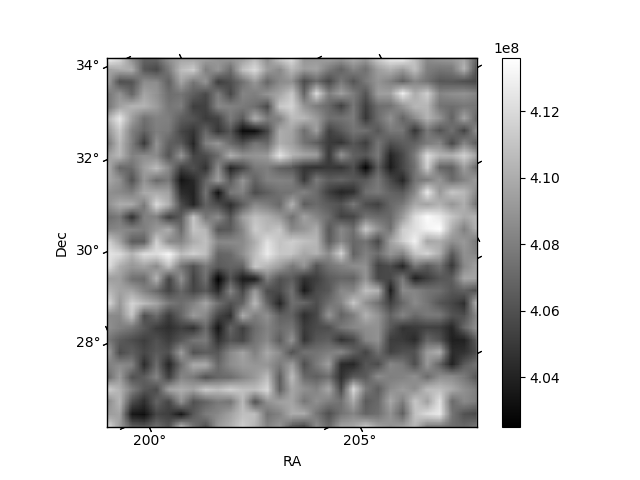
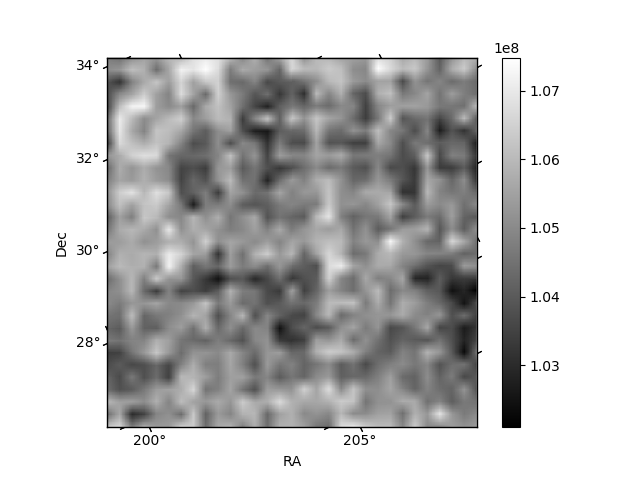
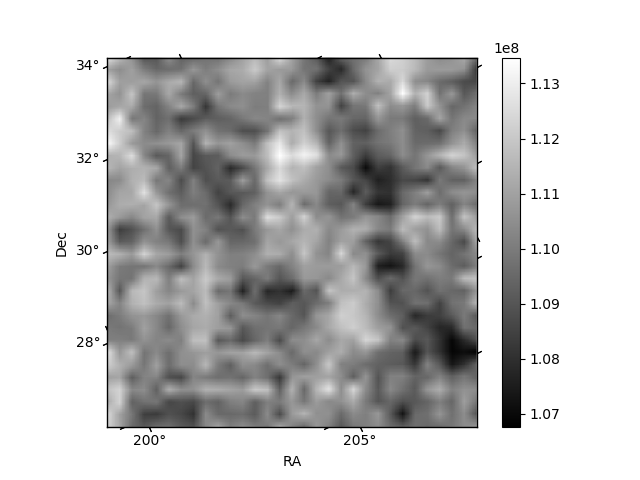
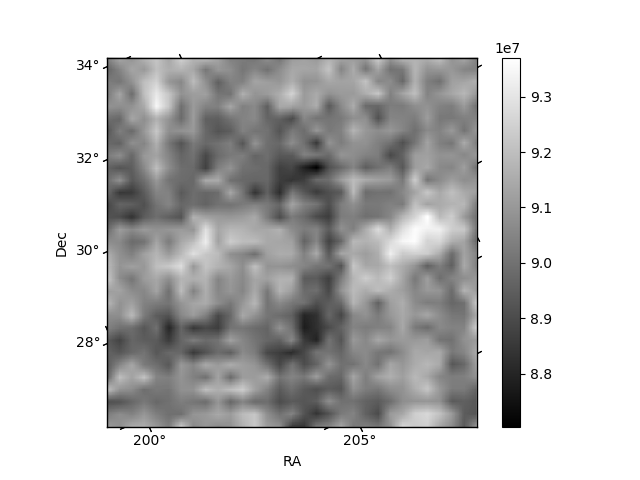
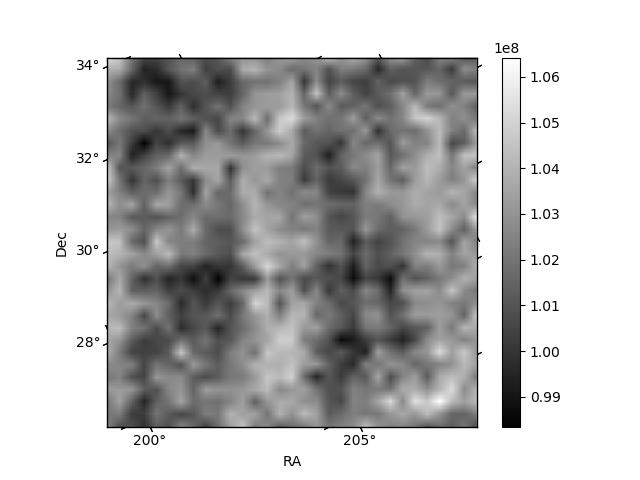
Histogram calculated using DETX and DETY for each event in the final _common_clean file
| Quadrant A | 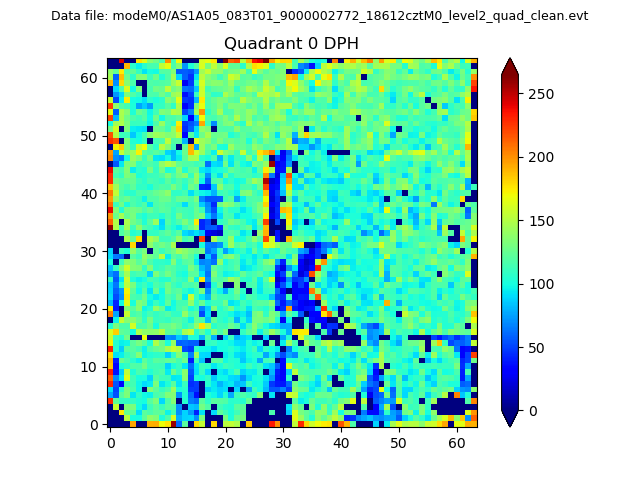 |
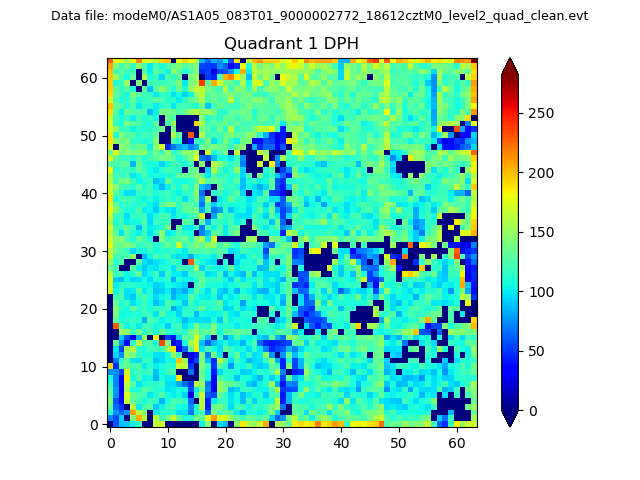 |
Quadrant B |
|---|---|---|---|
| Quadrant D | 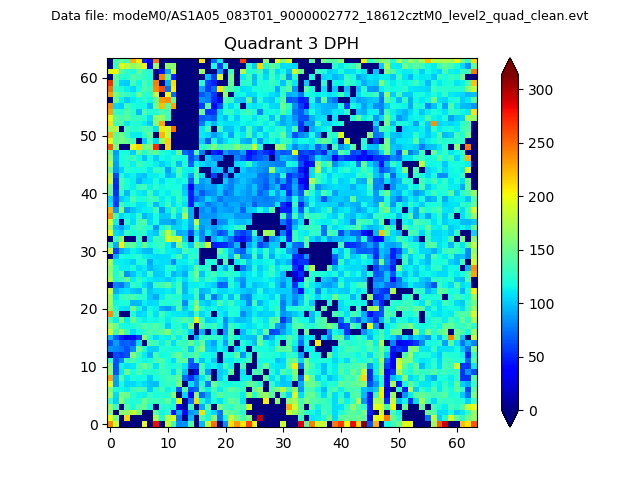 |
 |
Quadrant C |
| Plot type | Count rate plots | Images |
|---|---|---|
| Comparison with Poisson distribution Blue bars denote a histogram of data divided into 1 sec bins. Red curve is a Poisson curve with rate = median count rate of data. |
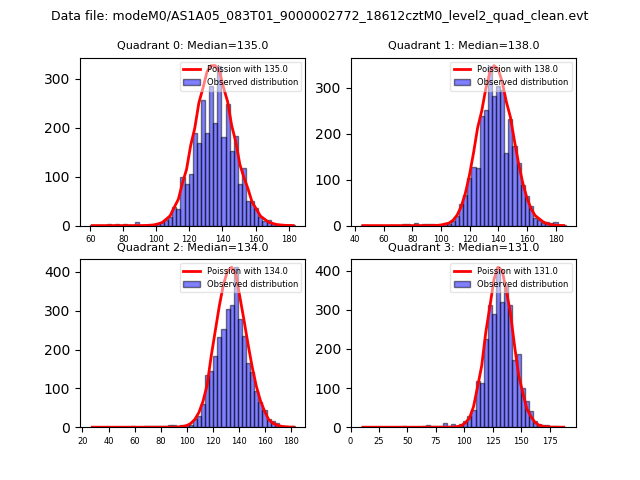 |
 |
| Quadrant-wise count rates Data is divided into 100 sec bins |
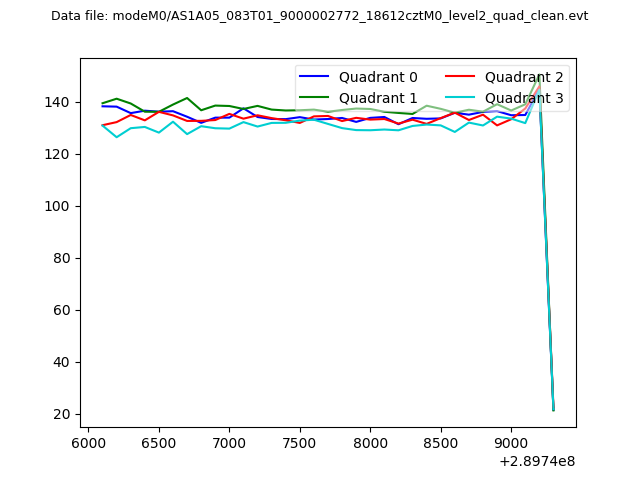 |
|
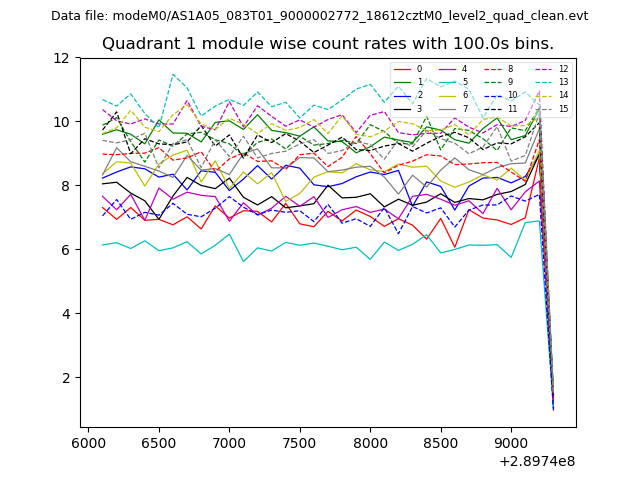
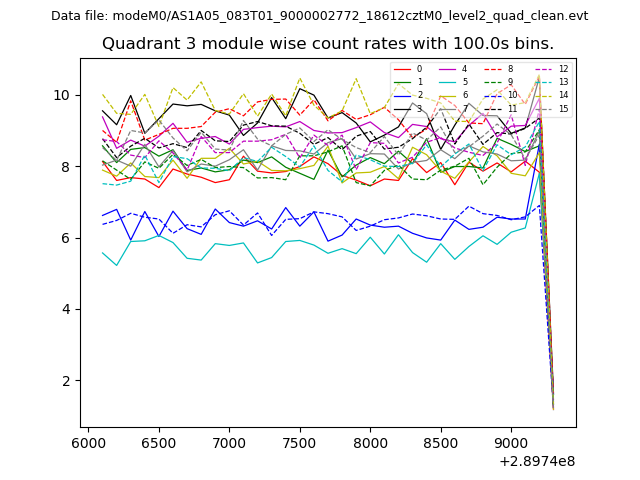
| Module-wise count rates for Quadrant A Data is divided into 100 sec bins |
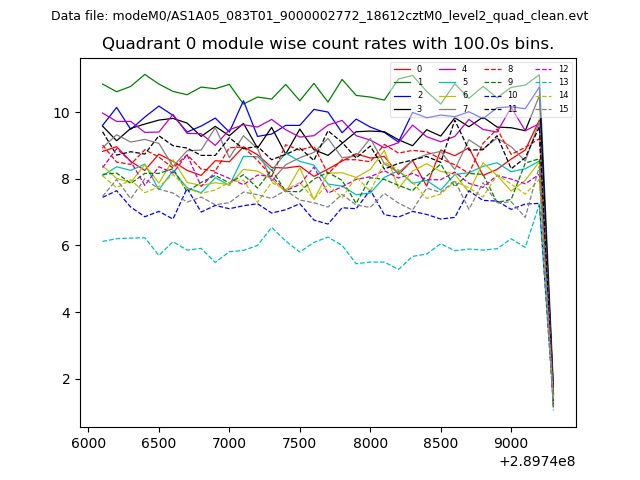 |
 |
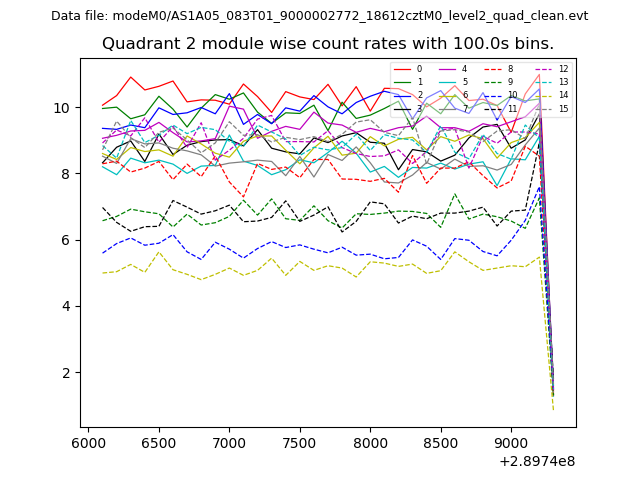
| Module-wise count rates for Quadrant B Data is divided into 100 sec bins |
 |
 |
| Module-wise count rates for Quadrant C Data is divided into 100 sec bins |
 |
 |
| Module-wise count rates for Quadrant D Data is divided into 100 sec bins |
 |
 |
| Parameter | Plot |
|---|---|
| CZT HV Monitor | 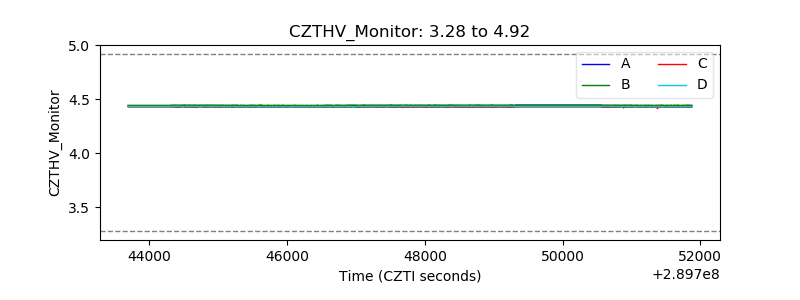 |
| D_VDD | 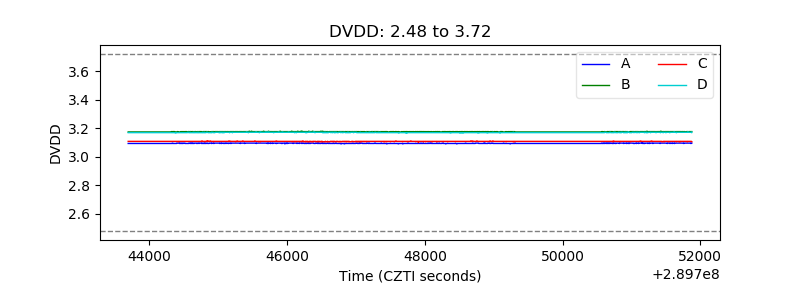 |
| Temperature 1 | 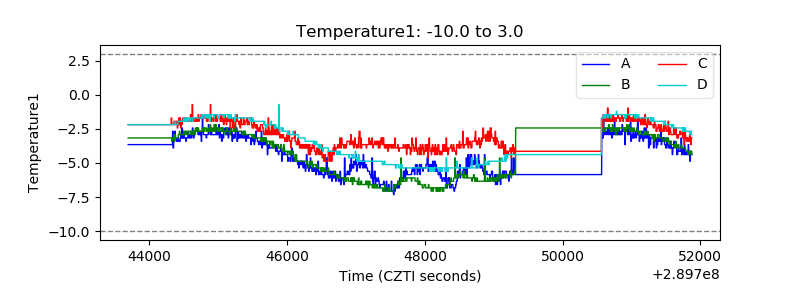 |
| Veto HV Monitor | 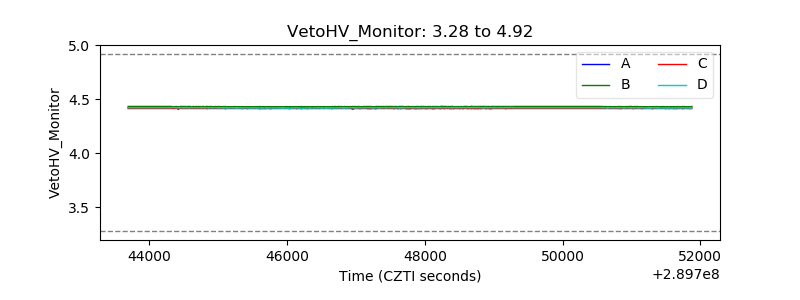 |
| Veto LLD | 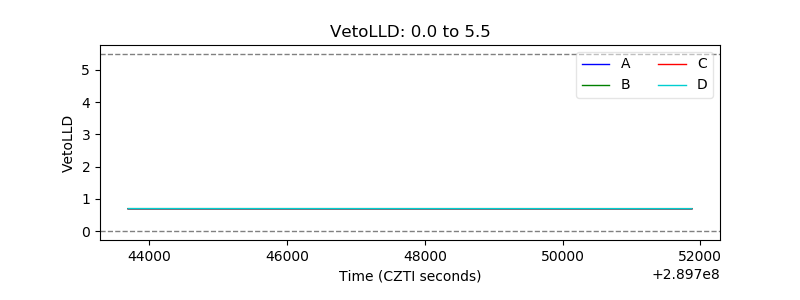 |
| Alpha Counter | 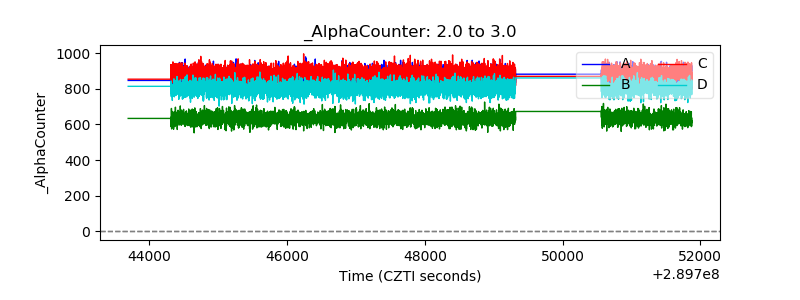 |
| _CPM_Rate | 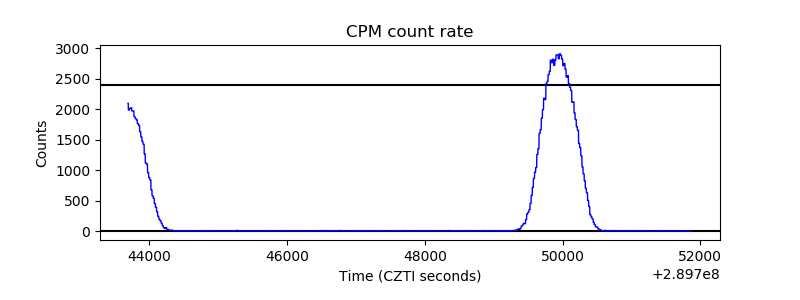 |
| CZT Counter | 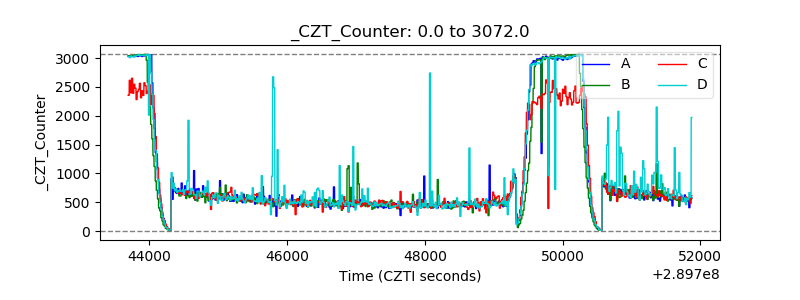 |
| +2.5 Volts monitor |  |
| +5 Volts monitor |  |
| _ROLL_ROT | 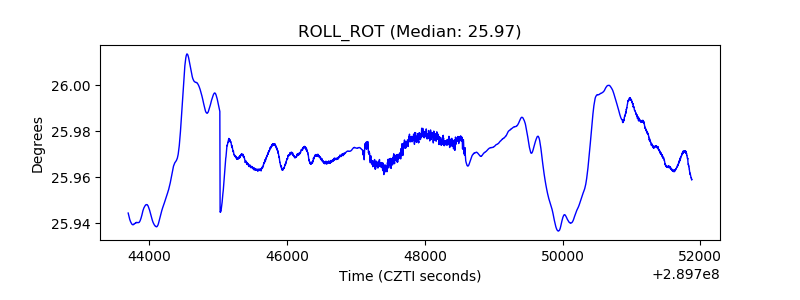 |
| _Roll_DEC | 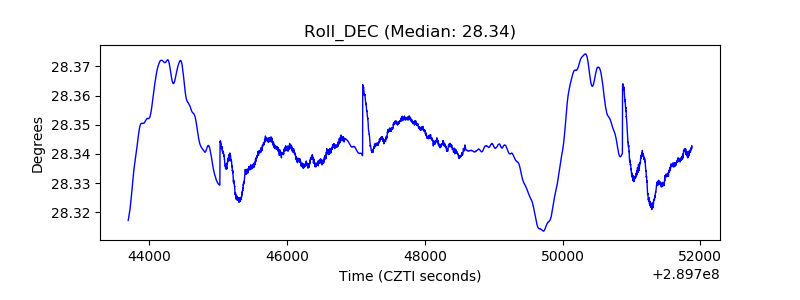 |
| _Roll_RA | 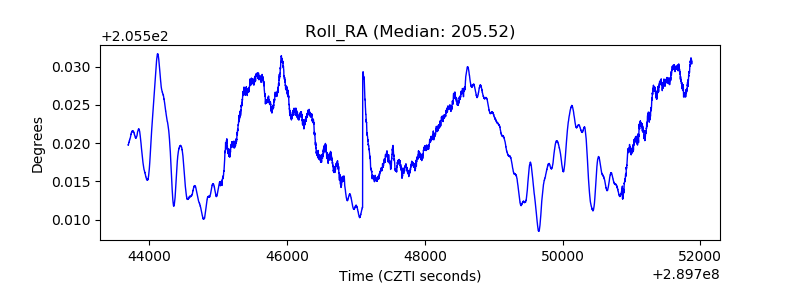 |
| Veto Counter | 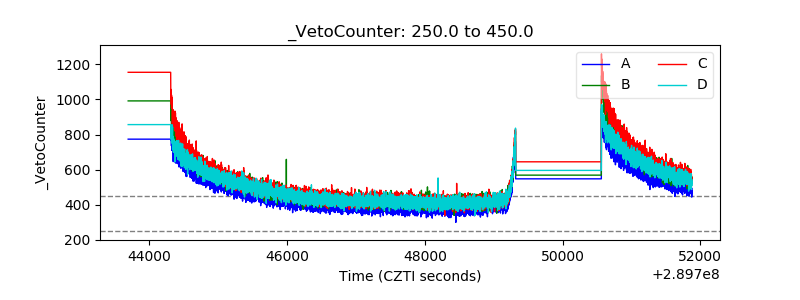 |