| Param | Original file | Final file |
|---|---|---|
| Filename | modeM0/AS1A05_083T01_9000002772_18613cztM0_level2.evt | modeM0/AS1A05_083T01_9000002772_18613cztM0_level2_quad_clean.evt |
| Size (bytes) | 191,583,360 | 22,947,840 |
| Size | 182.7 MB | 21.9 MB |
| Events in quadrant A | 1,346,544 | 133,667 |
| Events in quadrant B | 1,344,979 | 136,338 |
| Events in quadrant C | 1,361,051 | 131,462 |
| Events in quadrant D | 1,591,897 | 127,430 |
| Mode M9 | |||
|---|---|---|---|
| Quadrant | BADHDUFLAG | Total packets | Discarded packets |
| A | 0 | 12 | 0 |
| B | 0 | 12 | 0 |
| C | 0 | 12 | 0 |
| D | 0 | 12 | 0 |
| Mode M0 | |||
|---|---|---|---|
| Quadrant | BADHDUFLAG | Total packets | Discarded packets |
| A | 0 | 5517 | 1 |
| B | 0 | 5490 | 1 |
| C | 0 | 5572 | 1 |
| D | 0 | 6305 | 1 |
| Mode SS | |||
|---|---|---|---|
| Quadrant | BADHDUFLAG | Total packets | Discarded packets |
| A | 0 | 50 | 0 |
| B | 0 | 50 | 0 |
| C | 0 | 50 | 0 |
| D | 0 | 50 | 0 |
| Quadrant | Total seconds | Saturated seconds | Saturation percentage |
|---|---|---|---|
| A | 2282 | 38 | 1.665206% |
| B | 2283 | 52 | 2.277705% |
| C | 2283 | 77 | 3.372755% |
| D | 2283 | 84 | 3.679369% |
Noise dominated data is calculated using 1-second bins in cleaned event files. If a bin has >2000 counts, and if more than 50% of those come from <1% of pixels, then it is considered to be noise-dominated and hence unusable.
| Quadrant | # 1 sec bins | Bins with >0 counts | Bins with >2000 counts | High rate bins dominated by noise | Noise dominated (total time) | Noise dominated (detector-on time) | Marked lightcurve |
|---|---|---|---|---|---|---|---|
| A | 3527 | 2282 | 0 | 0 | 0.00% | 0.00% | 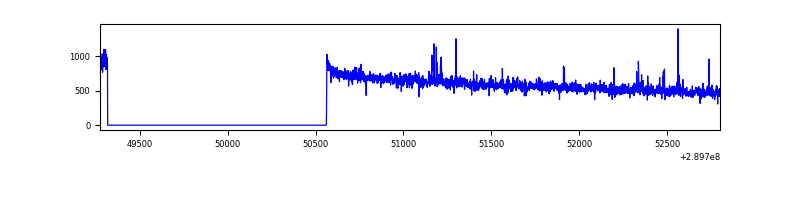 |
| B | 3528 | 2283 | 0 | 0 | 0.00% | 0.00% | 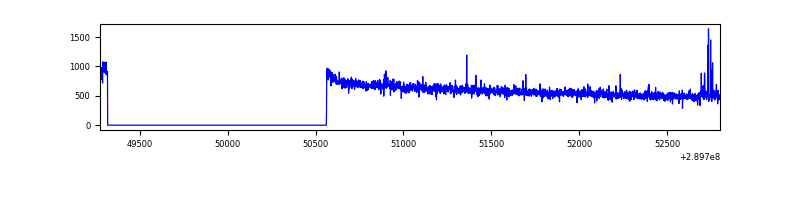 |
| C | 3528 | 2283 | 0 | 0 | 0.00% | 0.00% | 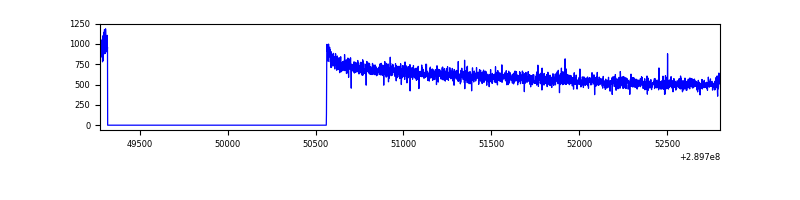 |
| D | 3528 | 2283 | 35 | 35 | 0.99% | 1.53% | 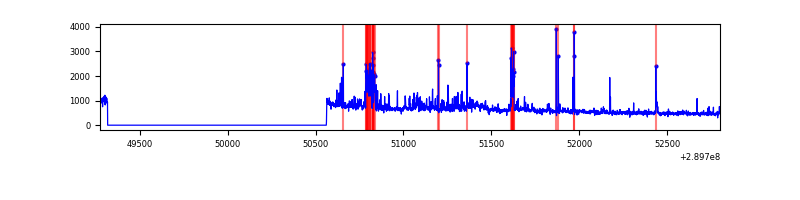 |
Top three noisy pixels from each quadrant. If the there are fewer than three noisy pixels in the level2.evt file, extra rows are filled as -1
| Pixel properties | Quadrant properties | ||||||
|---|---|---|---|---|---|---|---|
| Quadrant | DetID | PixID | Counts | Sigma | Mean | Median | Sigma |
| A | 0 | 13 | 26386 | 372.7 | 342 | 336 | 69.9 |
| A | 13 | 254 | 4113 | 54.04 | 342 | 336 | 69.9 |
| A | 0 | 226 | 2925 | 37.04 | 342 | 336 | 69.9 |
| B | 0 | 189 | 10046 | 149.62 | 341 | 334 | 64.9 |
| B | 12 | 111 | 7090 | 104.08 | 341 | 334 | 64.9 |
| B | 11 | 111 | 6214 | 90.58 | 341 | 334 | 64.9 |
| C | 14 | 238 | 53108 | 680.19 | 334 | 337 | 77.6 |
| C | 3 | 233 | 3998 | 47.19 | 334 | 337 | 77.6 |
| C | 13 | 61 | 2384 | 26.38 | 334 | 337 | 77.6 |
| D | 5 | 222 | 184288 | 2258.24 | 336 | 326 | 81.5 |
| D | 7 | 238 | 61520 | 751.19 | 336 | 326 | 81.5 |
| D | 7 | 96 | 33312 | 404.92 | 336 | 326 | 81.5 |
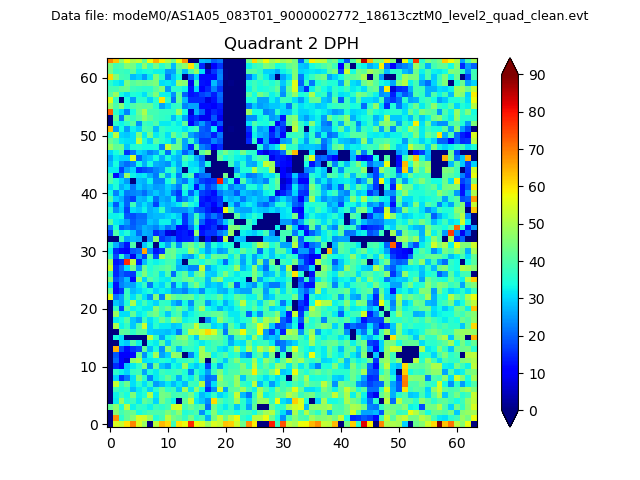
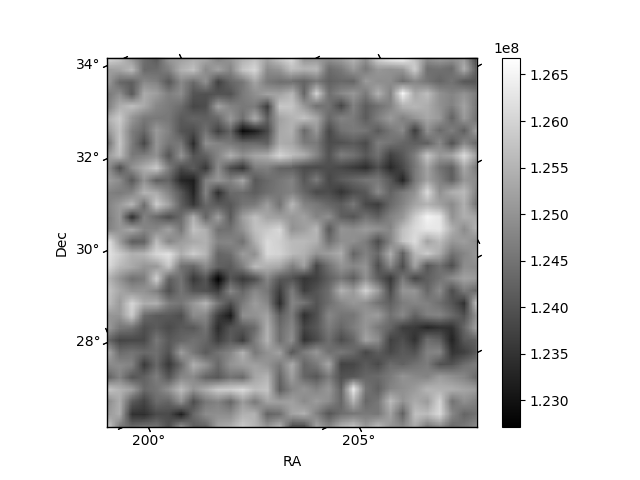
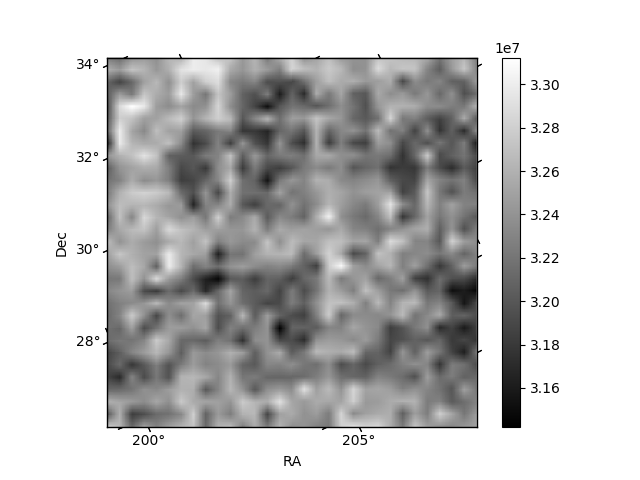
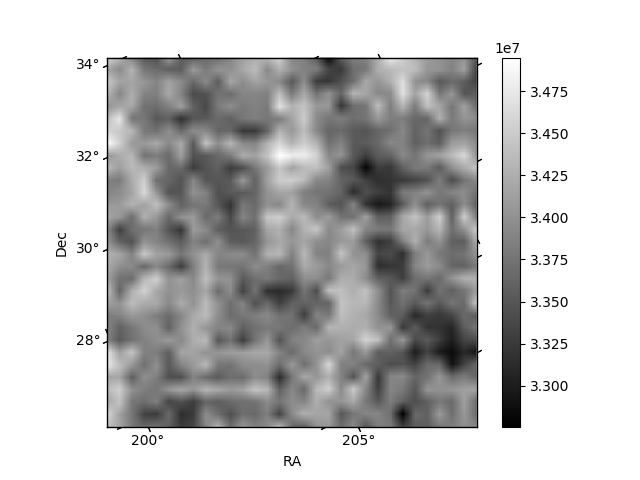
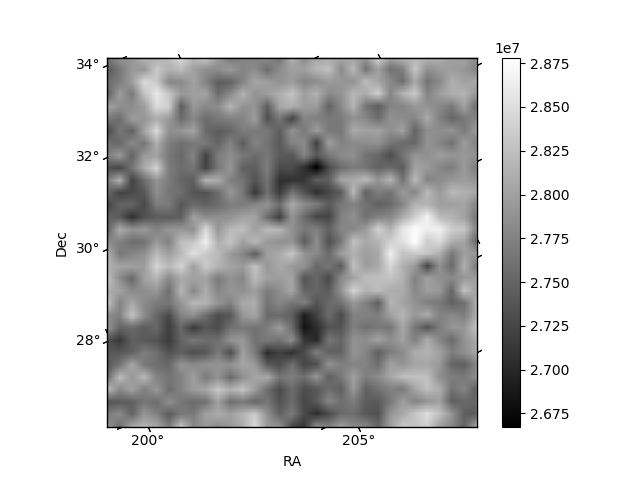
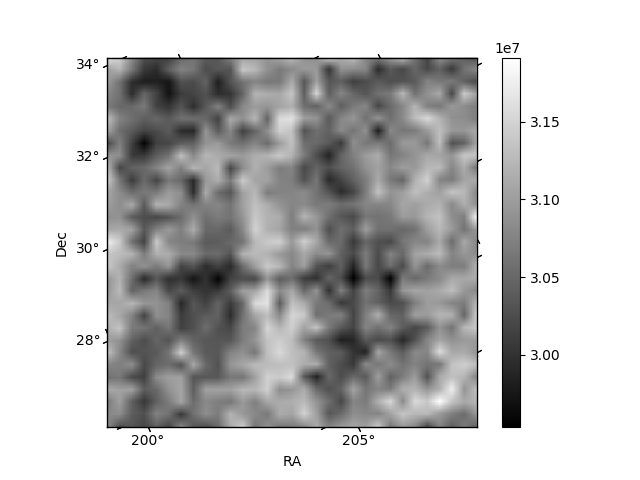
Histogram calculated using DETX and DETY for each event in the final _common_clean file
| Quadrant A | 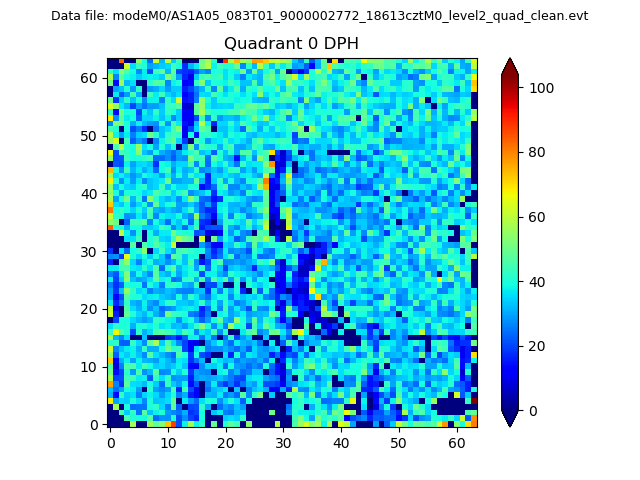 |
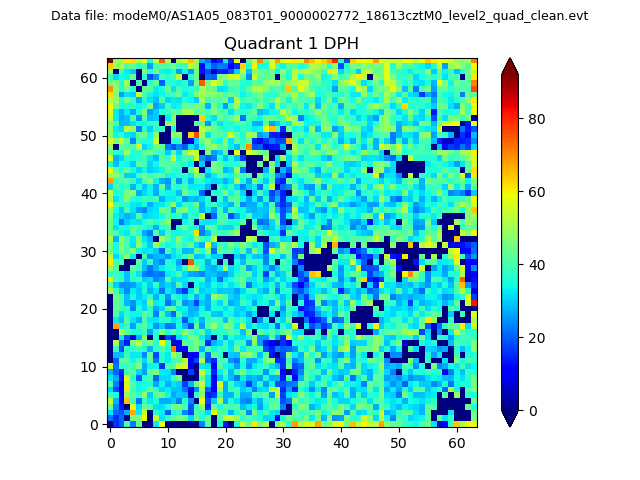 |
Quadrant B |
|---|---|---|---|
| Quadrant D | 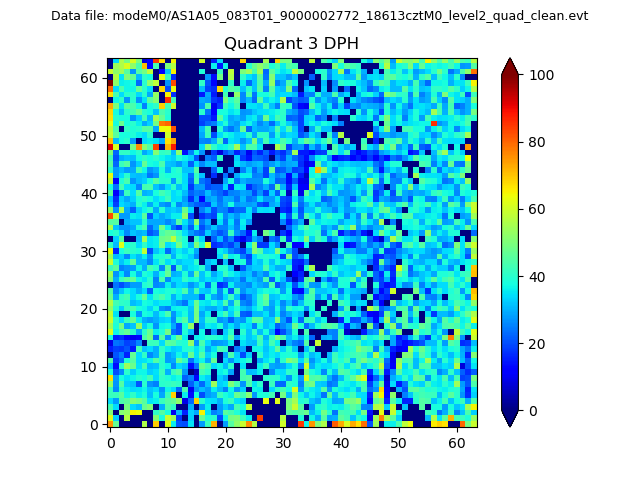 |
 |
Quadrant C |
| Plot type | Count rate plots | Images |
|---|---|---|
| Comparison with Poisson distribution Blue bars denote a histogram of data divided into 1 sec bins. Red curve is a Poisson curve with rate = median count rate of data. |
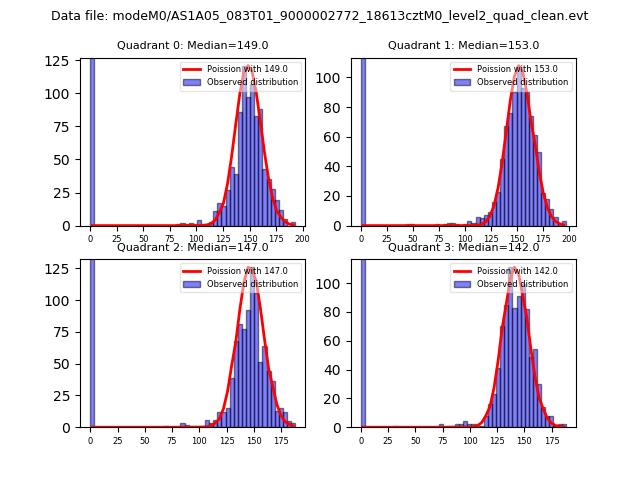 |
 |
| Quadrant-wise count rates Data is divided into 100 sec bins |
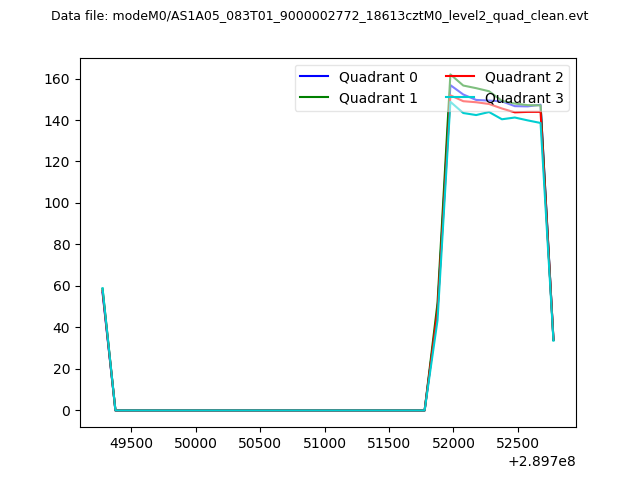 |
|
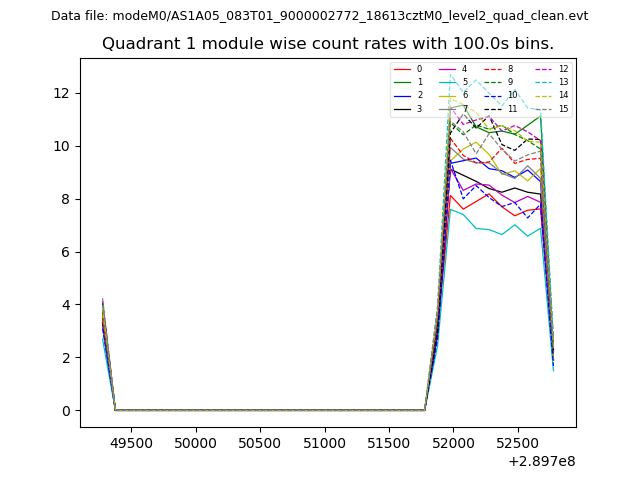
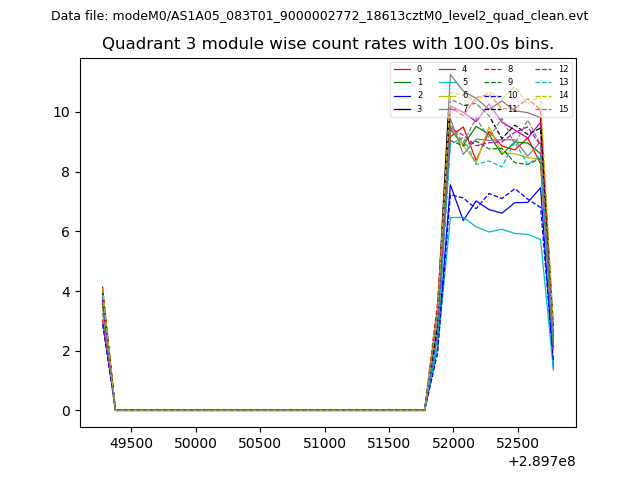
| Module-wise count rates for Quadrant A Data is divided into 100 sec bins |
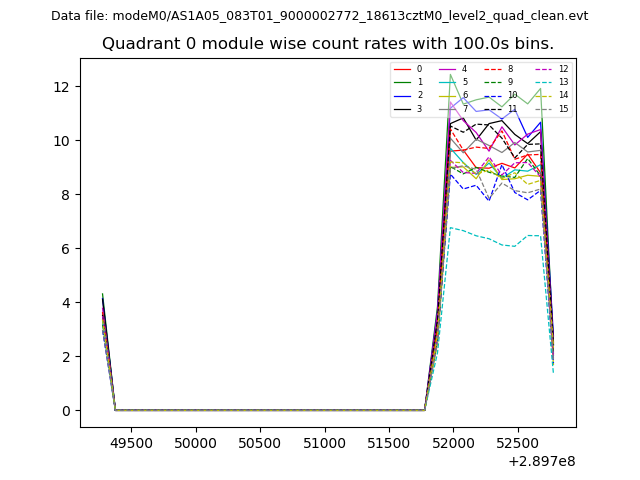 |
 |
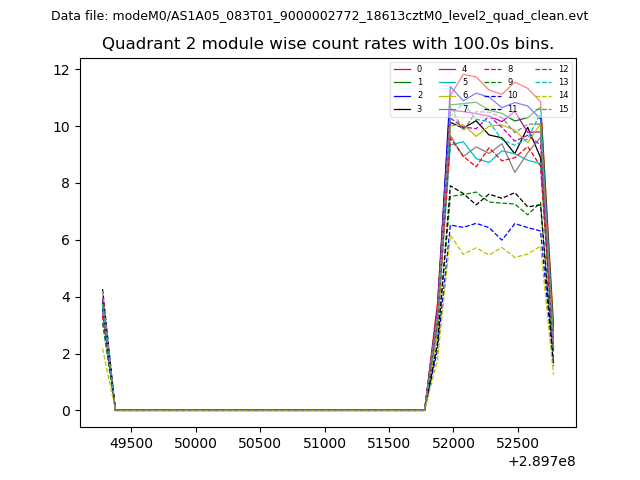
| Module-wise count rates for Quadrant B Data is divided into 100 sec bins |
 |
 |
| Module-wise count rates for Quadrant C Data is divided into 100 sec bins |
 |
 |
| Module-wise count rates for Quadrant D Data is divided into 100 sec bins |
 |
 |
| Parameter | Plot |
|---|---|
| CZT HV Monitor | 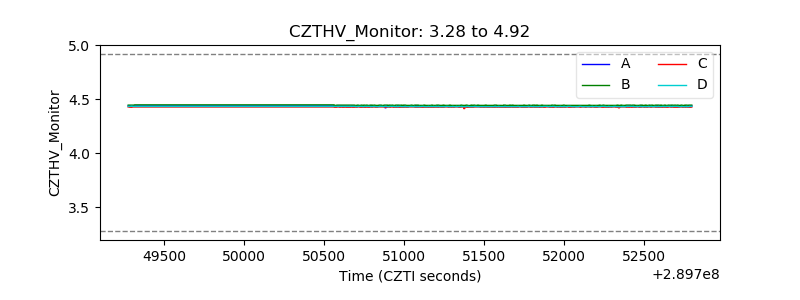 |
| D_VDD | 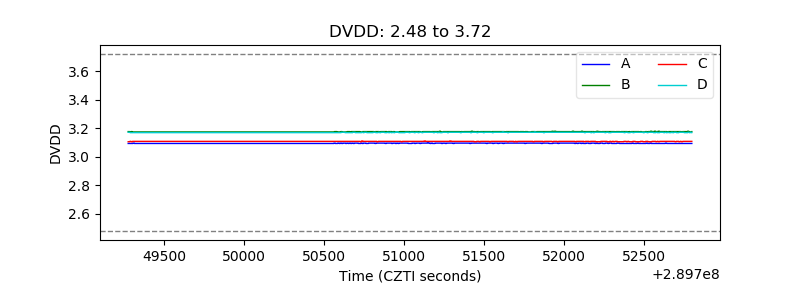 |
| Temperature 1 | 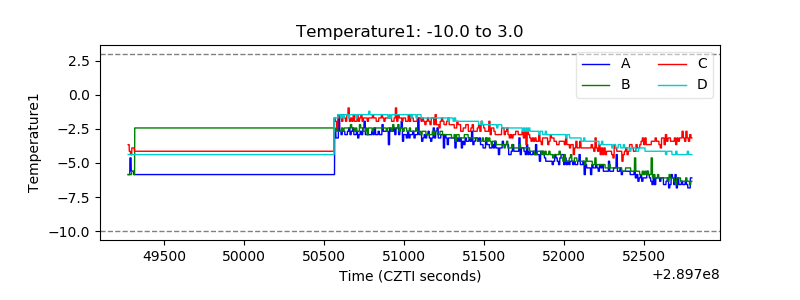 |
| Veto HV Monitor | 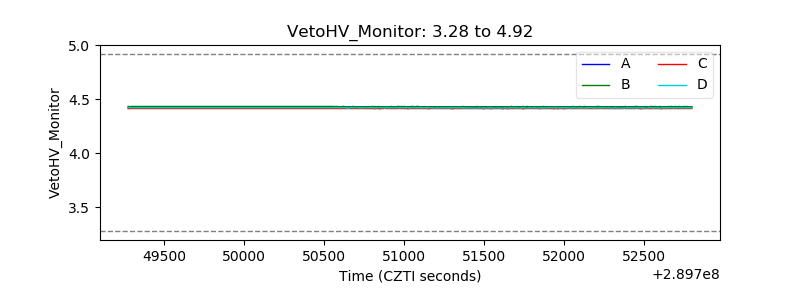 |
| Veto LLD | 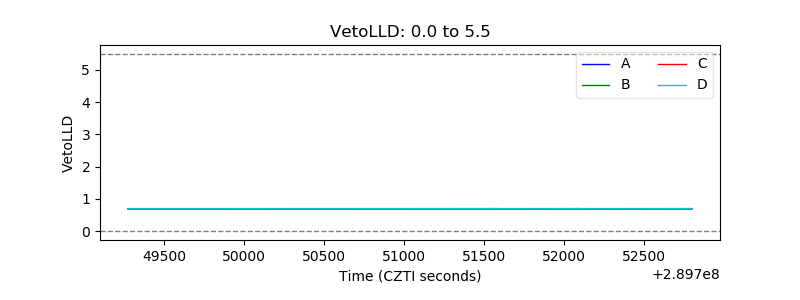 |
| Alpha Counter | 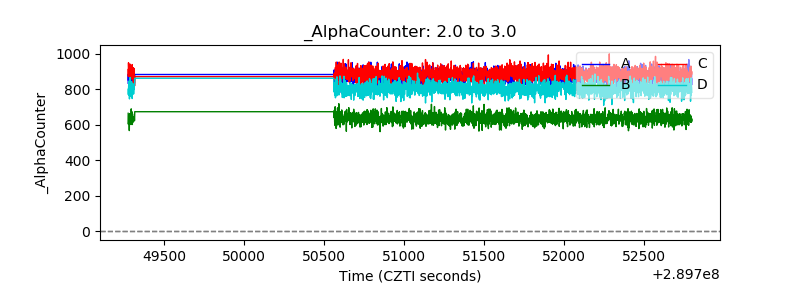 |
| _CPM_Rate | 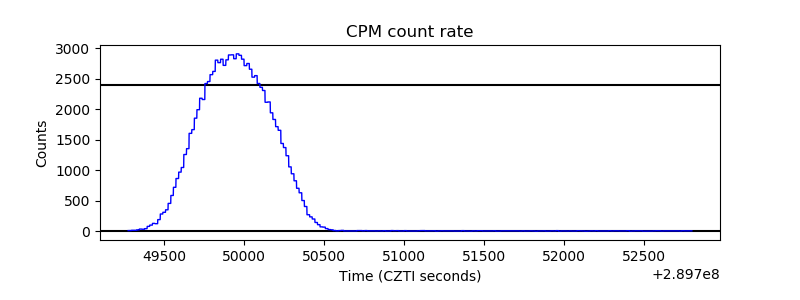 |
| CZT Counter | 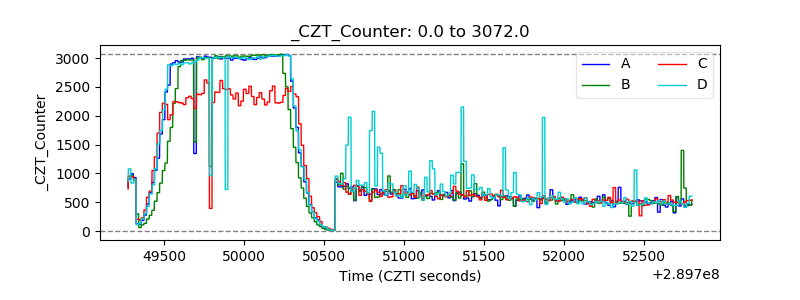 |
| +2.5 Volts monitor | 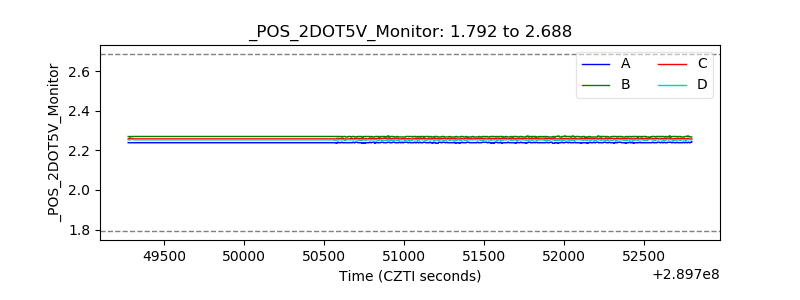 |
| +5 Volts monitor |  |
| _ROLL_ROT | 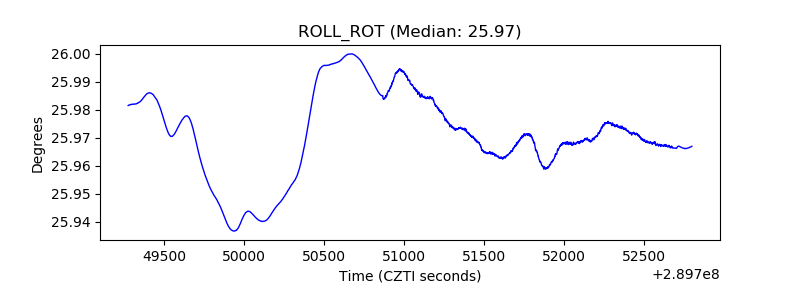 |
| _Roll_DEC | 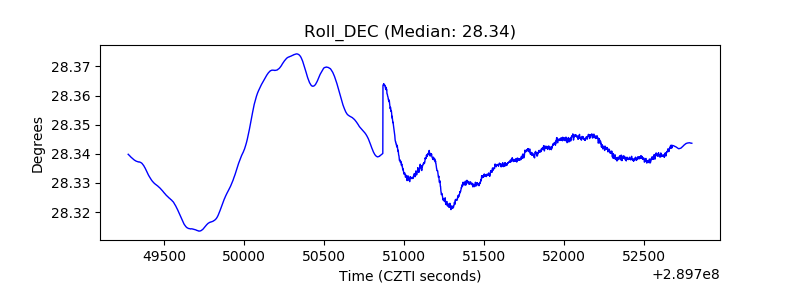 |
| _Roll_RA | 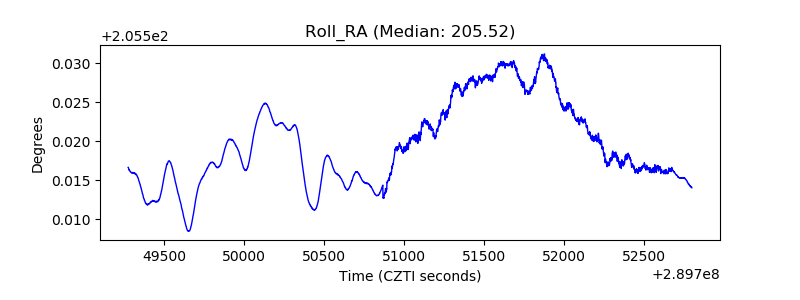 |
| Veto Counter | 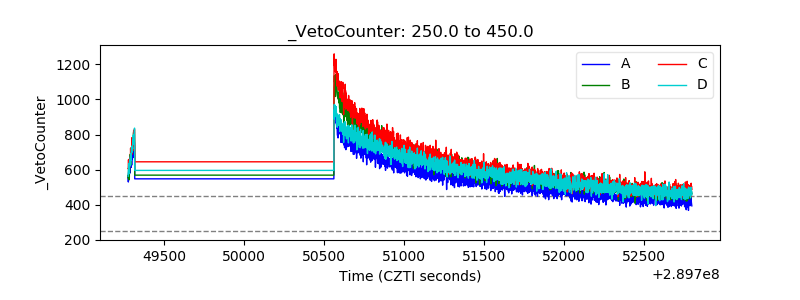 |