| Param | Original file | Final file |
|---|---|---|
| Filename | modeM0/AS1A05_176T03_9000002778cztM0_level2.fits | modeM0/AS1A05_176T03_9000002778cztM0_level2_quad_clean.evt |
| Size (bytes) | 118,987,200 | 99,552,960 |
| Size | 113.5 MB | 94.9 MB |
| Events in quadrant A | 720,480 | 551,069 |
| Events in quadrant B | 697,024 | 566,164 |
| Events in quadrant C | 710,810 | 541,650 |
| Events in quadrant D | 622,264 | 502,080 |
| Mode M9 | |||
|---|---|---|---|
| Quadrant | BADHDUFLAG | Total packets | Discarded packets |
| A | 0 | 10 | 0 |
| B | 0 | 10 | 0 |
| C | 0 | 10 | 0 |
| D | 0 | 10 | 0 |
| Mode M0 | |||
|---|---|---|---|
| Quadrant | BADHDUFLAG | Total packets | Discarded packets |
| A | 0 | 26193 | 0 |
| B | 0 | 25914 | 0 |
| C | 0 | 26847 | 0 |
| D | 0 | 27083 | 0 |
| Mode SS | |||
|---|---|---|---|
| Quadrant | BADHDUFLAG | Total packets | Discarded packets |
| A | 0 | 250 | 0 |
| B | 0 | 250 | 0 |
| C | 0 | 250 | 0 |
| D | 0 | 250 | 0 |
| Quadrant | Total seconds | Saturated seconds | Saturation percentage |
|---|---|---|---|
| A | 12343 | 147 | 1.190958% |
| B | 12343 | 178 | 1.442113% |
| C | 12343 | 323 | 2.616868% |
| D | 12343 | 130 | 1.053229% |
Noise dominated data is calculated using 1-second bins in cleaned event files. If a bin has >2000 counts, and if more than 50% of those come from <1% of pixels, then it is considered to be noise-dominated and hence unusable.
| Quadrant | # 1 sec bins | Bins with >0 counts | Bins with >2000 counts | High rate bins dominated by noise | Noise dominated (total time) | Noise dominated (detector-on time) | Marked lightcurve |
|---|---|---|---|---|---|---|---|
| A | 13318 | 12343 | 0 | 0 | 0.00% | 0.00% |  |
| B | 13318 | 12343 | 0 | 0 | 0.00% | 0.00% |  |
| C | 13318 | 12337 | 0 | 0 | 0.00% | 0.00% |  |
| D | 13318 | 12342 | 0 | 0 | 0.00% | 0.00% |  |
Top three noisy pixels from each quadrant. If the there are fewer than three noisy pixels in the level2.evt file, extra rows are filled as -1
| Pixel properties | Quadrant properties | ||||||
|---|---|---|---|---|---|---|---|
| Quadrant | DetID | PixID | Counts | Sigma | Mean | Median | Sigma |
| A | 0 | 29 | 625 | 9.26 | 187 | 175 | 48.6 |
| A | 7 | 110 | 561 | 7.94 | 187 | 175 | 48.6 |
| A | 0 | 30 | 543 | 7.57 | 187 | 175 | 48.6 |
| B | 2 | 9 | 583 | 10.24 | 183 | 174 | 39.9 |
| B | 2 | 8 | 504 | 8.26 | 183 | 174 | 39.9 |
| B | 3 | 17 | 495 | 8.03 | 183 | 174 | 39.9 |
| C | 1 | 81 | 527 | 7.01 | 187 | 175 | 50.2 |
| C | 12 | 241 | 525 | 6.97 | 187 | 175 | 50.2 |
| C | 1 | 80 | 522 | 6.91 | 187 | 175 | 50.2 |
| D | 10 | 190 | 509 | 7.03 | 177 | 161 | 49.5 |
| D | 7 | 3 | 479 | 6.42 | 177 | 161 | 49.5 |
| D | 3 | 159 | 476 | 6.36 | 177 | 161 | 49.5 |
Histogram calculated using DETX and DETY for each event in the final _common_clean file
| Quadrant A |  |
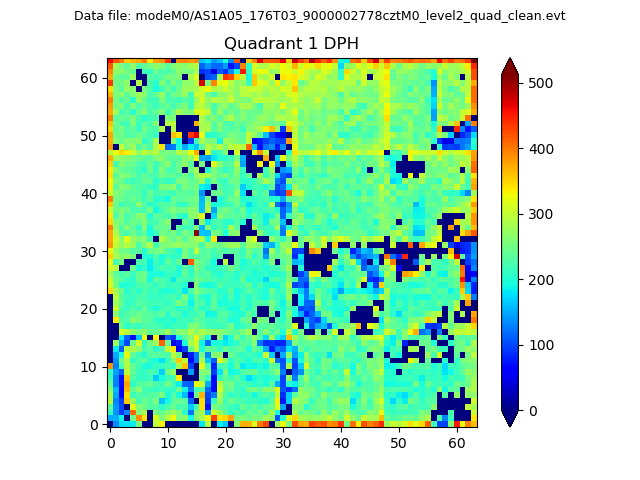 |
Quadrant B |
|---|---|---|---|
| Quadrant D |  |
 |
Quadrant C |
| Plot type | Count rate plots | Images |
|---|---|---|
| Comparison with Poisson distribution Blue bars denote a histogram of data divided into 1 sec bins. Red curve is a Poisson curve with rate = median count rate of data. |
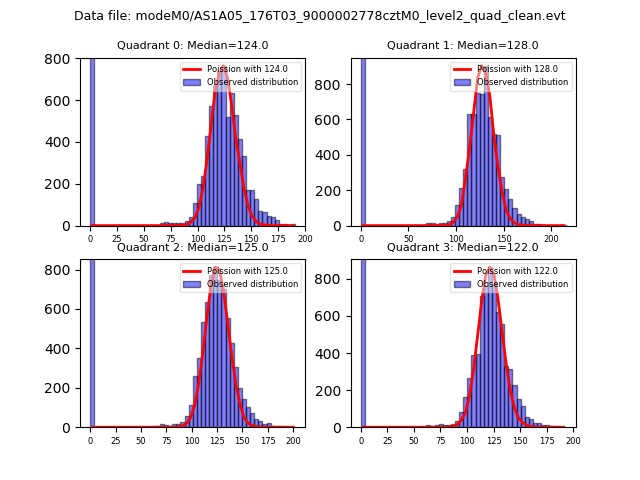 |
 |
| Quadrant-wise count rates Data is divided into 100 sec bins |
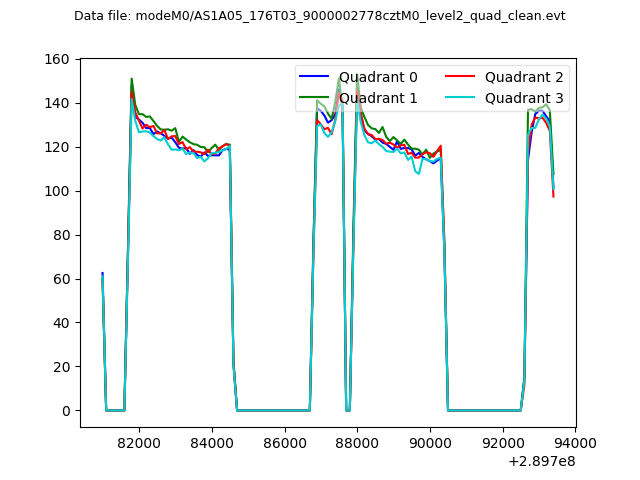 |
|
| Module-wise count rates for Quadrant A Data is divided into 100 sec bins |
 |
 |
| Module-wise count rates for Quadrant B Data is divided into 100 sec bins |
 |
 |
| Module-wise count rates for Quadrant C Data is divided into 100 sec bins |
 |
 |
| Module-wise count rates for Quadrant D Data is divided into 100 sec bins |
 |
 |
| Parameter | Plot |
|---|---|
| CZT HV Monitor |  |
| D_VDD |  |
| Temperature 1 | 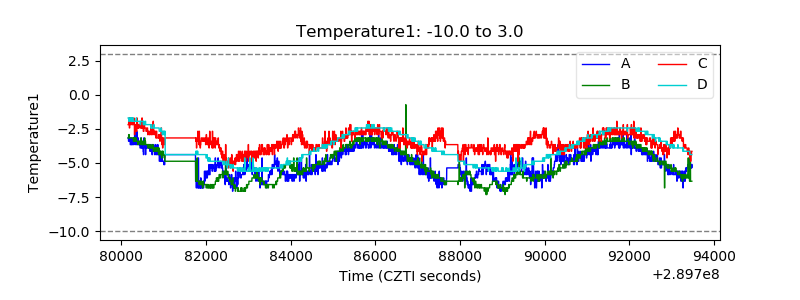 |
| Veto HV Monitor |  |
| Veto LLD |  |
| Alpha Counter |  |
| _CPM_Rate |  |
| CZT Counter |  |
| +2.5 Volts monitor |  |
| +5 Volts monitor |  |
| _ROLL_ROT |  |
| _Roll_DEC |  |
| _Roll_RA | 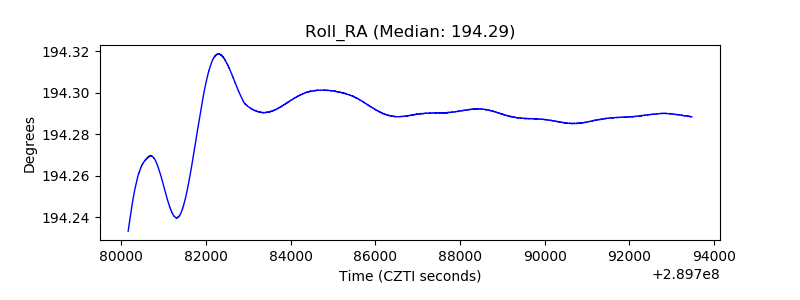 |
| Veto Counter |  |