| Param | Original file | Final file |
|---|---|---|
| Filename | modeM0/AS1A05_176T03_9000002778_18619cztM0_level2.evt | modeM0/AS1A05_176T03_9000002778_18619cztM0_level2_quad_clean.evt |
| Size (bytes) | 374,065,920 | 67,121,280 |
| Size | 356.7 MB | 64.0 MB |
| Events in quadrant A | 2,710,432 | 409,170 |
| Events in quadrant B | 2,584,405 | 423,469 |
| Events in quadrant C | 2,961,110 | 409,709 |
| Events in quadrant D | 2,695,580 | 402,585 |
| Mode M9 | |||
|---|---|---|---|
| Quadrant | BADHDUFLAG | Total packets | Discarded packets |
| A | 0 | 3 | 0 |
| B | 0 | 3 | 0 |
| C | 0 | 3 | 0 |
| D | 0 | 3 | 0 |
| Mode M0 | |||
|---|---|---|---|
| Quadrant | BADHDUFLAG | Total packets | Discarded packets |
| A | 0 | 11826 | 1 |
| B | 0 | 11324 | 1 |
| C | 0 | 12467 | 1 |
| D | 0 | 11842 | 1 |
| Mode SS | |||
|---|---|---|---|
| Quadrant | BADHDUFLAG | Total packets | Discarded packets |
| A | 0 | 112 | 0 |
| B | 0 | 112 | 0 |
| C | 0 | 112 | 0 |
| D | 0 | 112 | 0 |
| Quadrant | Total seconds | Saturated seconds | Saturation percentage |
|---|---|---|---|
| A | 5538 | 57 | 1.029252% |
| B | 5539 | 29 | 0.523560% |
| C | 5539 | 170 | 3.069146% |
| D | 5539 | 36 | 0.649937% |
Noise dominated data is calculated using 1-second bins in cleaned event files. If a bin has >2000 counts, and if more than 50% of those come from <1% of pixels, then it is considered to be noise-dominated and hence unusable.
| Quadrant | # 1 sec bins | Bins with >0 counts | Bins with >2000 counts | High rate bins dominated by noise | Noise dominated (total time) | Noise dominated (detector-on time) | Marked lightcurve |
|---|---|---|---|---|---|---|---|
| A | 5798 | 5539 | 28 | 28 | 0.48% | 0.51% | 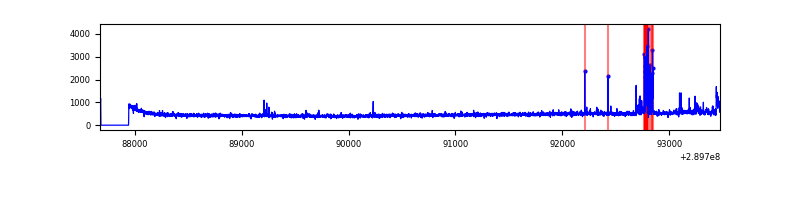 |
| B | 5799 | 5540 | 0 | 0 | 0.00% | 0.00% | 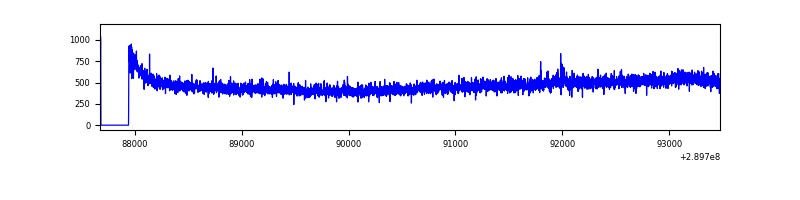 |
| C | 5799 | 5540 | 94 | 94 | 1.62% | 1.70% | 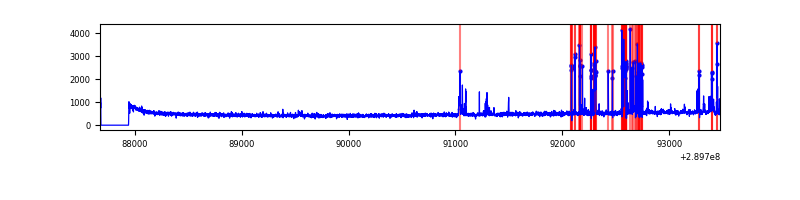 |
| D | 5799 | 5540 | 38 | 38 | 0.66% | 0.69% | 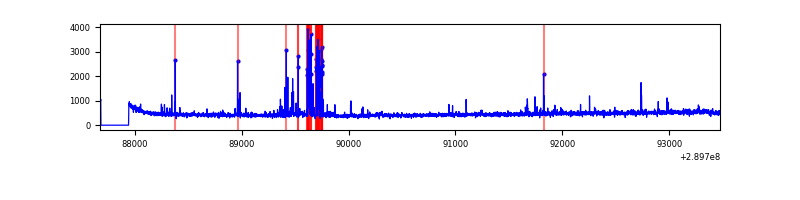 |
Top three noisy pixels from each quadrant. If the there are fewer than three noisy pixels in the level2.evt file, extra rows are filled as -1
| Pixel properties | Quadrant properties | ||||||
|---|---|---|---|---|---|---|---|
| Quadrant | DetID | PixID | Counts | Sigma | Mean | Median | Sigma |
| A | 9 | 143 | 157344 | 1173.95 | 657 | 644 | 133.5 |
| A | 0 | 13 | 15428 | 110.75 | 657 | 644 | 133.5 |
| A | 13 | 254 | 8128 | 56.06 | 657 | 644 | 133.5 |
| B | 12 | 111 | 15723 | 117.27 | 658 | 640 | 128.6 |
| B | 11 | 111 | 13987 | 103.77 | 658 | 640 | 128.6 |
| B | 14 | 111 | 11994 | 88.28 | 658 | 640 | 128.6 |
| C | 9 | 54 | 380714 | 2569.02 | 629 | 634 | 147.9 |
| C | 14 | 238 | 96746 | 649.63 | 629 | 634 | 147.9 |
| C | 3 | 233 | 13521 | 87.11 | 629 | 634 | 147.9 |
| D | 14 | 34 | 183130 | 1163.37 | 642 | 623 | 156.9 |
| D | 1 | 52 | 59725 | 376.74 | 642 | 623 | 156.9 |
| D | 2 | 234 | 22095 | 136.87 | 642 | 623 | 156.9 |
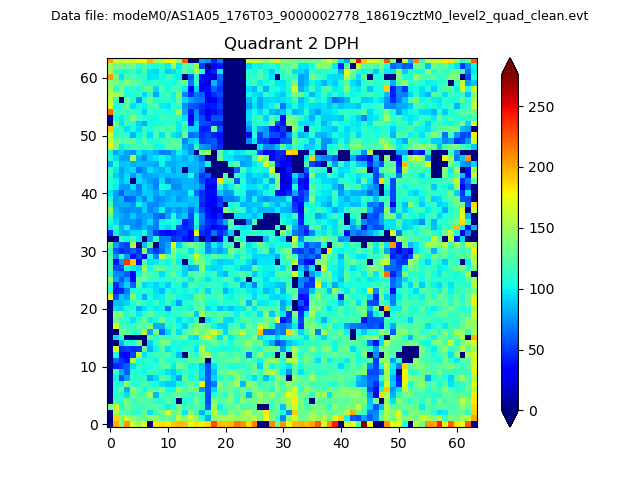
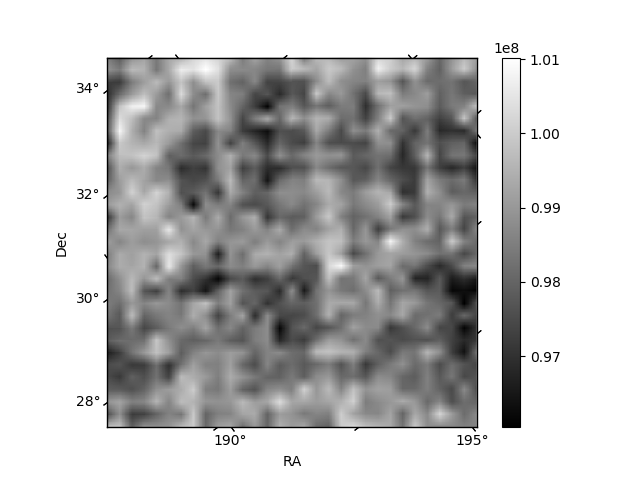
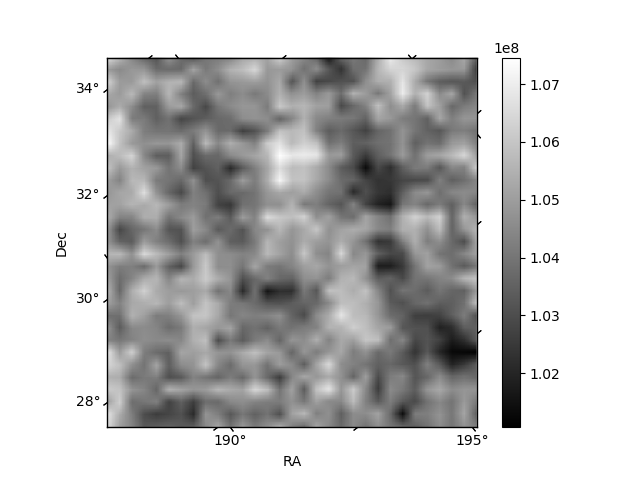
Histogram calculated using DETX and DETY for each event in the final _common_clean file
| Quadrant A | 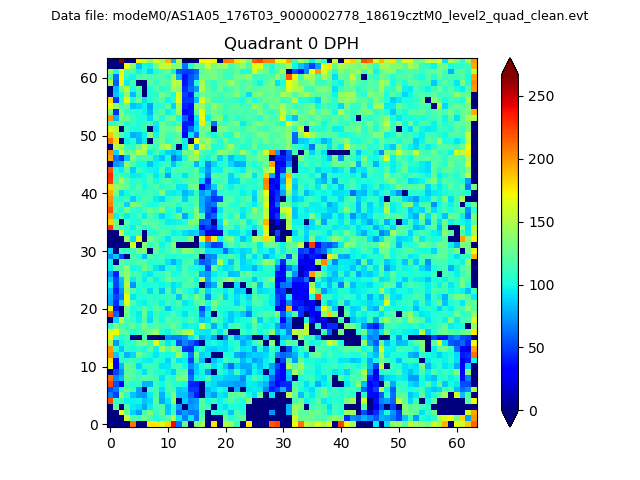 |
 |
Quadrant B |
|---|---|---|---|
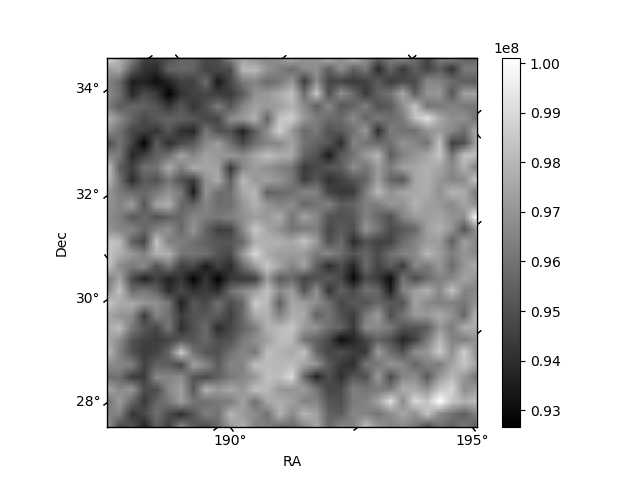
| Quadrant D |  |
 |
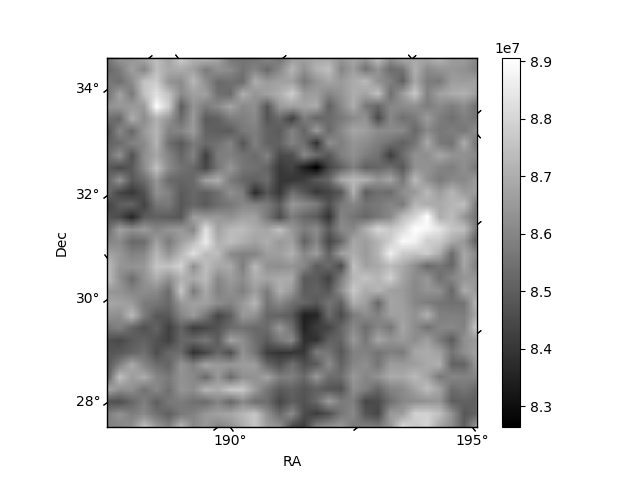
Quadrant C |
| Plot type | Count rate plots | Images |
|---|---|---|
| Comparison with Poisson distribution Blue bars denote a histogram of data divided into 1 sec bins. Red curve is a Poisson curve with rate = median count rate of data. |
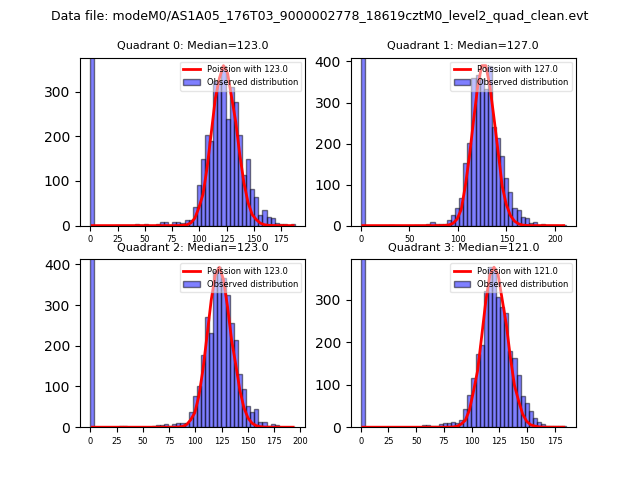 |
 |
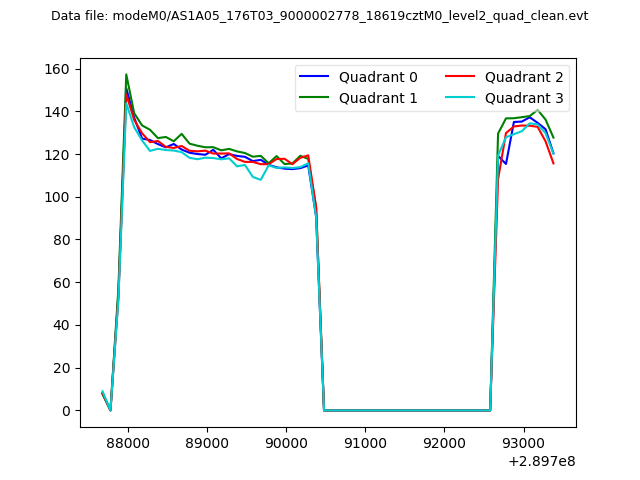
| Quadrant-wise count rates Data is divided into 100 sec bins |
 |
|
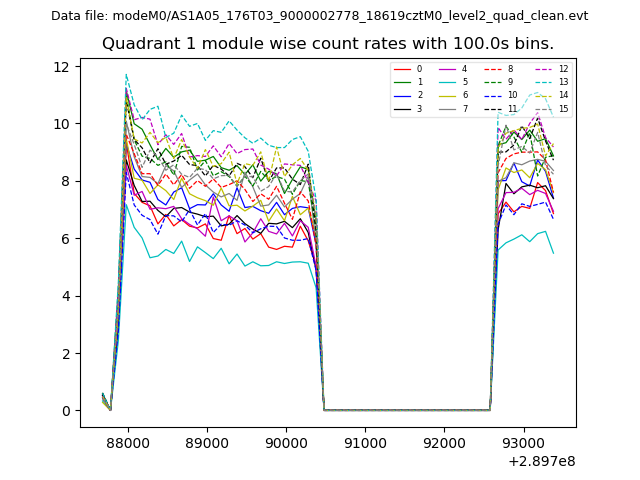
| Module-wise count rates for Quadrant A Data is divided into 100 sec bins |
 |
 |
| Module-wise count rates for Quadrant B Data is divided into 100 sec bins |
 |
 |
| Module-wise count rates for Quadrant C Data is divided into 100 sec bins |
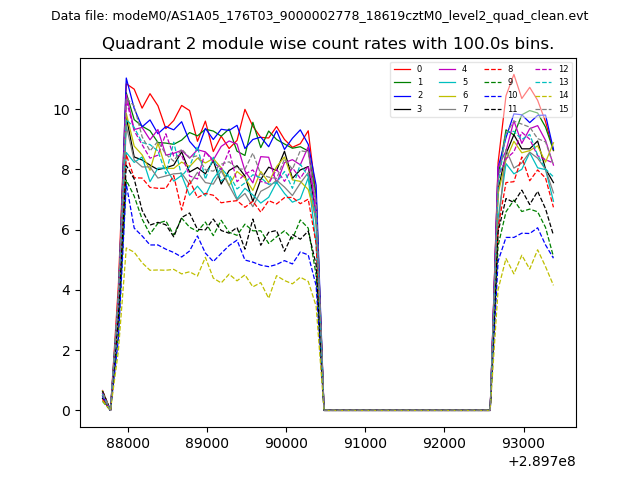 |
 |
| Module-wise count rates for Quadrant D Data is divided into 100 sec bins |
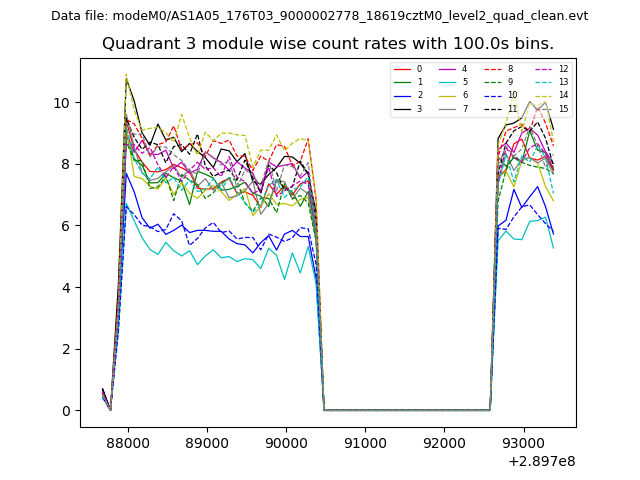 |
 |
| Parameter | Plot |
|---|---|
| CZT HV Monitor |  |
| D_VDD | 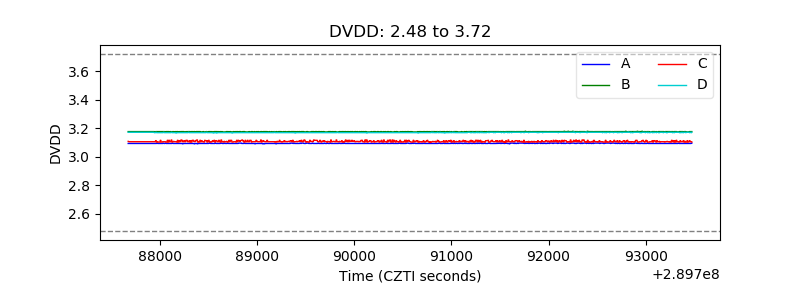 |
| Temperature 1 | 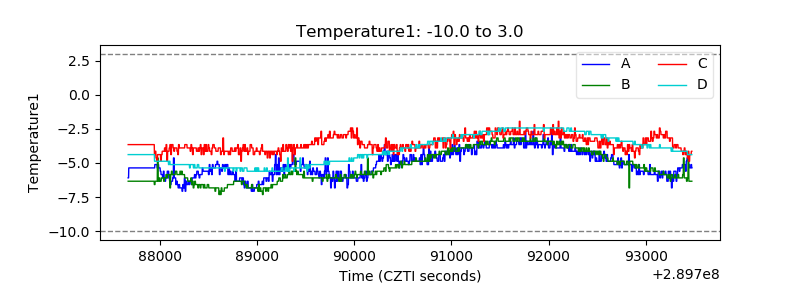 |
| Veto HV Monitor | 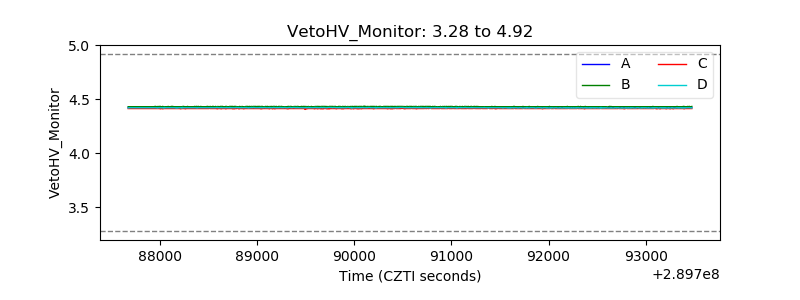 |
| Veto LLD | 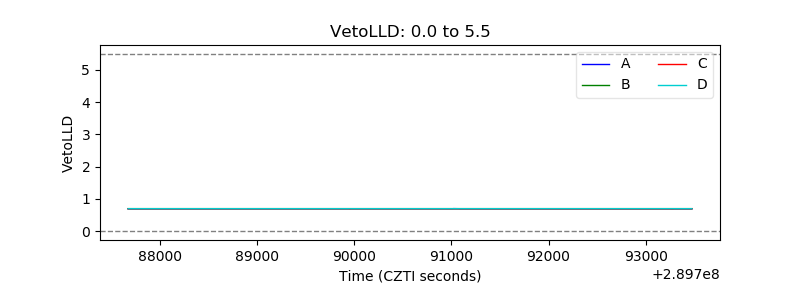 |
| Alpha Counter | 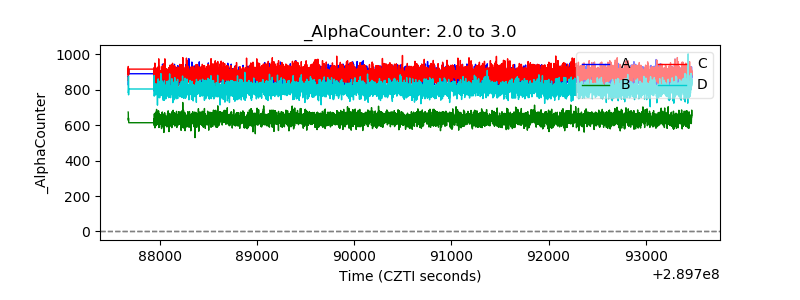 |
| _CPM_Rate | 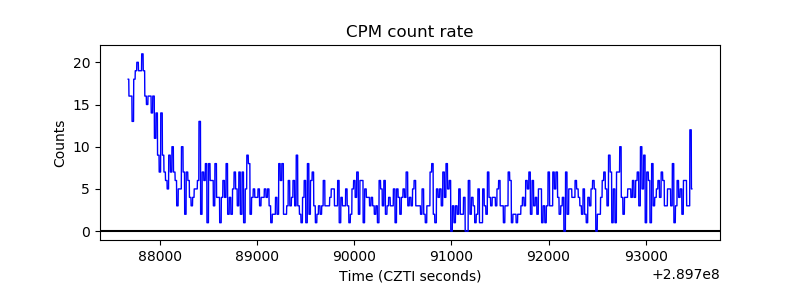 |
| CZT Counter | 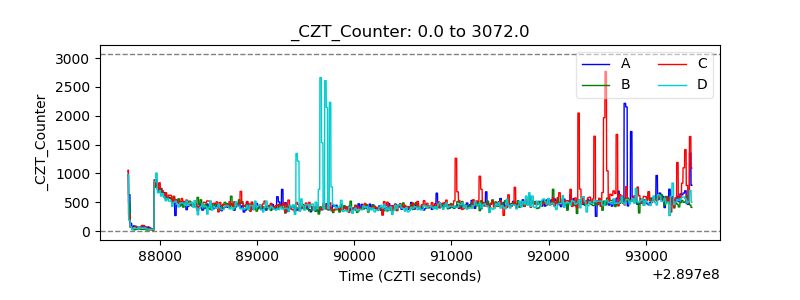 |
| +2.5 Volts monitor |  |
| +5 Volts monitor | 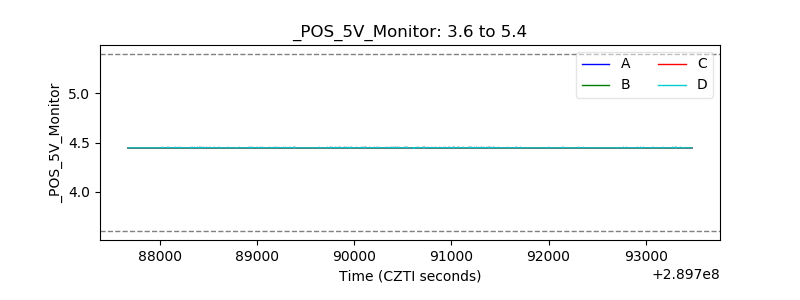 |
| _ROLL_ROT | 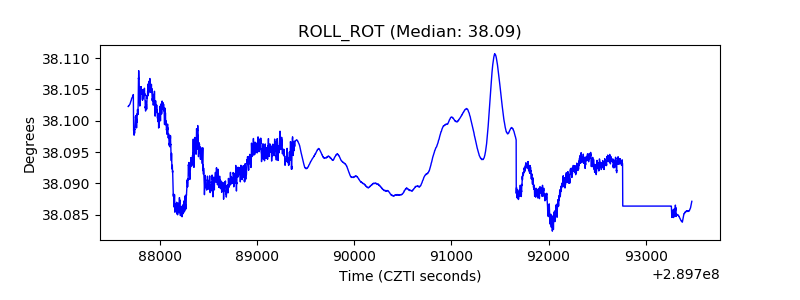 |
| _Roll_DEC | 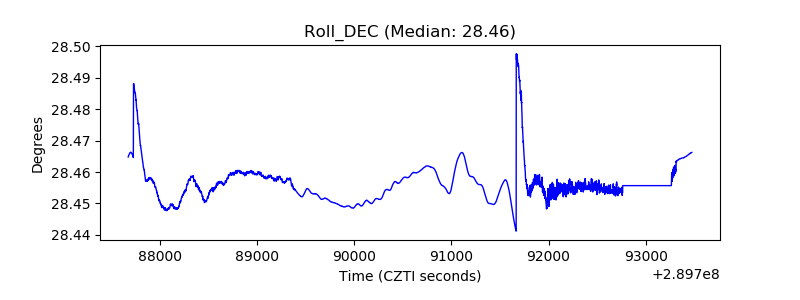 |
| _Roll_RA | 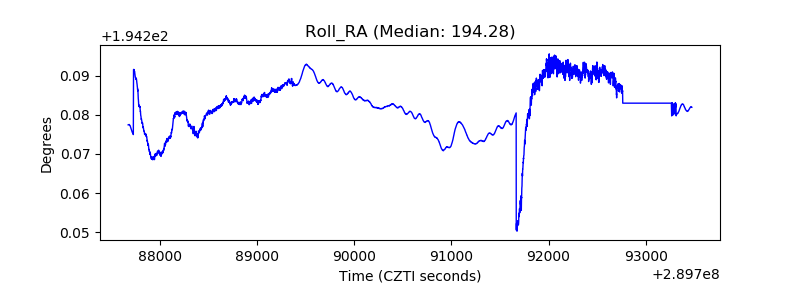 |
| Veto Counter | 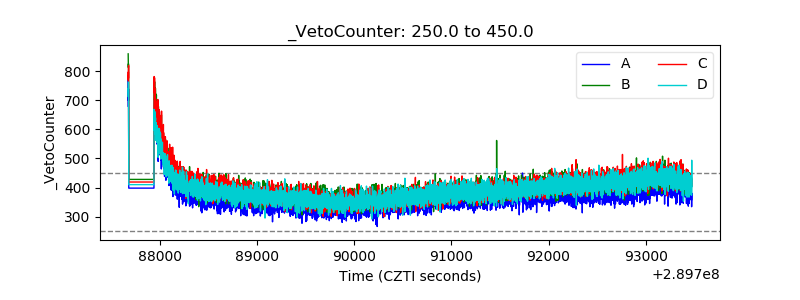 |