| Param | Original file | Final file |
|---|---|---|
| Filename | modeM0/AS1A05_212T06_9000002776_18616cztM0_level2.evt | modeM0/AS1A05_212T06_9000002776_18616cztM0_level2_quad_clean.evt |
| Size (bytes) | 284,783,040 | 56,453,760 |
| Size | 271.6 MB | 53.8 MB |
| Events in quadrant A | 2,061,519 | 357,444 |
| Events in quadrant B | 2,055,325 | 371,657 |
| Events in quadrant C | 1,995,942 | 356,403 |
| Events in quadrant D | 2,240,922 | 343,828 |
| Mode M9 | |||
|---|---|---|---|
| Quadrant | BADHDUFLAG | Total packets | Discarded packets |
| A | 0 | 11 | 0 |
| B | 0 | 11 | 0 |
| C | 0 | 11 | 0 |
| D | 0 | 11 | 0 |
| Mode M0 | |||
|---|---|---|---|
| Quadrant | BADHDUFLAG | Total packets | Discarded packets |
| A | 0 | 8678 | 1 |
| B | 0 | 8613 | 1 |
| C | 0 | 8351 | 1 |
| D | 0 | 9326 | 1 |
| Mode SS | |||
|---|---|---|---|
| Quadrant | BADHDUFLAG | Total packets | Discarded packets |
| A | 0 | 82 | 0 |
| B | 0 | 82 | 0 |
| C | 0 | 82 | 0 |
| D | 0 | 82 | 0 |
| Quadrant | Total seconds | Saturated seconds | Saturation percentage |
|---|---|---|---|
| A | 3965 | 38 | 0.958386% |
| B | 3965 | 55 | 1.387137% |
| C | 3965 | 51 | 1.286255% |
| D | 3965 | 27 | 0.680958% |
Noise dominated data is calculated using 1-second bins in cleaned event files. If a bin has >2000 counts, and if more than 50% of those come from <1% of pixels, then it is considered to be noise-dominated and hence unusable.
| Quadrant | # 1 sec bins | Bins with >0 counts | Bins with >2000 counts | High rate bins dominated by noise | Noise dominated (total time) | Noise dominated (detector-on time) | Marked lightcurve |
|---|---|---|---|---|---|---|---|
| A | 5075 | 3966 | 2 | 2 | 0.04% | 0.05% | 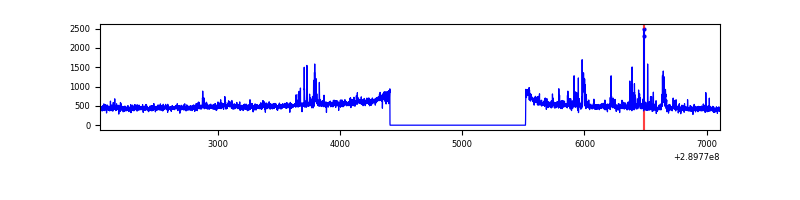 |
| B | 5075 | 3966 | 3 | 3 | 0.06% | 0.08% | 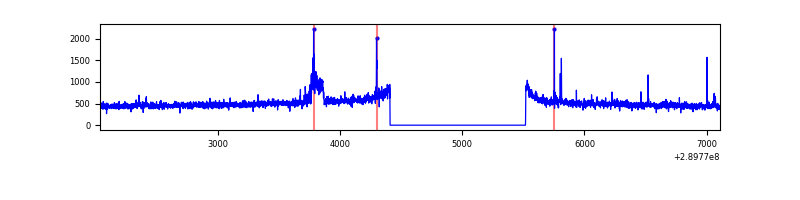 |
| C | 5075 | 3966 | 0 | 0 | 0.00% | 0.00% | 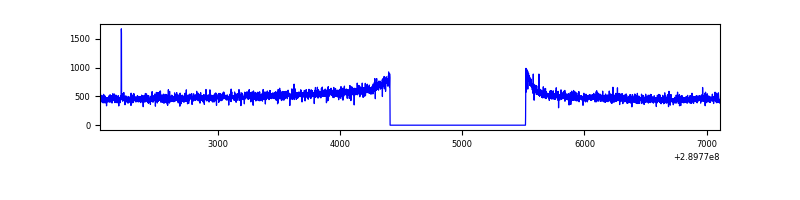 |
| D | 5075 | 3966 | 9 | 9 | 0.18% | 0.23% | 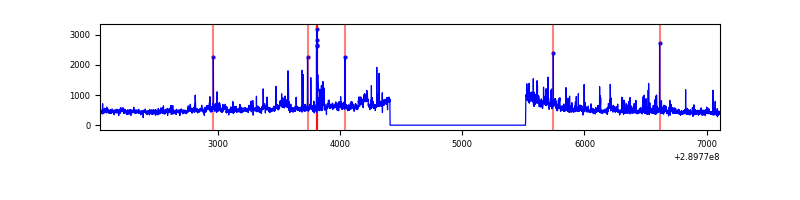 |
Top three noisy pixels from each quadrant. If the there are fewer than three noisy pixels in the level2.evt file, extra rows are filled as -1
| Pixel properties | Quadrant properties | ||||||
|---|---|---|---|---|---|---|---|
| Quadrant | DetID | PixID | Counts | Sigma | Mean | Median | Sigma |
| A | 0 | 13 | 133604 | 1314.14 | 499 | 488 | 101.3 |
| A | 13 | 254 | 6630 | 60.63 | 499 | 488 | 101.3 |
| A | 0 | 226 | 4311 | 37.74 | 499 | 488 | 101.3 |
| B | 0 | 230 | 60618 | 624.76 | 504 | 491 | 96.2 |
| B | 12 | 111 | 11360 | 112.94 | 504 | 491 | 96.2 |
| B | 11 | 111 | 10224 | 101.13 | 504 | 491 | 96.2 |
| C | 14 | 238 | 75807 | 657.03 | 488 | 492 | 114.6 |
| C | 3 | 233 | 12956 | 108.73 | 488 | 492 | 114.6 |
| C | 9 | 54 | 4288 | 33.12 | 488 | 492 | 114.6 |
| D | 1 | 52 | 250789 | 2075.51 | 490 | 475 | 120.6 |
| D | 5 | 222 | 62227 | 512.02 | 490 | 475 | 120.6 |
| D | 7 | 96 | 33049 | 270.09 | 490 | 475 | 120.6 |
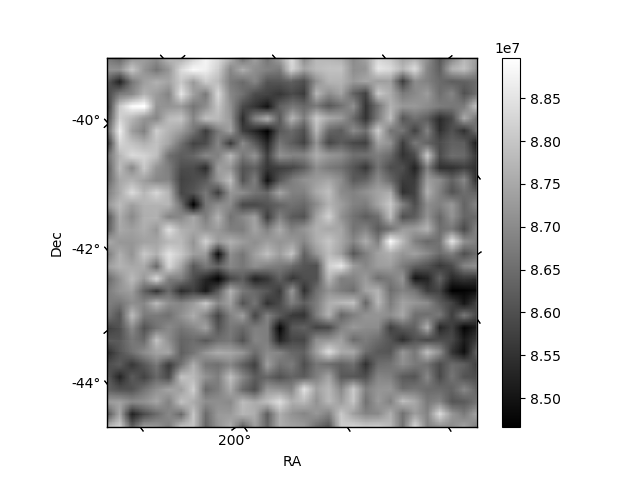
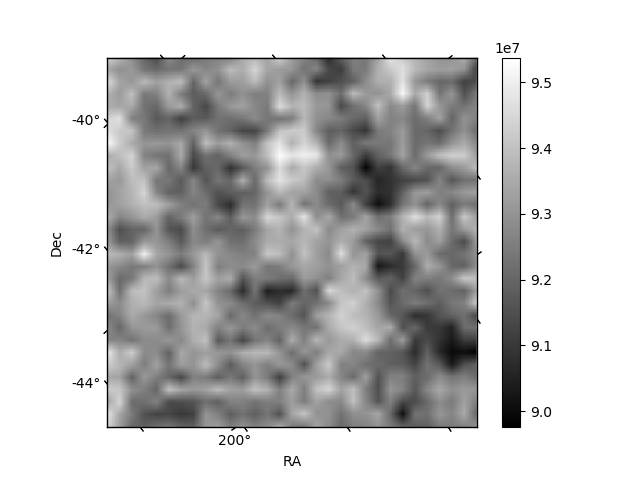
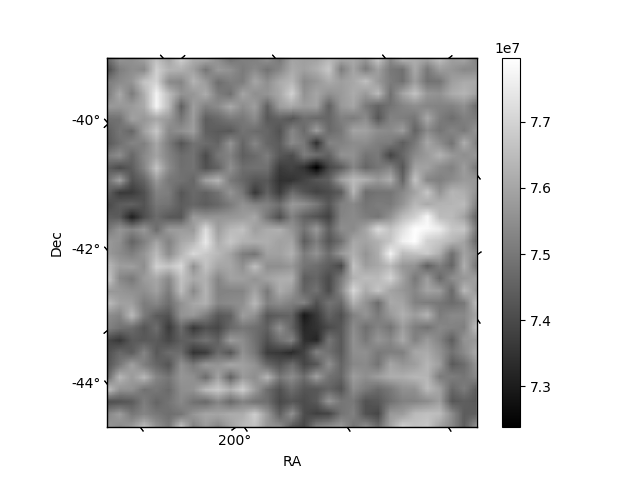
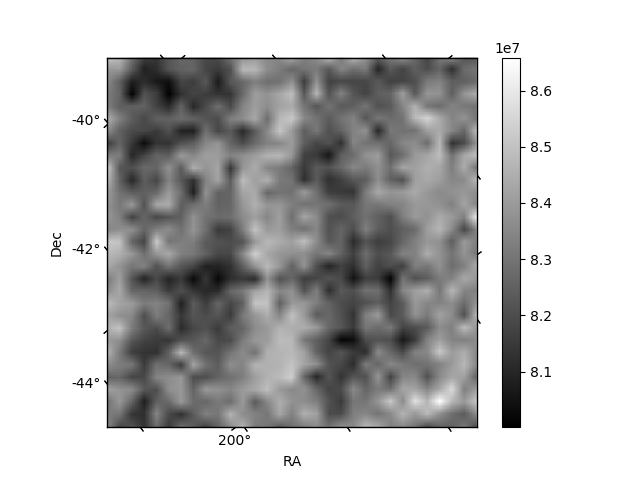
Histogram calculated using DETX and DETY for each event in the final _common_clean file
| Quadrant A | 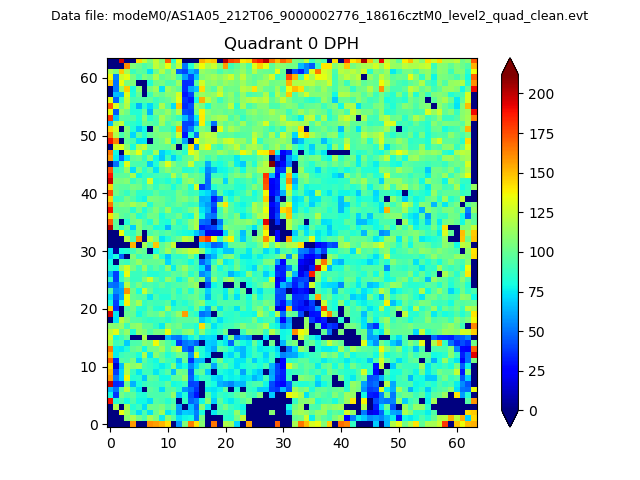 |
 |
Quadrant B |
|---|---|---|---|
| Quadrant D | 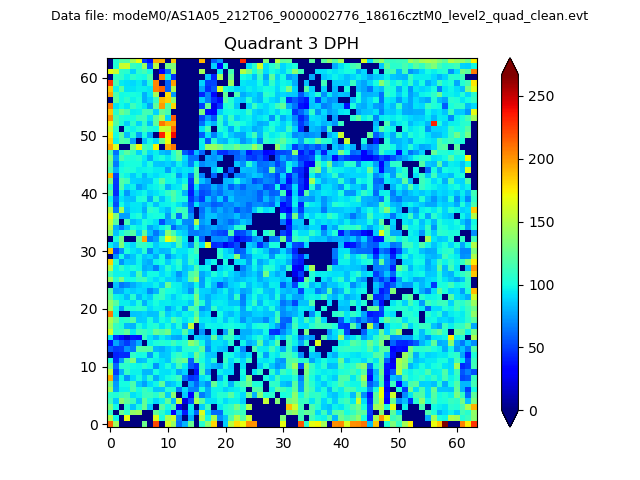 |
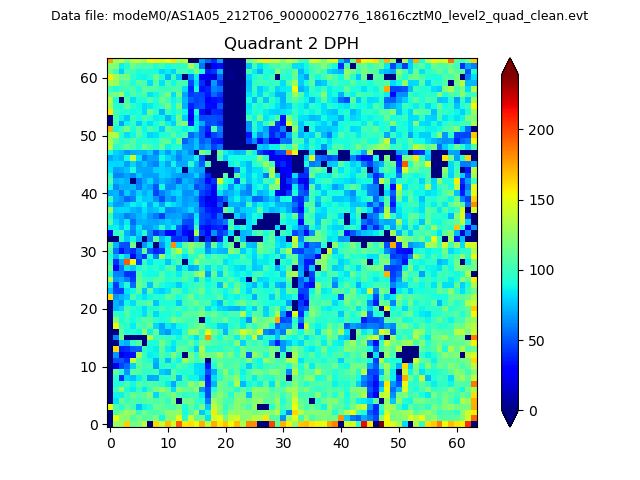 |
Quadrant C |
| Plot type | Count rate plots | Images |
|---|---|---|
| Comparison with Poisson distribution Blue bars denote a histogram of data divided into 1 sec bins. Red curve is a Poisson curve with rate = median count rate of data. |
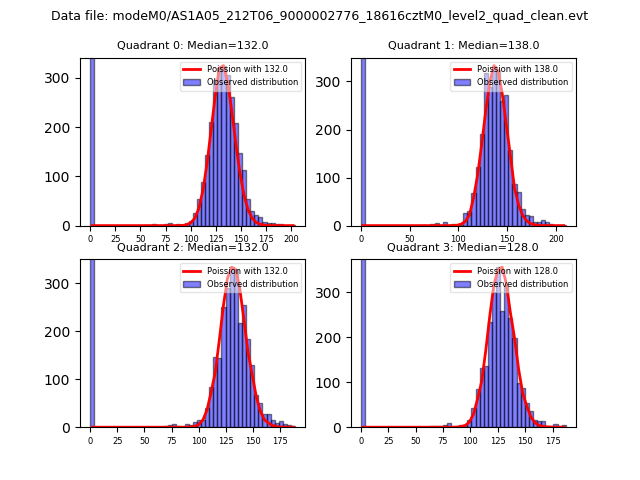 |
 |
| Quadrant-wise count rates Data is divided into 100 sec bins |
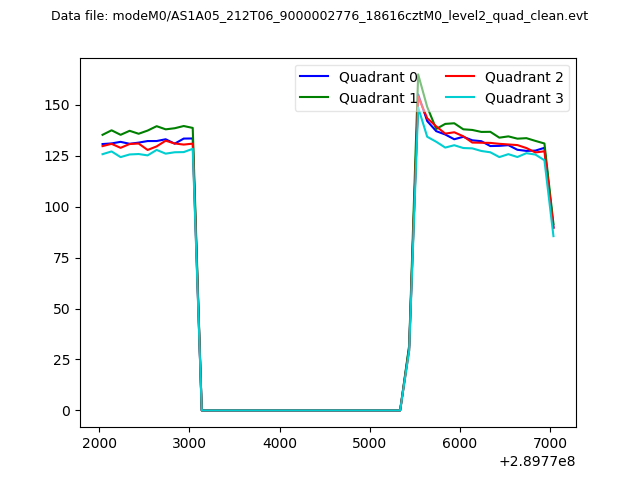 |
|
| Module-wise count rates for Quadrant A Data is divided into 100 sec bins |
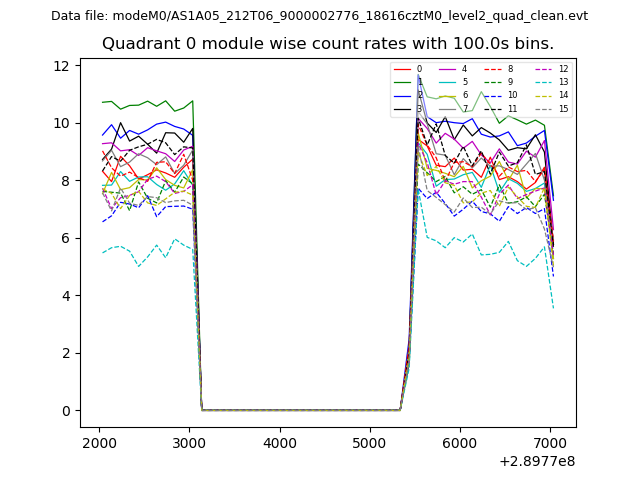 |
 |
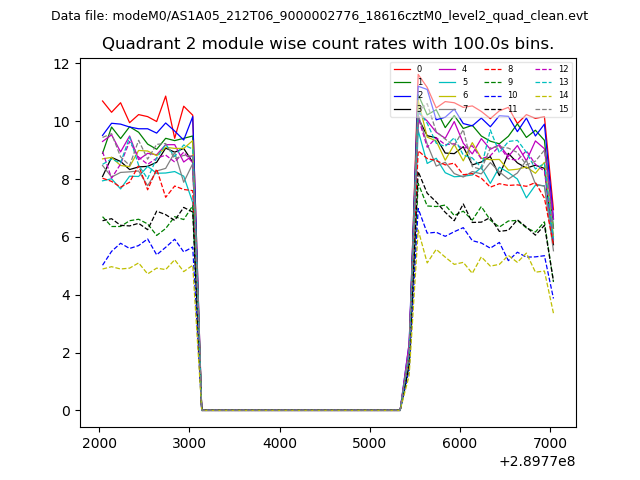
| Module-wise count rates for Quadrant B Data is divided into 100 sec bins |
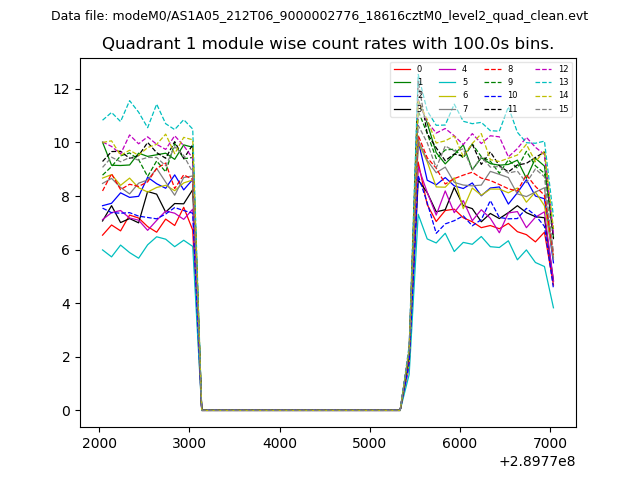 |
 |
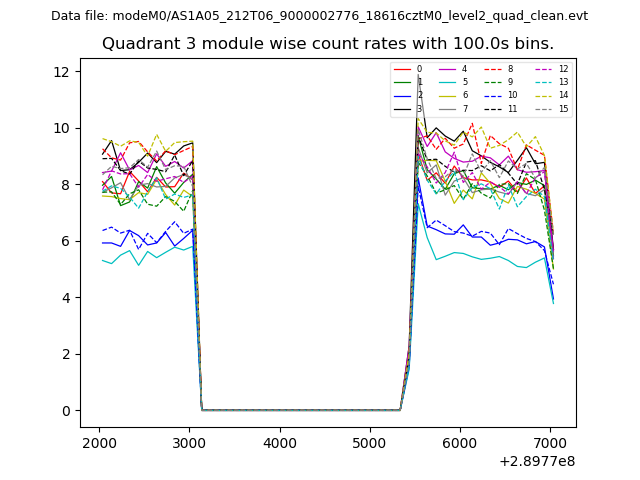
| Module-wise count rates for Quadrant C Data is divided into 100 sec bins |
 |
 |
| Module-wise count rates for Quadrant D Data is divided into 100 sec bins |
 |
 |
| Parameter | Plot |
|---|---|
| CZT HV Monitor | 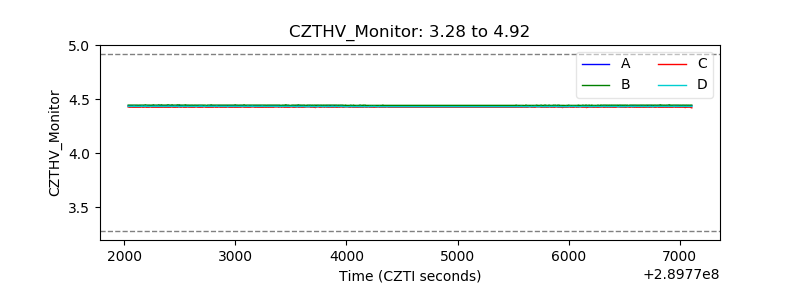 |
| D_VDD | 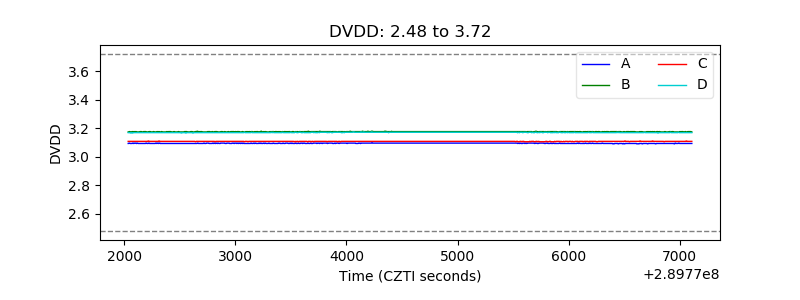 |
| Temperature 1 | 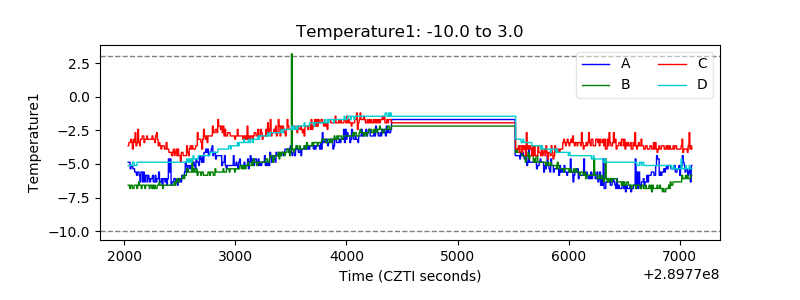 |
| Veto HV Monitor | 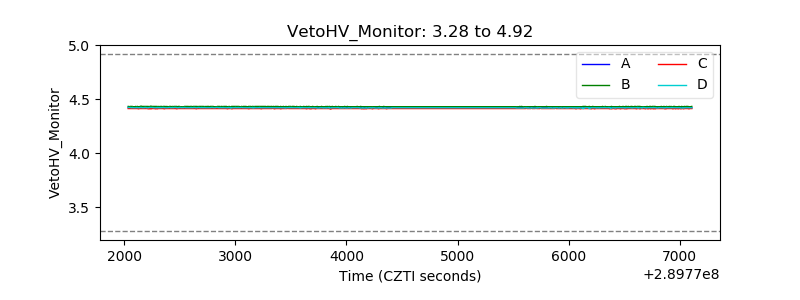 |
| Veto LLD | 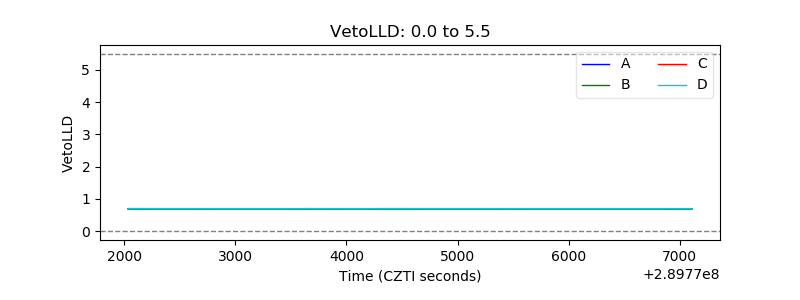 |
| Alpha Counter | 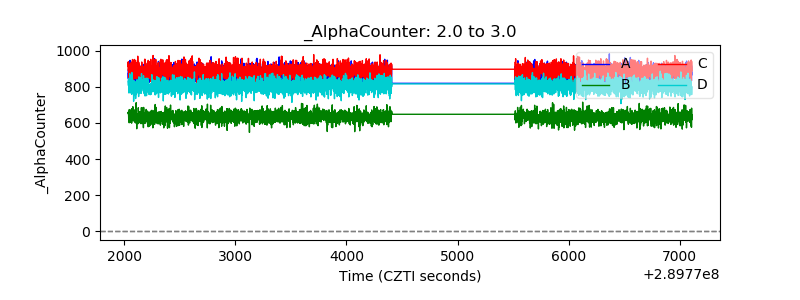 |
| _CPM_Rate | 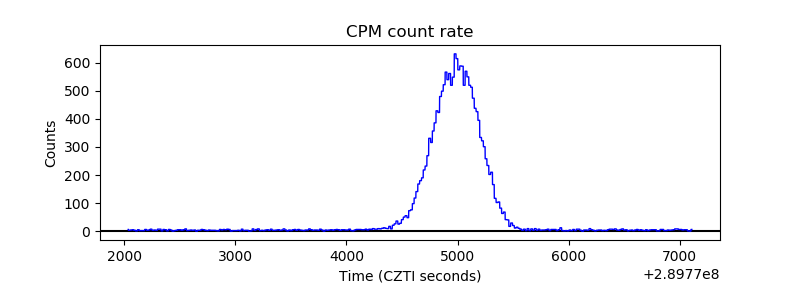 |
| CZT Counter |  |
| +2.5 Volts monitor | 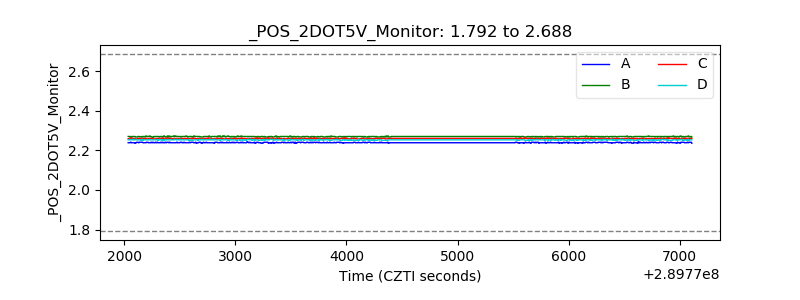 |
| +5 Volts monitor | 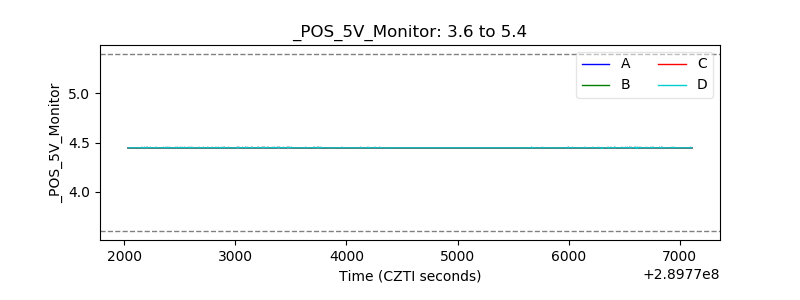 |
| _ROLL_ROT | 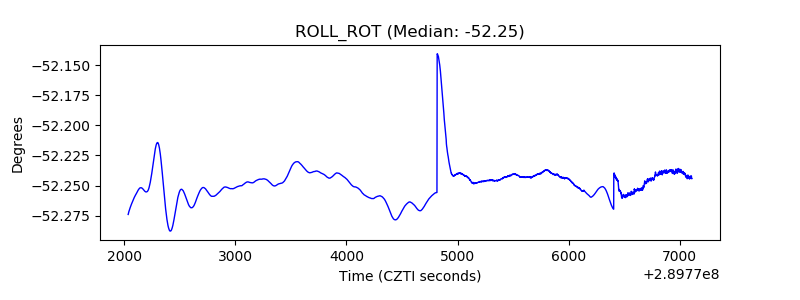 |
| _Roll_DEC | 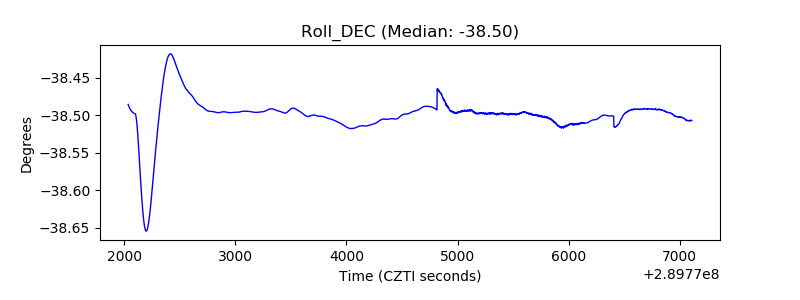 |
| _Roll_RA |  |
| Veto Counter | 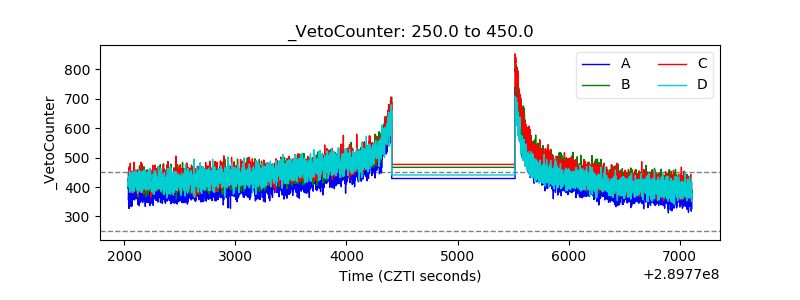 |