| Param | Original file | Final file |
|---|---|---|
| Filename | modeM0/AS1A05_212T06_9000002776_18617cztM0_level2.evt | modeM0/AS1A05_212T06_9000002776_18617cztM0_level2_quad_clean.evt |
| Size (bytes) | 233,432,640 | 67,043,520 |
| Size | 222.6 MB | 63.9 MB |
| Events in quadrant A | 1,686,342 | 447,147 |
| Events in quadrant B | 1,659,282 | 461,569 |
| Events in quadrant C | 1,626,638 | 444,164 |
| Events in quadrant D | 1,854,882 | 426,681 |
| Mode M9 | |||
|---|---|---|---|
| Quadrant | BADHDUFLAG | Total packets | Discarded packets |
| A | 0 | 3 | 0 |
| B | 0 | 4 | 0 |
| C | 0 | 4 | 0 |
| D | 0 | 4 | 0 |
| Mode M0 | |||
|---|---|---|---|
| Quadrant | BADHDUFLAG | Total packets | Discarded packets |
| A | 0 | 7518 | 1 |
| B | 0 | 7338 | 1 |
| C | 0 | 7201 | 1 |
| D | 0 | 8049 | 1 |
| Mode SS | |||
|---|---|---|---|
| Quadrant | BADHDUFLAG | Total packets | Discarded packets |
| A | 0 | 70 | 0 |
| B | 0 | 70 | 0 |
| C | 0 | 70 | 0 |
| D | 0 | 70 | 0 |
| Quadrant | Total seconds | Saturated seconds | Saturation percentage |
|---|---|---|---|
| A | 3542 | 18 | 0.508187% |
| B | 3542 | 14 | 0.395257% |
| C | 3542 | 23 | 0.649351% |
| D | 3542 | 43 | 1.214003% |
Noise dominated data is calculated using 1-second bins in cleaned event files. If a bin has >2000 counts, and if more than 50% of those come from <1% of pixels, then it is considered to be noise-dominated and hence unusable.
| Quadrant | # 1 sec bins | Bins with >0 counts | Bins with >2000 counts | High rate bins dominated by noise | Noise dominated (total time) | Noise dominated (detector-on time) | Marked lightcurve |
|---|---|---|---|---|---|---|---|
| A | 3542 | 3542 | 2 | 2 | 0.06% | 0.06% | 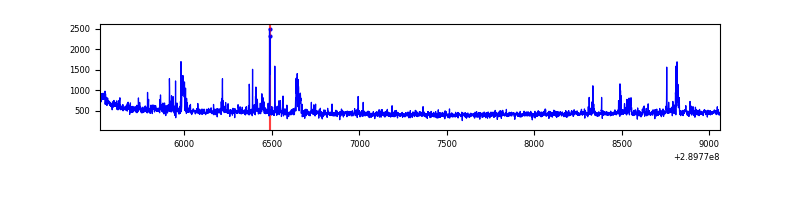 |
| B | 3542 | 3542 | 1 | 1 | 0.03% | 0.03% | 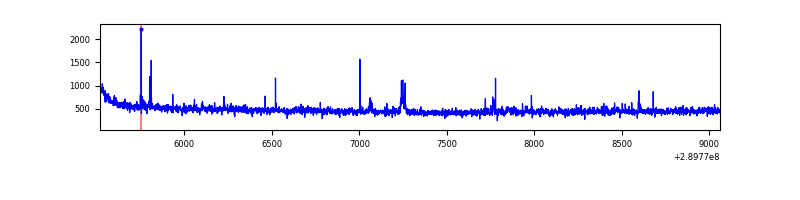 |
| C | 3542 | 3542 | 0 | 0 | 0.00% | 0.00% | 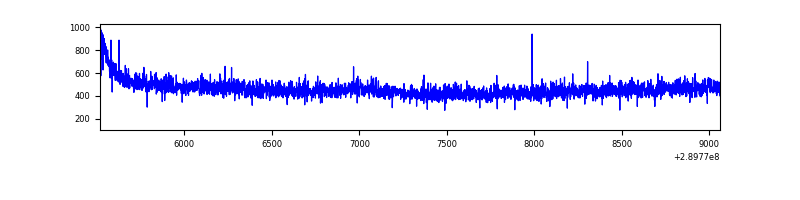 |
| D | 3542 | 3542 | 26 | 26 | 0.73% | 0.73% | 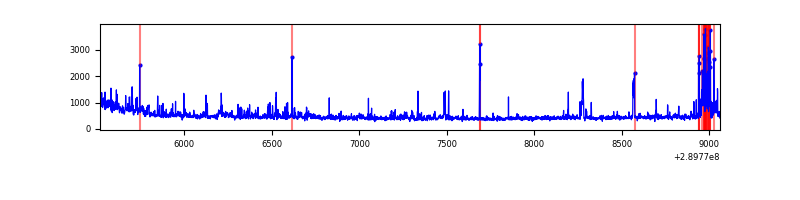 |
Top three noisy pixels from each quadrant. If the there are fewer than three noisy pixels in the level2.evt file, extra rows are filled as -1
| Pixel properties | Quadrant properties | ||||||
|---|---|---|---|---|---|---|---|
| Quadrant | DetID | PixID | Counts | Sigma | Mean | Median | Sigma |
| A | 0 | 13 | 98889 | 1188.67 | 404 | 396 | 82.9 |
| A | 9 | 143 | 26576 | 315.95 | 404 | 396 | 82.9 |
| A | 13 | 254 | 6599 | 74.86 | 404 | 396 | 82.9 |
| B | 0 | 230 | 25343 | 314.84 | 411 | 402 | 79.2 |
| B | 0 | 229 | 11578 | 141.08 | 411 | 402 | 79.2 |
| B | 12 | 111 | 9372 | 113.23 | 411 | 402 | 79.2 |
| C | 14 | 238 | 61800 | 652.45 | 396 | 400 | 94.1 |
| C | 3 | 233 | 16906 | 175.4 | 396 | 400 | 94.1 |
| C | 13 | 61 | 2698 | 24.42 | 396 | 400 | 94.1 |
| D | 1 | 52 | 293462 | 3052.92 | 393 | 380 | 96.0 |
| D | 5 | 222 | 25527 | 261.95 | 393 | 380 | 96.0 |
| D | 2 | 120 | 21117 | 216.01 | 393 | 380 | 96.0 |
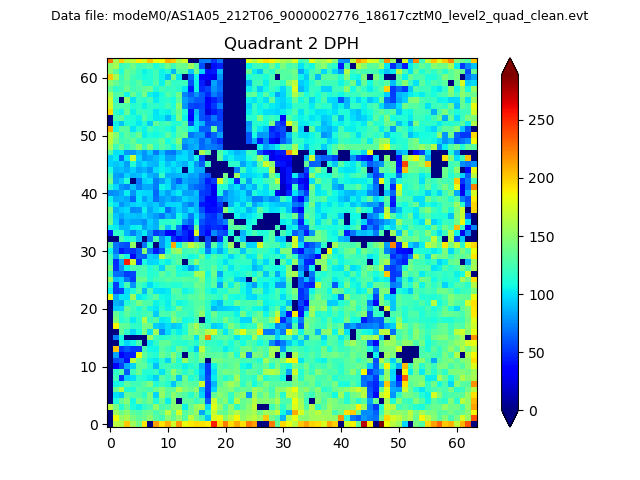
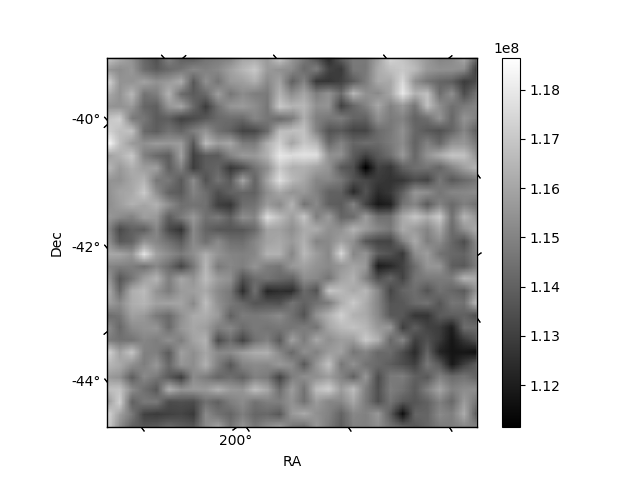
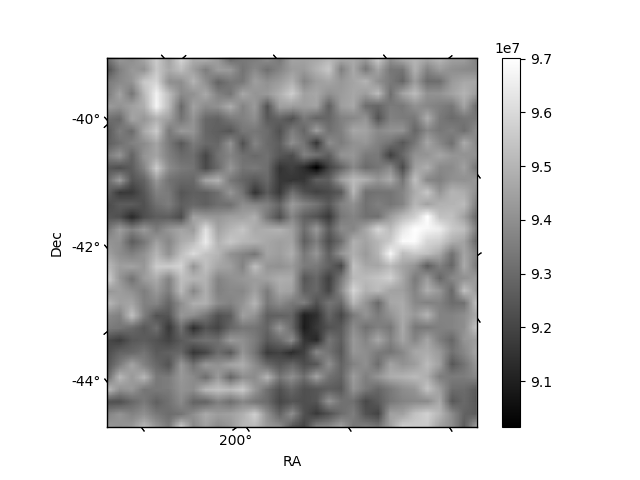
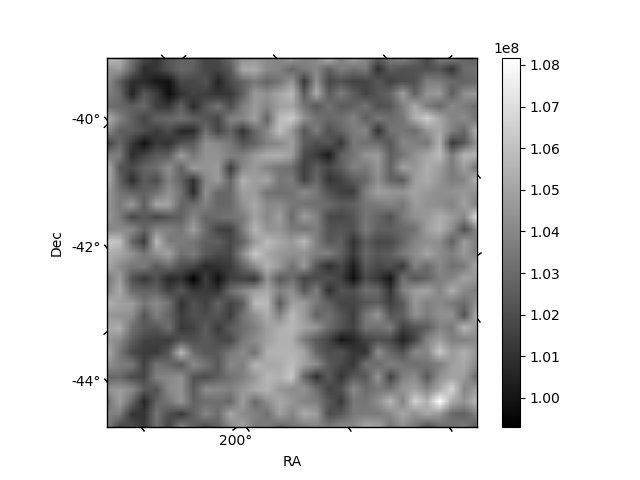
Histogram calculated using DETX and DETY for each event in the final _common_clean file
| Quadrant A | 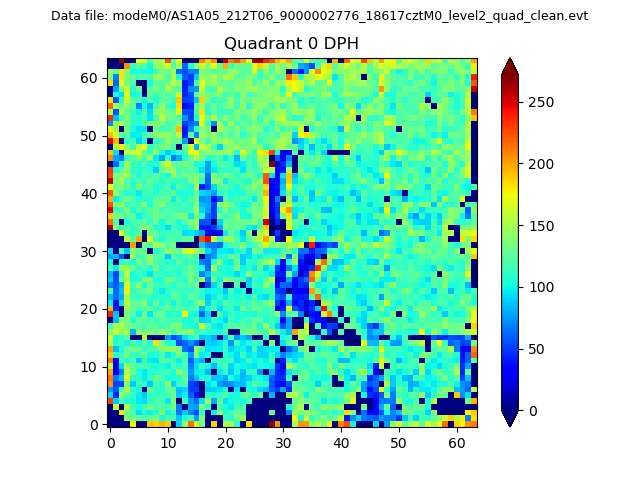 |
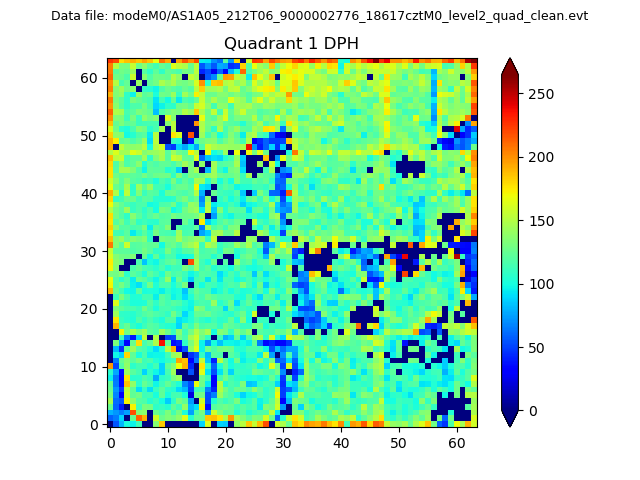 |
Quadrant B |
|---|---|---|---|
| Quadrant D | 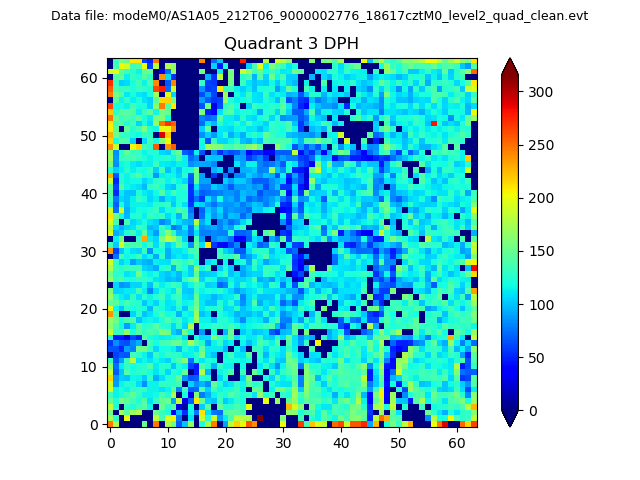 |
 |
Quadrant C |
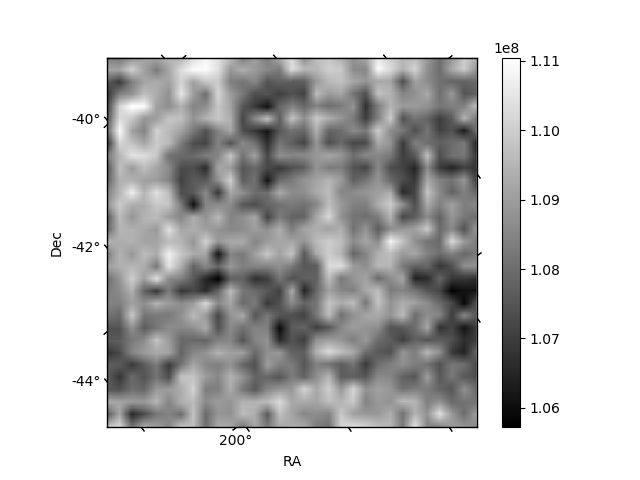
| Plot type | Count rate plots | Images |
|---|---|---|
| Comparison with Poisson distribution Blue bars denote a histogram of data divided into 1 sec bins. Red curve is a Poisson curve with rate = median count rate of data. |
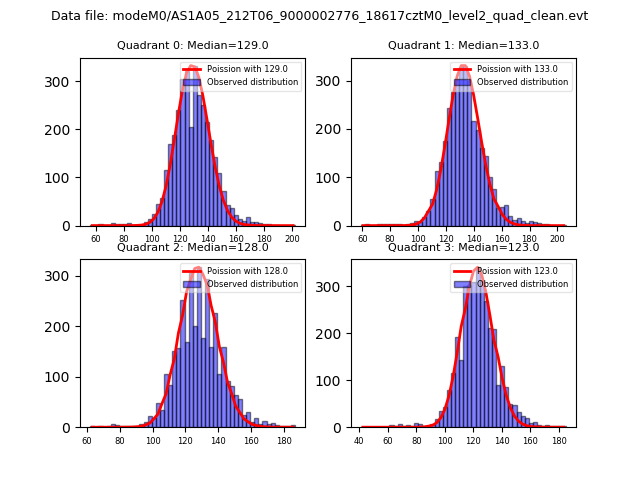 |
 |
| Quadrant-wise count rates Data is divided into 100 sec bins |
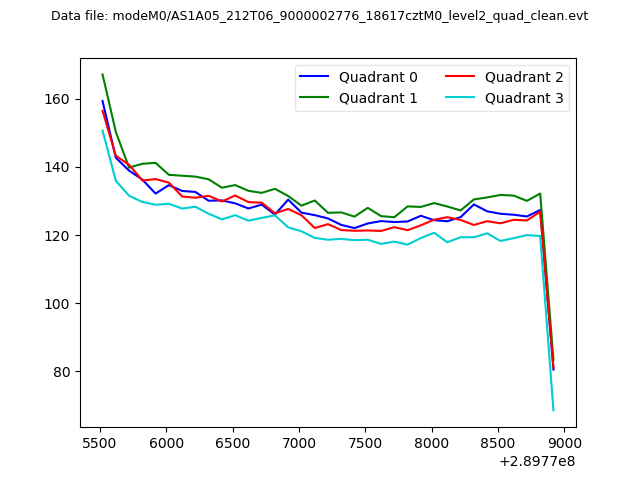 |
|
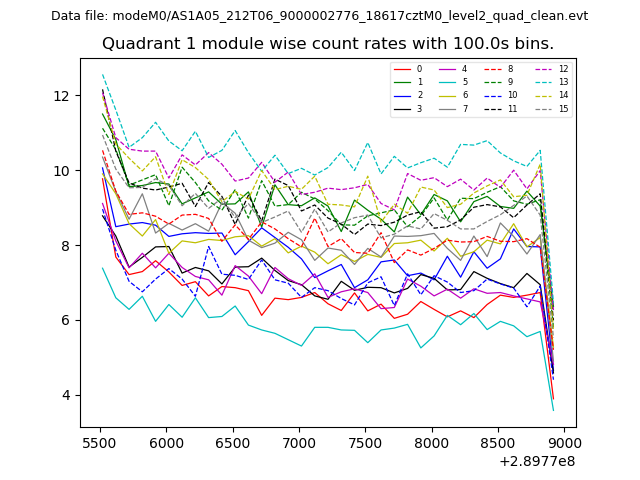
| Module-wise count rates for Quadrant A Data is divided into 100 sec bins |
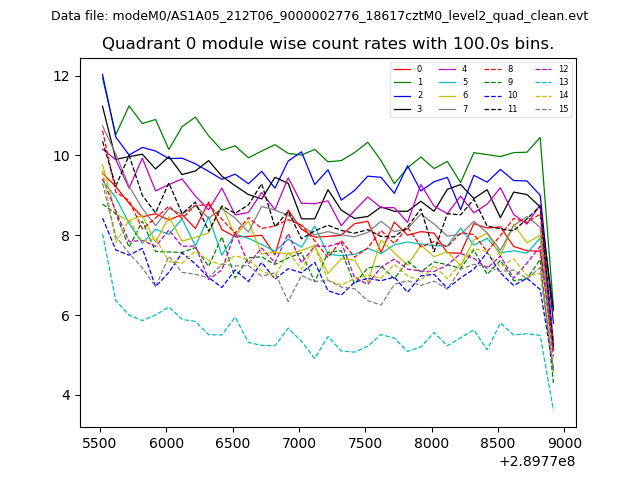 |
 |
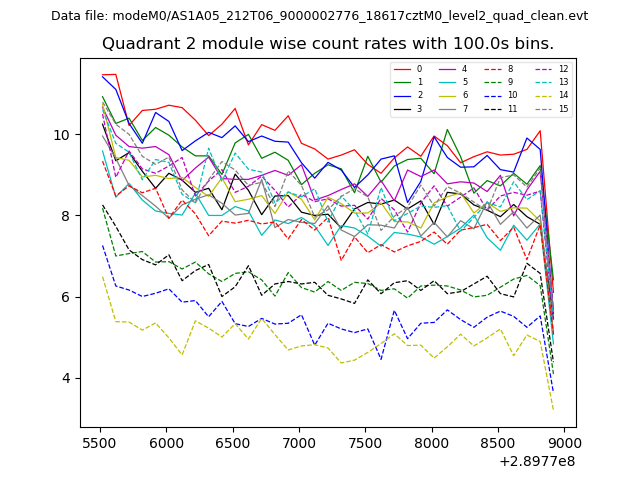
| Module-wise count rates for Quadrant B Data is divided into 100 sec bins |
 |
 |
| Module-wise count rates for Quadrant C Data is divided into 100 sec bins |
 |
 |
| Module-wise count rates for Quadrant D Data is divided into 100 sec bins |
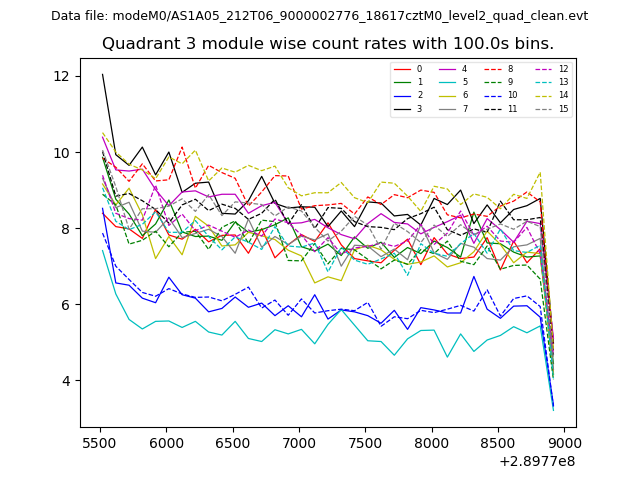 |
 |
| Parameter | Plot |
|---|---|
| CZT HV Monitor | 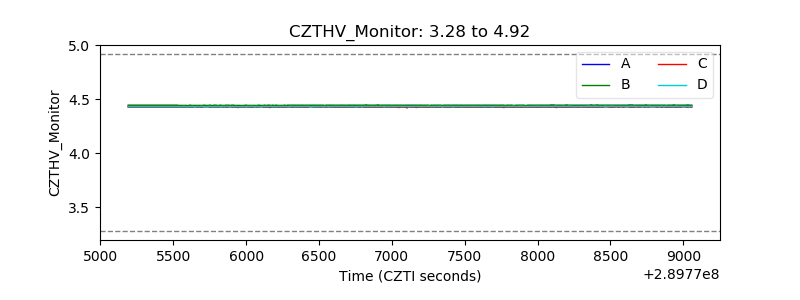 |
| D_VDD | 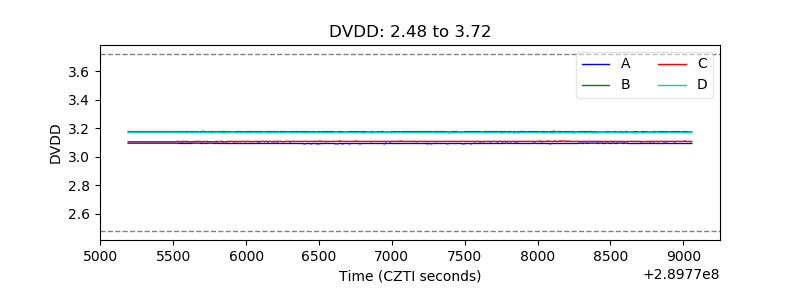 |
| Temperature 1 | 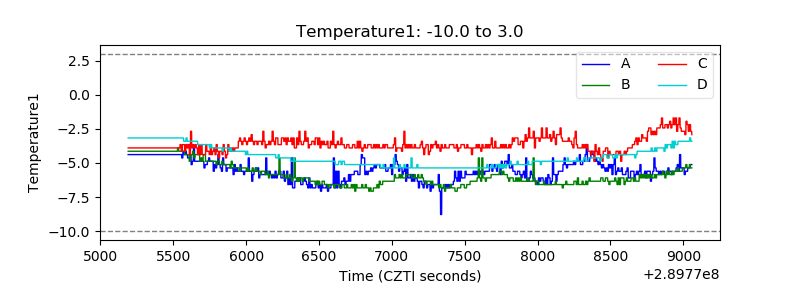 |
| Veto HV Monitor | 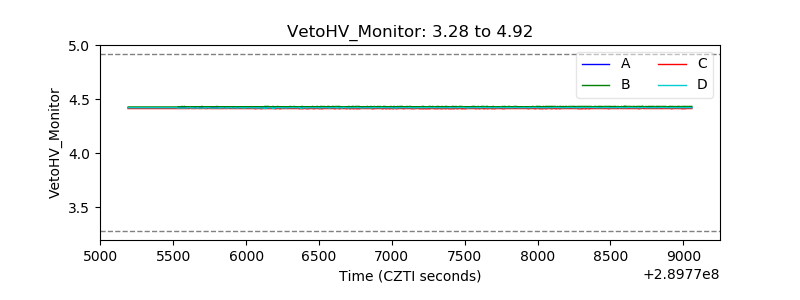 |
| Veto LLD | 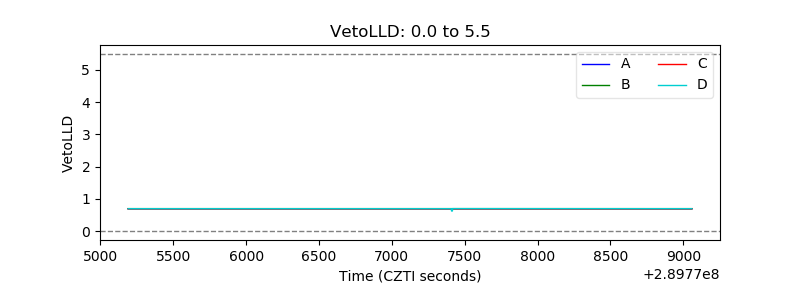 |
| Alpha Counter | 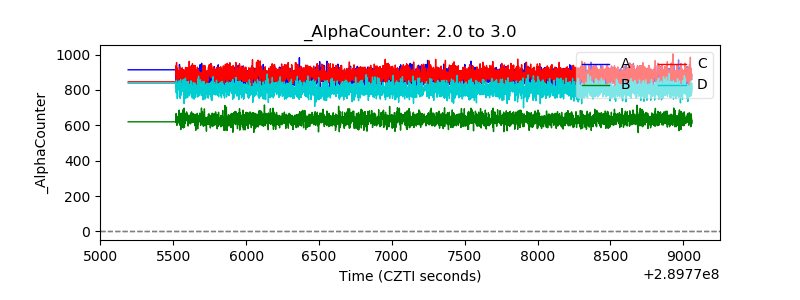 |
| _CPM_Rate | 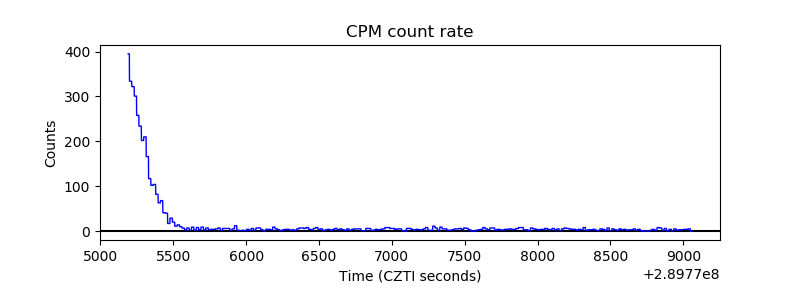 |
| CZT Counter |  |
| +2.5 Volts monitor |  |
| +5 Volts monitor | 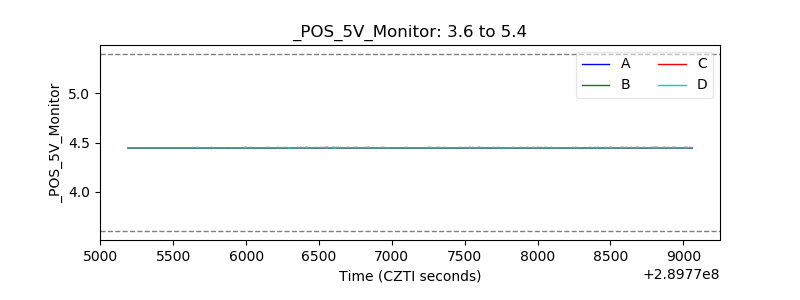 |
| _ROLL_ROT | 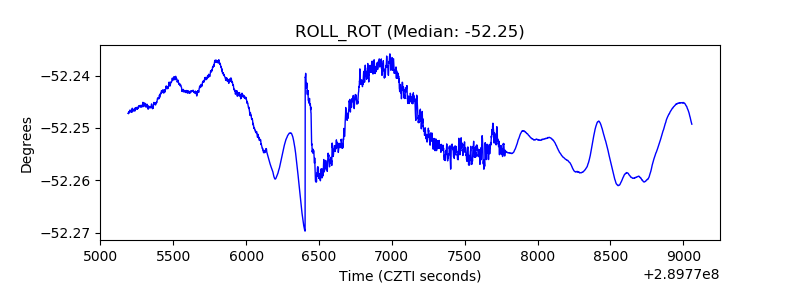 |
| _Roll_DEC | 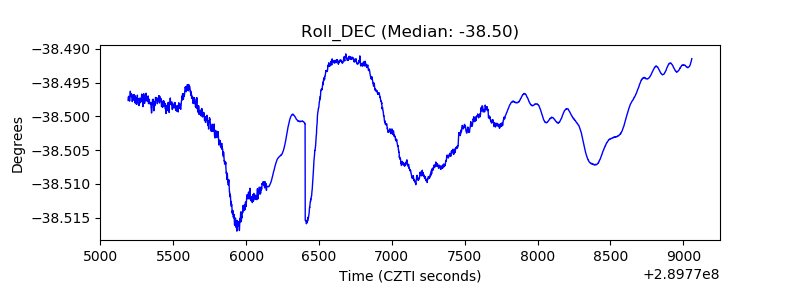 |
| _Roll_RA |  |
| Veto Counter | 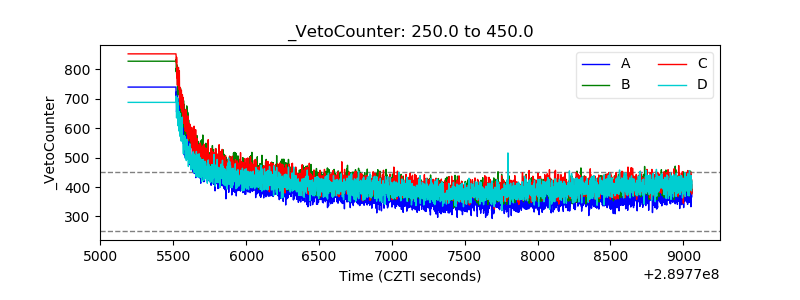 |