| Param | Original file | Final file |
|---|---|---|
| Filename | modeM0/AS1A05_104T07_9000002780cztM0_level2.fits | modeM0/AS1A05_104T07_9000002780cztM0_level2_quad_clean.evt |
| Size (bytes) | 248,022,720 | 233,953,920 |
| Size | 236.5 MB | 223.1 MB |
| Events in quadrant A | 1,487,492 | 1,344,292 |
| Events in quadrant B | 1,457,178 | 1,401,566 |
| Events in quadrant C | 1,496,684 | 1,341,325 |
| Events in quadrant D | 1,231,960 | 1,160,828 |
| Mode M0 | |||
|---|---|---|---|
| Quadrant | BADHDUFLAG | Total packets | Discarded packets |
| A | 0 | 62383 | 0 |
| B | 0 | 56331 | 0 |
| C | 0 | 54772 | 0 |
| D | 0 | 85953 | 0 |
| Mode SS | |||
|---|---|---|---|
| Quadrant | BADHDUFLAG | Total packets | Discarded packets |
| A | 0 | 544 | 0 |
| B | 0 | 544 | 0 |
| C | 0 | 544 | 0 |
| D | 0 | 544 | 0 |
| Mode M9 | |||
|---|---|---|---|
| Quadrant | BADHDUFLAG | Total packets | Discarded packets |
| A | 0 | 27 | 0 |
| B | 0 | 27 | 0 |
| C | 0 | 27 | 0 |
| D | 0 | 27 | 0 |
| Quadrant | Total seconds | Saturated seconds | Saturation percentage |
|---|---|---|---|
| A | 26704 | 1003 | 3.755992% |
| B | 26704 | 435 | 1.628969% |
| C | 26704 | 381 | 1.426753% |
| D | 26704 | 2905 | 10.878520% |
Noise dominated data is calculated using 1-second bins in cleaned event files. If a bin has >2000 counts, and if more than 50% of those come from <1% of pixels, then it is considered to be noise-dominated and hence unusable.
| Quadrant | # 1 sec bins | Bins with >0 counts | Bins with >2000 counts | High rate bins dominated by noise | Noise dominated (total time) | Noise dominated (detector-on time) | Marked lightcurve |
|---|---|---|---|---|---|---|---|
| A | 29339 | 26700 | 0 | 0 | 0.00% | 0.00% |  |
| B | 29339 | 26702 | 0 | 0 | 0.00% | 0.00% |  |
| C | 29339 | 26702 | 0 | 0 | 0.00% | 0.00% |  |
| D | 29339 | 26623 | 0 | 0 | 0.00% | 0.00% |  |
Top three noisy pixels from each quadrant. If the there are fewer than three noisy pixels in the level2.evt file, extra rows are filled as -1
| Pixel properties | Quadrant properties | ||||||
|---|---|---|---|---|---|---|---|
| Quadrant | DetID | PixID | Counts | Sigma | Mean | Median | Sigma |
| A | 0 | 29 | 1216 | 8.64 | 387 | 361 | 99.0 |
| A | 7 | 110 | 1156 | 8.03 | 387 | 361 | 99.0 |
| A | 9 | 19 | 1142 | 7.89 | 387 | 361 | 99.0 |
| B | 2 | 9 | 1151 | 9.91 | 384 | 366 | 79.2 |
| B | 5 | 232 | 965 | 7.56 | 384 | 366 | 79.2 |
| B | 2 | 8 | 958 | 7.47 | 384 | 366 | 79.2 |
| C | 1 | 81 | 1129 | 7.51 | 393 | 367 | 101.4 |
| C | 12 | 249 | 1096 | 7.19 | 393 | 367 | 101.4 |
| C | 1 | 80 | 1089 | 7.12 | 393 | 367 | 101.4 |
| D | 10 | 190 | 904 | 6.21 | 351 | 319 | 94.2 |
| D | 3 | 14 | 882 | 5.98 | 351 | 319 | 94.2 |
| D | 7 | 3 | 852 | 5.66 | 351 | 319 | 94.2 |
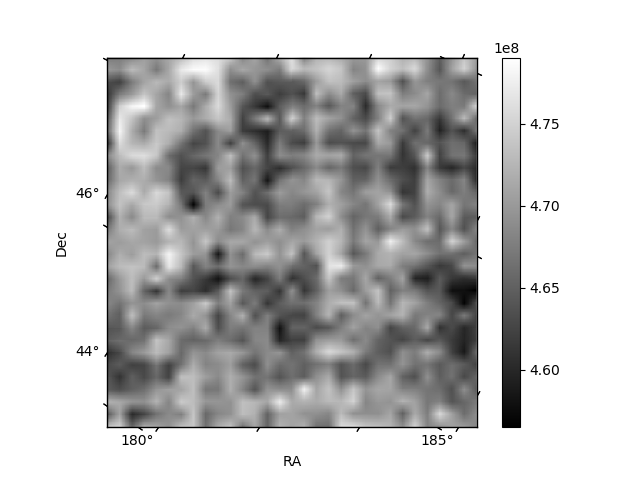
Histogram calculated using DETX and DETY for each event in the final _common_clean file
| Quadrant A |  |
 |
Quadrant B |
|---|---|---|---|
| Quadrant D |  |
 |
Quadrant C |
| Plot type | Count rate plots | Images |
|---|---|---|
| Comparison with Poisson distribution Blue bars denote a histogram of data divided into 1 sec bins. Red curve is a Poisson curve with rate = median count rate of data. |
 |
 |
| Quadrant-wise count rates Data is divided into 100 sec bins |
 |
|
| Module-wise count rates for Quadrant A Data is divided into 100 sec bins |
 |
 |
| Module-wise count rates for Quadrant B Data is divided into 100 sec bins |
 |
 |
| Module-wise count rates for Quadrant C Data is divided into 100 sec bins |
 |
 |
| Module-wise count rates for Quadrant D Data is divided into 100 sec bins |
 |
 |
| Parameter | Plot |
|---|---|
| CZT HV Monitor |  |
| D_VDD | 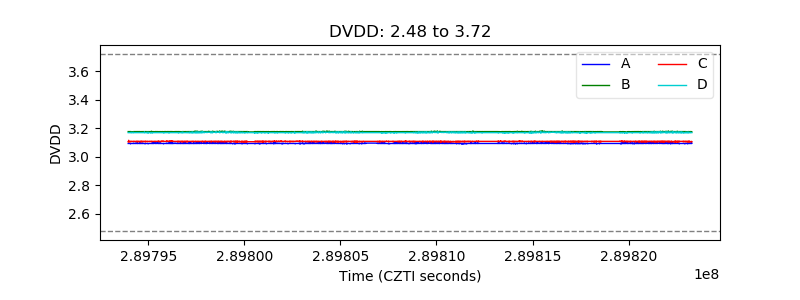 |
| Temperature 1 |  |
| Veto HV Monitor |  |
| Veto LLD |  |
| Alpha Counter |  |
| _CPM_Rate |  |
| CZT Counter |  |
| +2.5 Volts monitor |  |
| +5 Volts monitor |  |
| _ROLL_ROT |  |
| _Roll_DEC |  |
| _Roll_RA |  |
| Veto Counter |  |