| Param | Original file | Final file |
|---|---|---|
| Filename | modeM0/AS1A05_104T07_9000002780_18619cztM0_level2.evt | modeM0/AS1A05_104T07_9000002780_18619cztM0_level2_quad_clean.evt |
| Size (bytes) | 131,002,560 | 33,350,400 |
| Size | 124.9 MB | 31.8 MB |
| Events in quadrant A | 1,189,677 | 214,001 |
| Events in quadrant B | 890,498 | 226,859 |
| Events in quadrant C | 857,071 | 221,086 |
| Events in quadrant D | 906,040 | 216,774 |
| Mode M0 | |||
|---|---|---|---|
| Quadrant | BADHDUFLAG | Total packets | Discarded packets |
| A | 0 | 4791 | 2 |
| B | 0 | 3934 | 3 |
| C | 0 | 3831 | 2 |
| D | 0 | 3990 | 2 |
| Mode SS | |||
|---|---|---|---|
| Quadrant | BADHDUFLAG | Total packets | Discarded packets |
| A | 0 | 38 | 0 |
| B | 0 | 38 | 0 |
| C | 0 | 38 | 0 |
| D | 0 | 38 | 0 |
| Mode M9 | |||
|---|---|---|---|
| Quadrant | BADHDUFLAG | Total packets | Discarded packets |
| A | 0 | 1 | 0 |
| B | 0 | 1 | 0 |
| C | 0 | 1 | 0 |
| D | 0 | 1 | 0 |
| Quadrant | Total seconds | Saturated seconds | Saturation percentage |
|---|---|---|---|
| A | 1785 | 190 | 10.644258% |
| B | 1784 | 119 | 6.670404% |
| C | 1784 | 99 | 5.549327% |
| D | 1784 | 86 | 4.820628% |
Noise dominated data is calculated using 1-second bins in cleaned event files. If a bin has >2000 counts, and if more than 50% of those come from <1% of pixels, then it is considered to be noise-dominated and hence unusable.
| Quadrant | # 1 sec bins | Bins with >0 counts | Bins with >2000 counts | High rate bins dominated by noise | Noise dominated (total time) | Noise dominated (detector-on time) | Marked lightcurve |
|---|---|---|---|---|---|---|---|
| A | 1915 | 1787 | 81 | 81 | 4.23% | 4.53% | 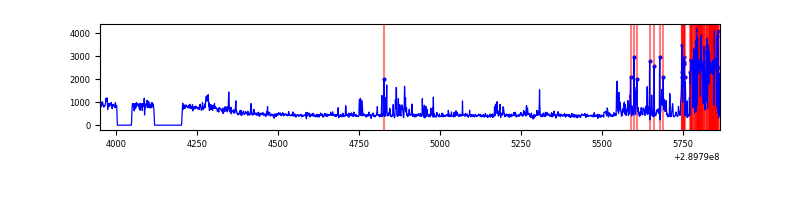 |
| B | 1914 | 1786 | 0 | 0 | 0.00% | 0.00% | 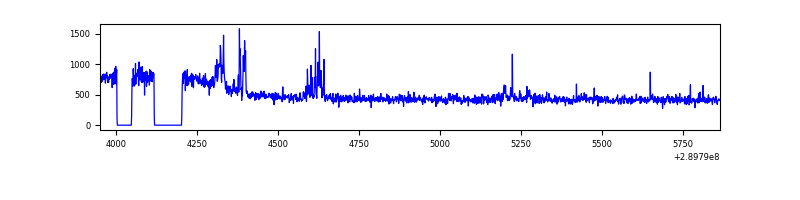 |
| C | 1914 | 1786 | 0 | 0 | 0.00% | 0.00% | 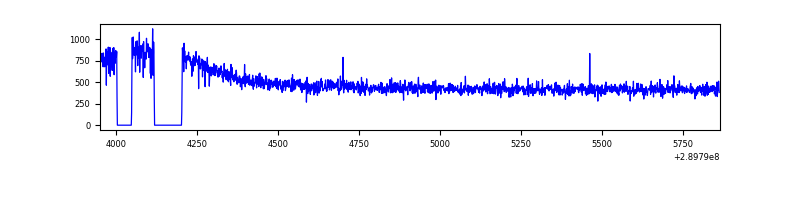 |
| D | 1914 | 1786 | 5 | 5 | 0.26% | 0.28% | 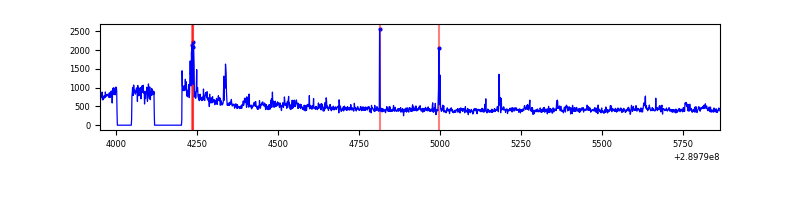 |
Top three noisy pixels from each quadrant. If the there are fewer than three noisy pixels in the level2.evt file, extra rows are filled as -1
| Pixel properties | Quadrant properties | ||||||
|---|---|---|---|---|---|---|---|
| Quadrant | DetID | PixID | Counts | Sigma | Mean | Median | Sigma |
| A | 14 | 111 | 370227 | 8286.41 | 210 | 205 | 44.7 |
| A | 9 | 143 | 6570 | 142.54 | 210 | 205 | 44.7 |
| A | 0 | 13 | 3877 | 82.23 | 210 | 205 | 44.7 |
| B | 0 | 230 | 38668 | 864.89 | 217 | 210 | 44.5 |
| B | 12 | 111 | 5381 | 116.29 | 217 | 210 | 44.5 |
| B | 11 | 111 | 4506 | 96.61 | 217 | 210 | 44.5 |
| C | 14 | 238 | 31723 | 617.08 | 210 | 211 | 51.1 |
| C | 3 | 233 | 3642 | 67.19 | 210 | 211 | 51.1 |
| C | 13 | 61 | 1485 | 24.95 | 210 | 211 | 51.1 |
| D | 1 | 52 | 79079 | 1493.87 | 210 | 203 | 52.8 |
| D | 7 | 238 | 17966 | 336.42 | 210 | 203 | 52.8 |
| D | 8 | 195 | 9625 | 178.45 | 210 | 203 | 52.8 |
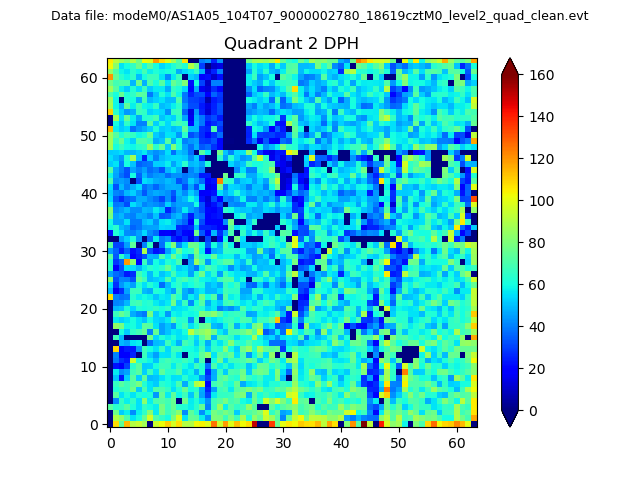
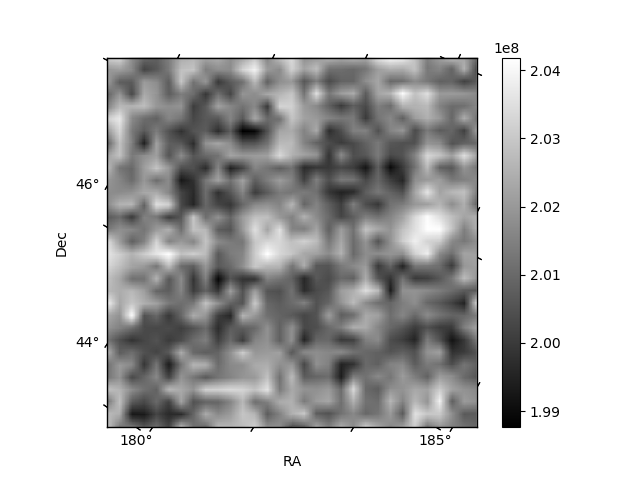
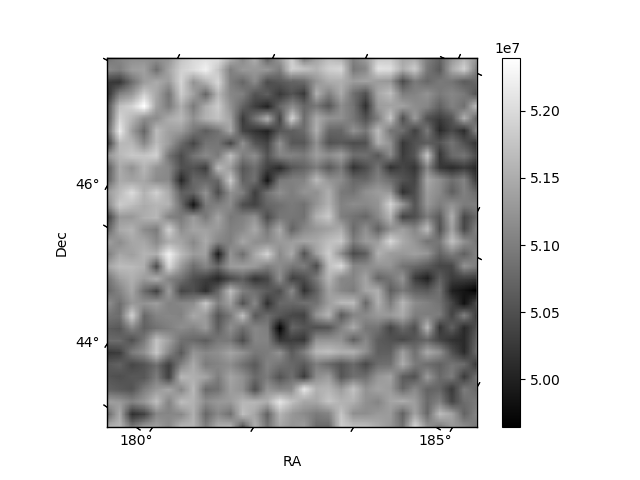
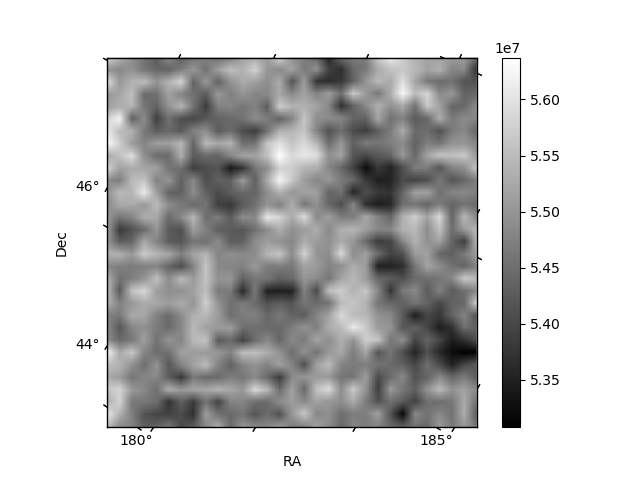
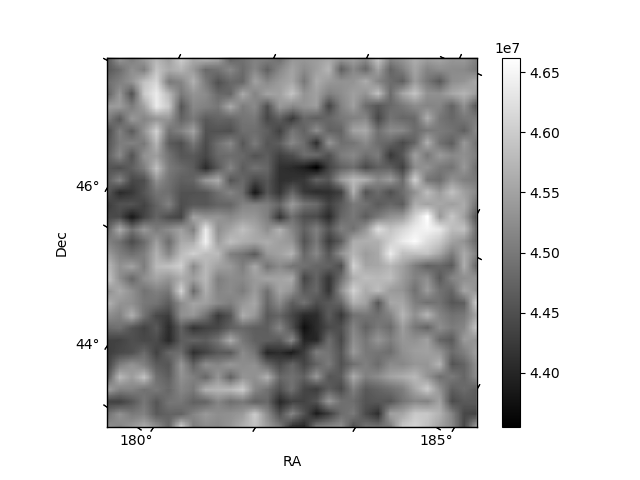
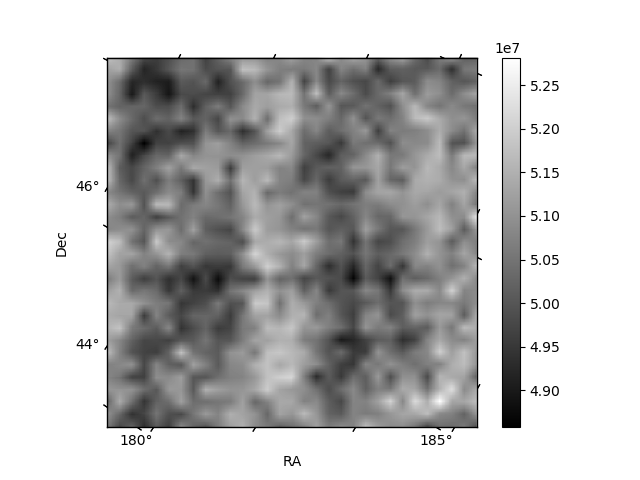
Histogram calculated using DETX and DETY for each event in the final _common_clean file
| Quadrant A | 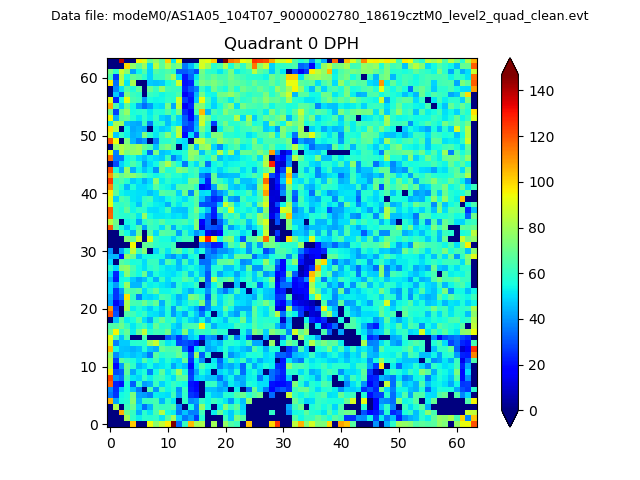 |
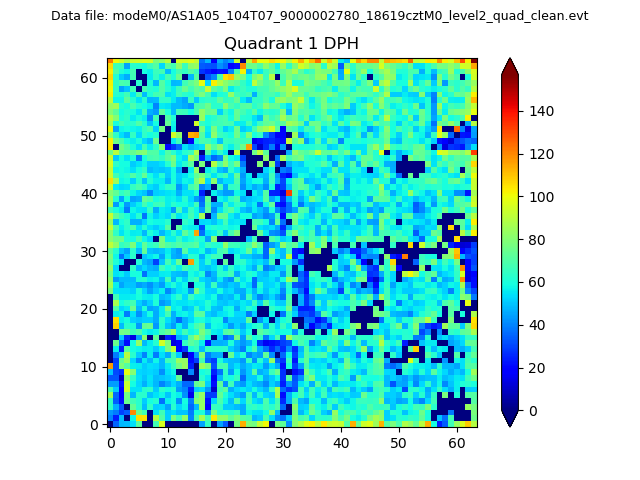 |
Quadrant B |
|---|---|---|---|
| Quadrant D | 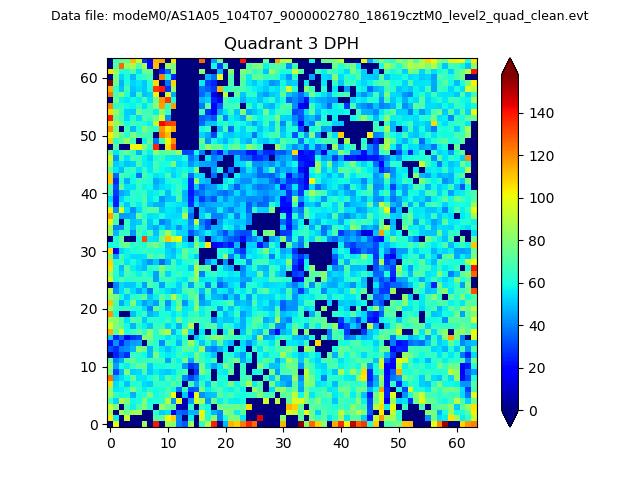 |
 |
Quadrant C |
| Plot type | Count rate plots | Images |
|---|---|---|
| Comparison with Poisson distribution Blue bars denote a histogram of data divided into 1 sec bins. Red curve is a Poisson curve with rate = median count rate of data. |
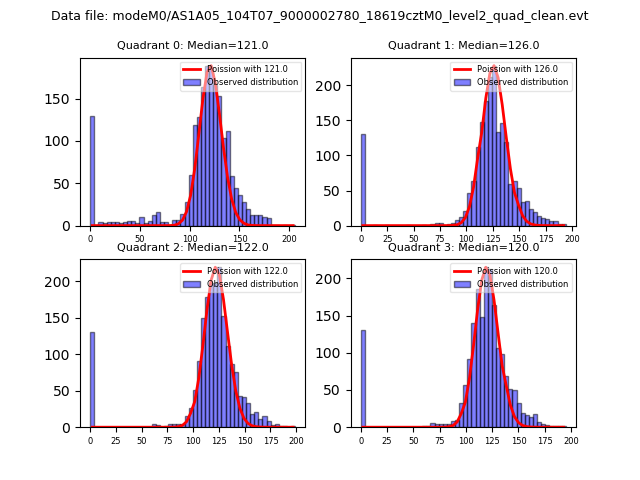 |
 |
| Quadrant-wise count rates Data is divided into 100 sec bins |
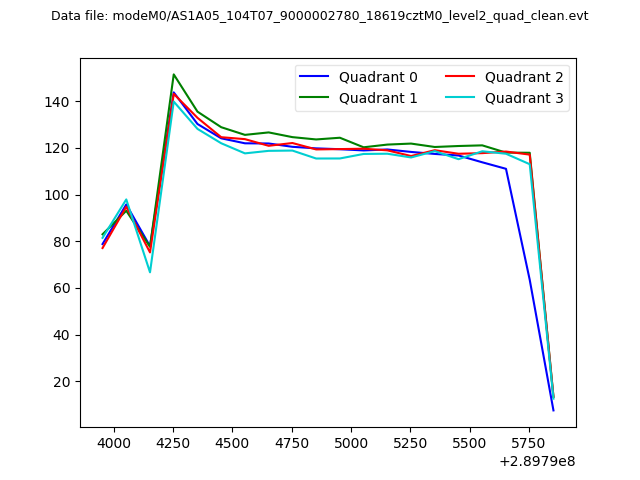 |
|
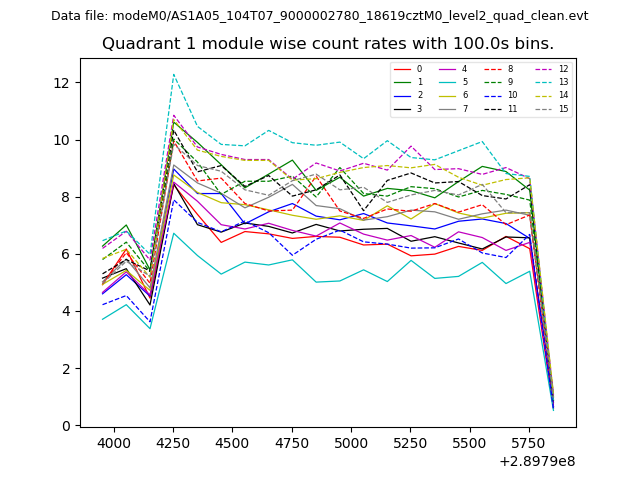
| Module-wise count rates for Quadrant A Data is divided into 100 sec bins |
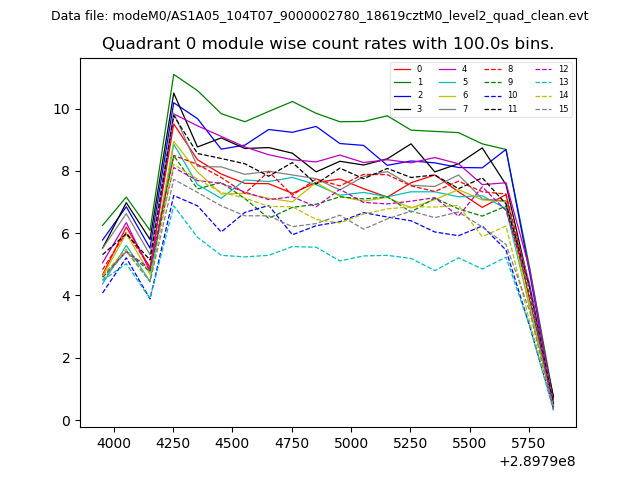 |
 |
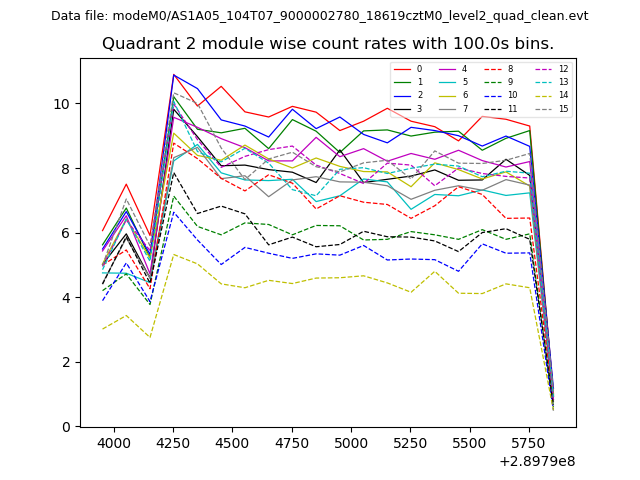
| Module-wise count rates for Quadrant B Data is divided into 100 sec bins |
 |
 |
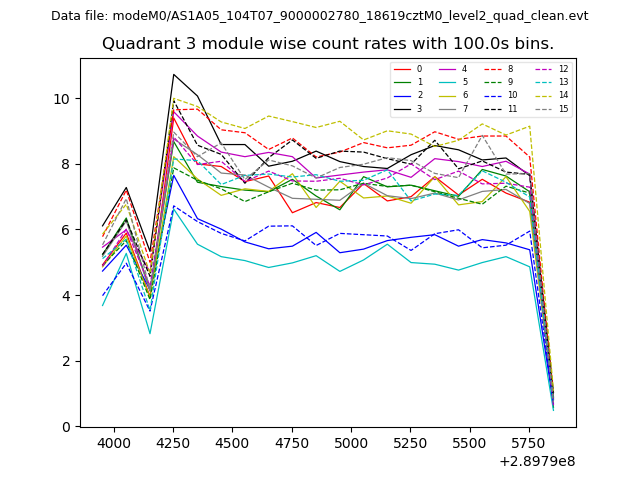
| Module-wise count rates for Quadrant C Data is divided into 100 sec bins |
 |
 |
| Module-wise count rates for Quadrant D Data is divided into 100 sec bins |
 |
 |
| Parameter | Plot |
|---|---|
| CZT HV Monitor | 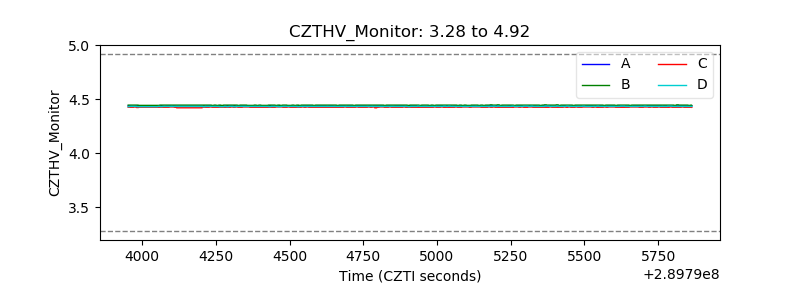 |
| D_VDD | 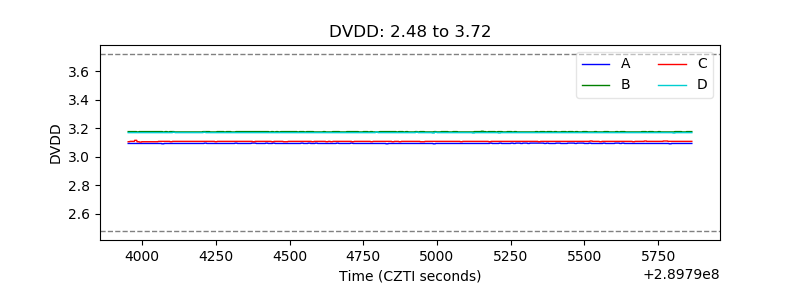 |
| Temperature 1 | 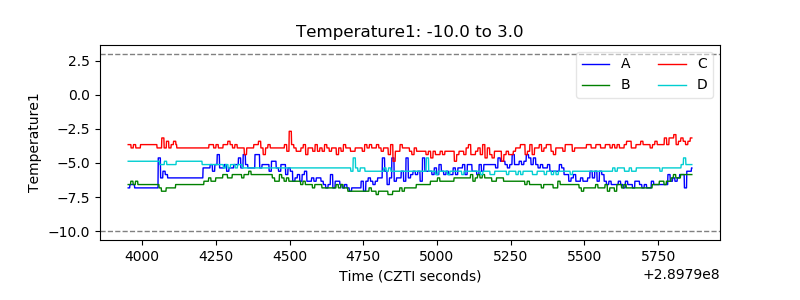 |
| Veto HV Monitor | 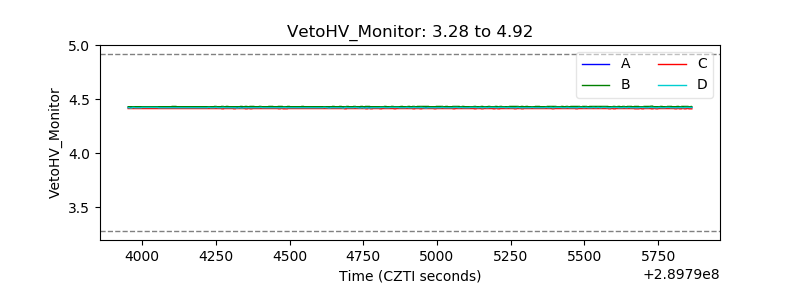 |
| Veto LLD | 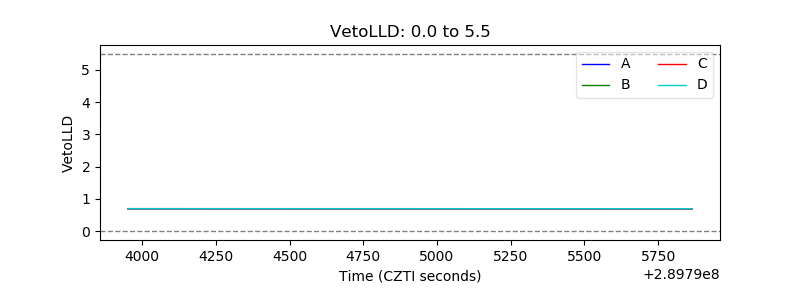 |
| Alpha Counter | 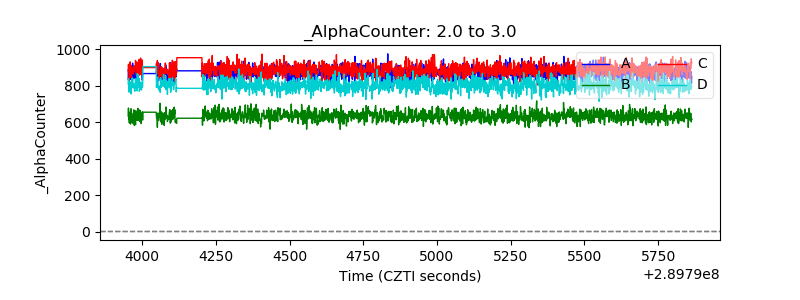 |
| _CPM_Rate | 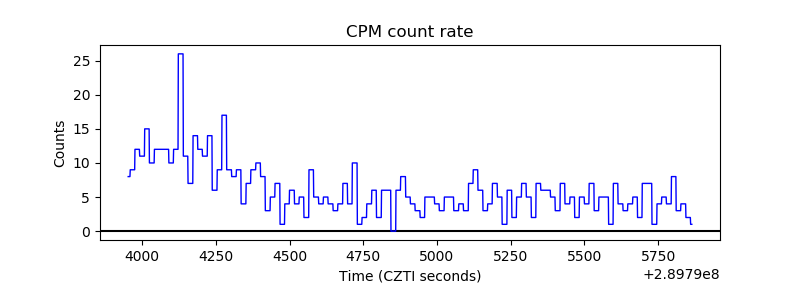 |
| CZT Counter | 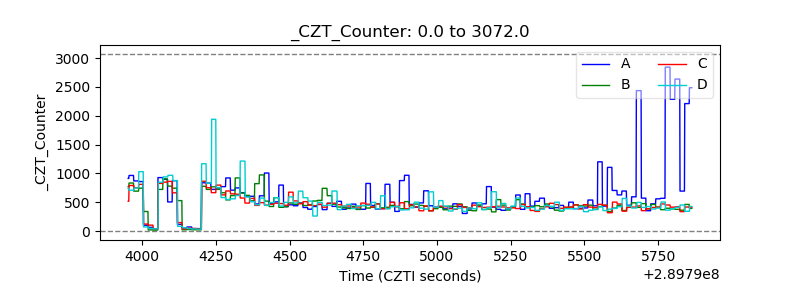 |
| +2.5 Volts monitor |  |
| +5 Volts monitor |  |
| _ROLL_ROT | 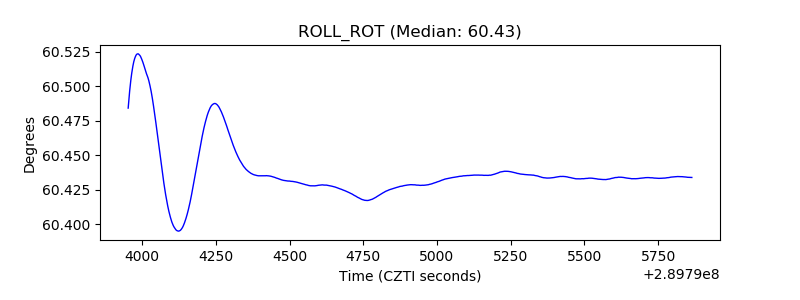 |
| _Roll_DEC | 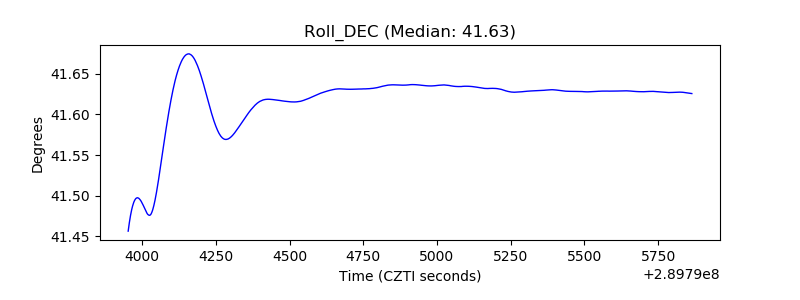 |
| _Roll_RA | 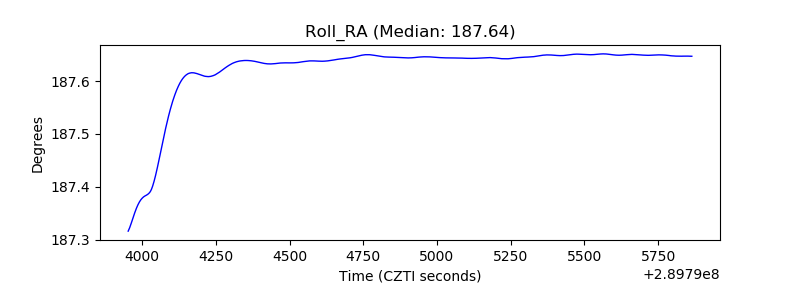 |
| Veto Counter | 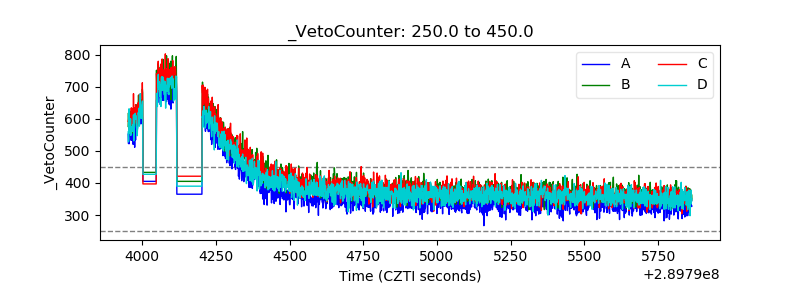 |