| Param | Original file | Final file |
|---|---|---|
| Filename | modeM0/AS1A05_104T07_9000002780_18622cztM0_level2.evt | modeM0/AS1A05_104T07_9000002780_18622cztM0_level2_quad_clean.evt |
| Size (bytes) | 1,134,253,440 | 154,690,560 |
| Size | 1.1 GB | 147.5 MB |
| Events in quadrant A | 6,939,957 | 953,485 |
| Events in quadrant B | 6,335,768 | 986,615 |
| Events in quadrant C | 6,088,859 | 961,323 |
| Events in quadrant D | 14,113,786 | 890,213 |
| Mode M0 | |||
|---|---|---|---|
| Quadrant | BADHDUFLAG | Total packets | Discarded packets |
| A | 0 | 29067 | 3 |
| B | 0 | 27059 | 3 |
| C | 0 | 26436 | 3 |
| D | 0 | 50670 | 3 |
| Mode SS | |||
|---|---|---|---|
| Quadrant | BADHDUFLAG | Total packets | Discarded packets |
| A | 0 | 262 | 0 |
| B | 0 | 262 | 0 |
| C | 0 | 262 | 0 |
| D | 0 | 262 | 0 |
| Mode M9 | |||
|---|---|---|---|
| Quadrant | BADHDUFLAG | Total packets | Discarded packets |
| A | 0 | 15 | 0 |
| B | 0 | 16 | 0 |
| C | 0 | 16 | 0 |
| D | 0 | 16 | 0 |
| Quadrant | Total seconds | Saturated seconds | Saturation percentage |
|---|---|---|---|
| A | 12919 | 448 | 3.467761% |
| B | 12919 | 222 | 1.718399% |
| C | 12919 | 170 | 1.315891% |
| D | 12919 | 2467 | 19.095905% |
Noise dominated data is calculated using 1-second bins in cleaned event files. If a bin has >2000 counts, and if more than 50% of those come from <1% of pixels, then it is considered to be noise-dominated and hence unusable.
| Quadrant | # 1 sec bins | Bins with >0 counts | Bins with >2000 counts | High rate bins dominated by noise | Noise dominated (total time) | Noise dominated (detector-on time) | Marked lightcurve |
|---|---|---|---|---|---|---|---|
| A | 14189 | 12920 | 239 | 239 | 1.68% | 1.85% |  |
| B | 14189 | 12920 | 32 | 32 | 0.23% | 0.25% | 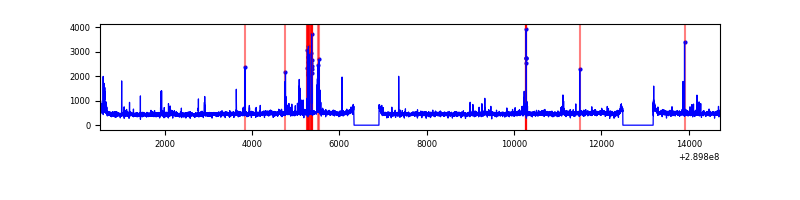 |
| C | 14189 | 12920 | 0 | 0 | 0.00% | 0.00% | 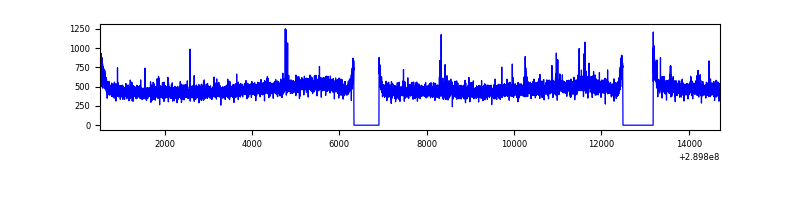 |
| D | 14189 | 12920 | 2139 | 2139 | 15.08% | 16.56% | 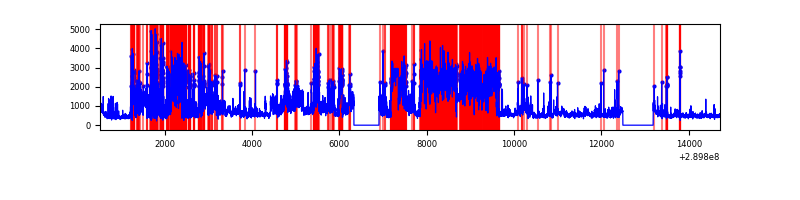 |
Top three noisy pixels from each quadrant. If the there are fewer than three noisy pixels in the level2.evt file, extra rows are filled as -1
| Pixel properties | Quadrant properties | ||||||
|---|---|---|---|---|---|---|---|
| Quadrant | DetID | PixID | Counts | Sigma | Mean | Median | Sigma |
| A | 14 | 111 | 1010251 | 3251.78 | 1522 | 1487 | 310.2 |
| A | 9 | 143 | 46619 | 145.48 | 1522 | 1487 | 310.2 |
| A | 13 | 254 | 19668 | 58.61 | 1522 | 1487 | 310.2 |
| B | 4 | 80 | 235174 | 798.2 | 1531 | 1489 | 292.8 |
| B | 0 | 230 | 56638 | 188.37 | 1531 | 1489 | 292.8 |
| B | 12 | 111 | 37285 | 122.27 | 1531 | 1489 | 292.8 |
| C | 14 | 238 | 228784 | 660.2 | 1478 | 1487 | 344.3 |
| C | 9 | 221 | 53098 | 149.91 | 1478 | 1487 | 344.3 |
| C | 3 | 233 | 35349 | 98.36 | 1478 | 1487 | 344.3 |
| D | 1 | 52 | 8551060 | 25308.12 | 1390 | 1351 | 337.8 |
| D | 7 | 238 | 173337 | 509.1 | 1390 | 1351 | 337.8 |
| D | 14 | 34 | 77524 | 225.48 | 1390 | 1351 | 337.8 |
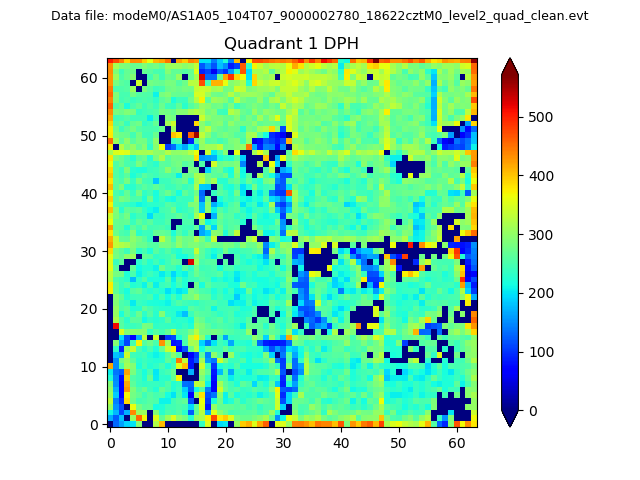
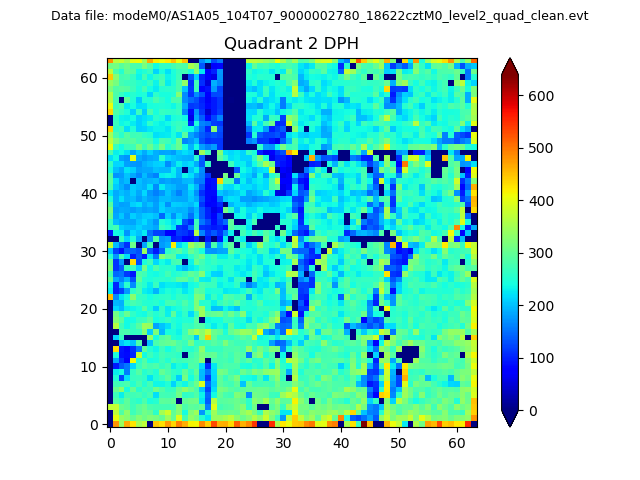
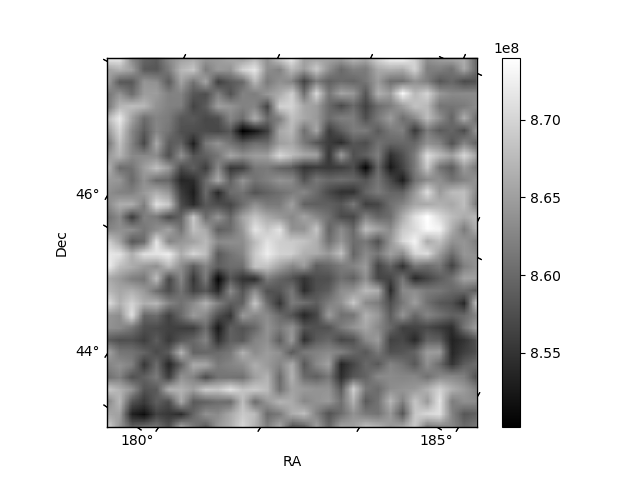
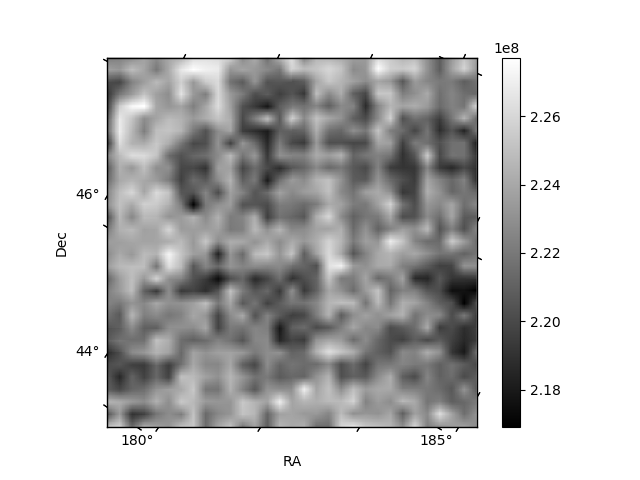
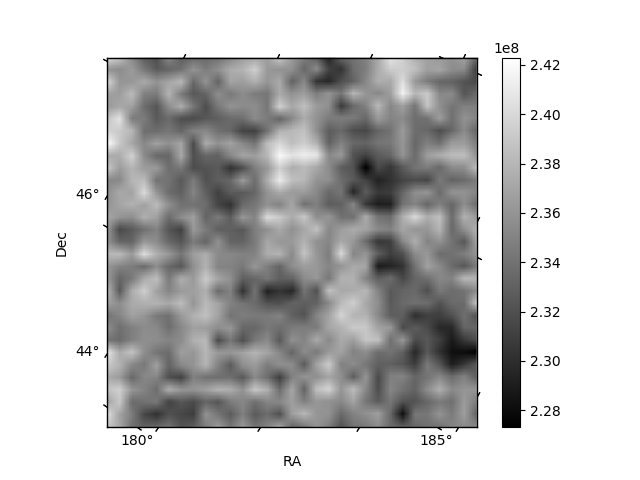
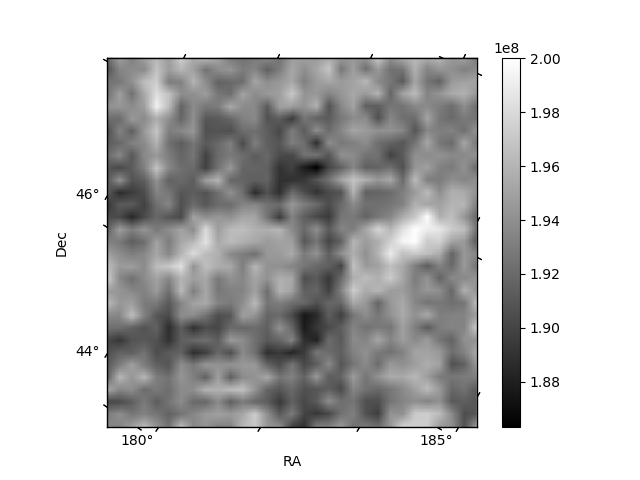
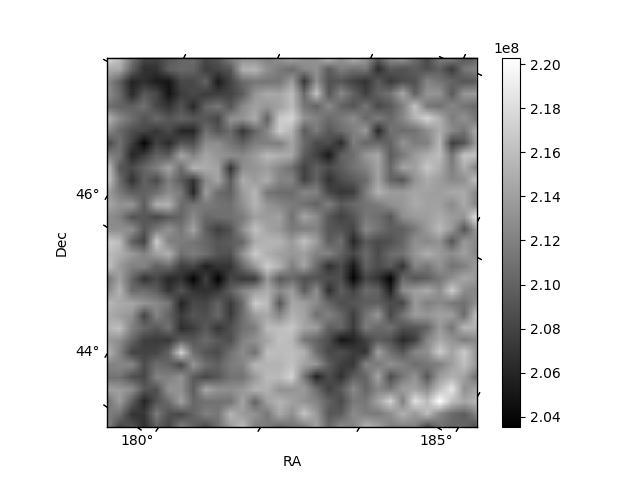
Histogram calculated using DETX and DETY for each event in the final _common_clean file
| Quadrant A | 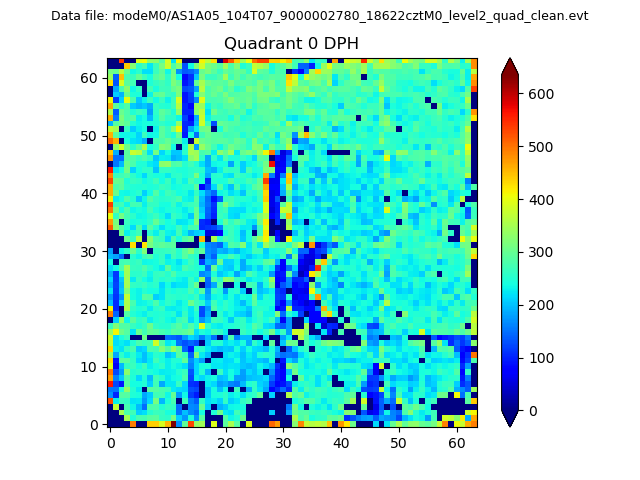 |
 |
Quadrant B |
|---|---|---|---|
| Quadrant D | 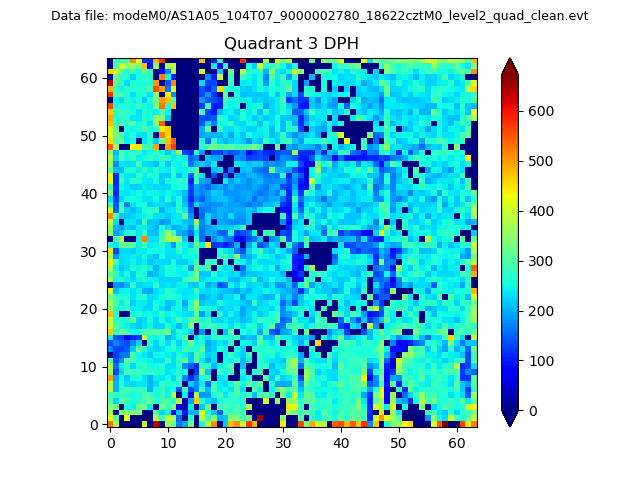 |
 |
Quadrant C |
| Plot type | Count rate plots | Images |
|---|---|---|
| Comparison with Poisson distribution Blue bars denote a histogram of data divided into 1 sec bins. Red curve is a Poisson curve with rate = median count rate of data. |
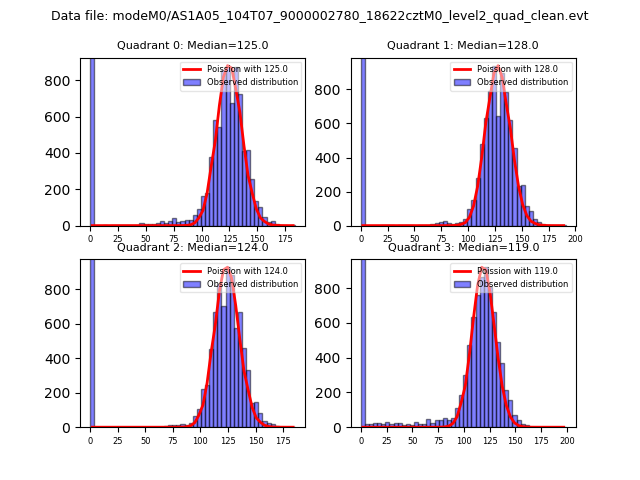 |
 |
| Quadrant-wise count rates Data is divided into 100 sec bins |
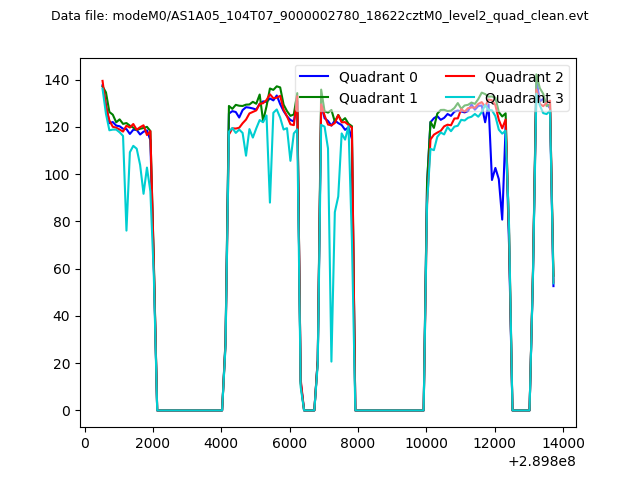 |
|
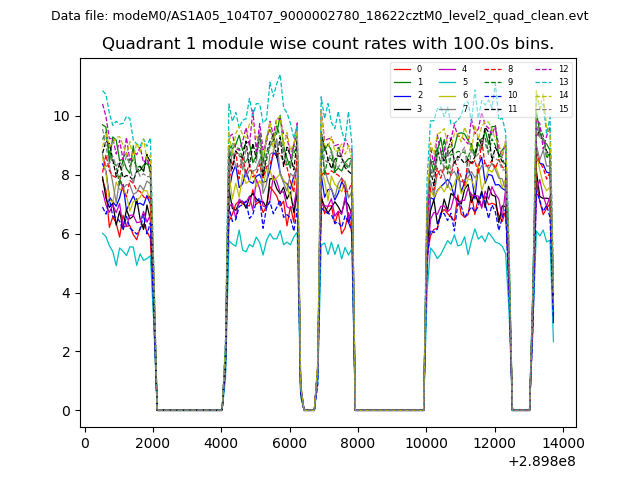
| Module-wise count rates for Quadrant A Data is divided into 100 sec bins |
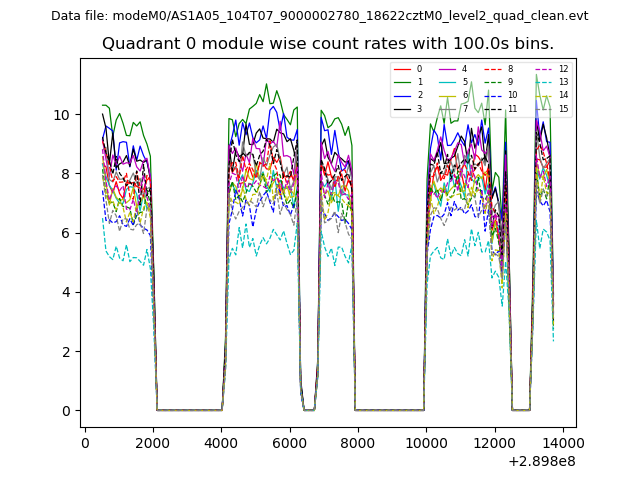 |
 |
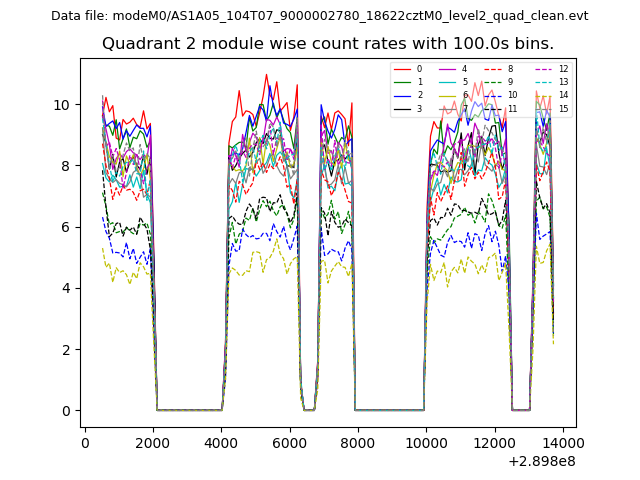
| Module-wise count rates for Quadrant B Data is divided into 100 sec bins |
 |
 |
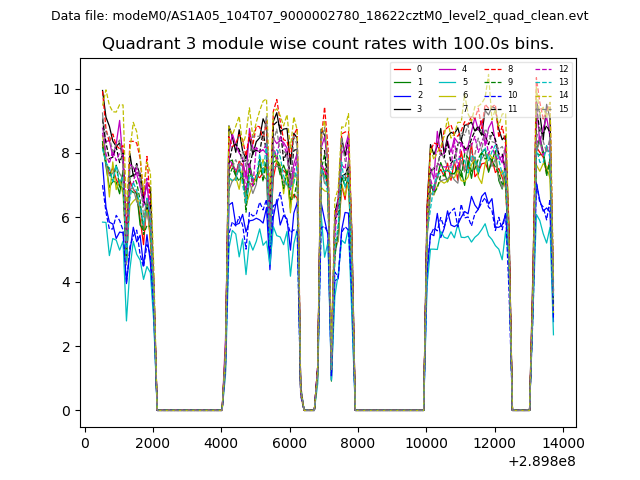
| Module-wise count rates for Quadrant C Data is divided into 100 sec bins |
 |
 |
| Module-wise count rates for Quadrant D Data is divided into 100 sec bins |
 |
 |
| Parameter | Plot |
|---|---|
| CZT HV Monitor | 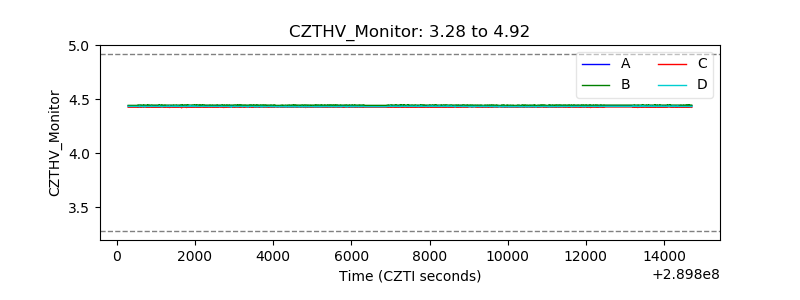 |
| D_VDD | 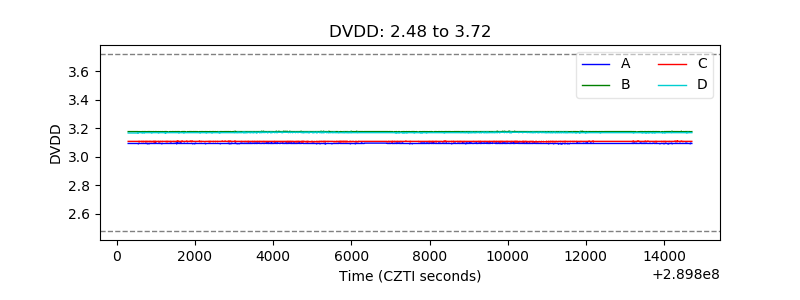 |
| Temperature 1 | 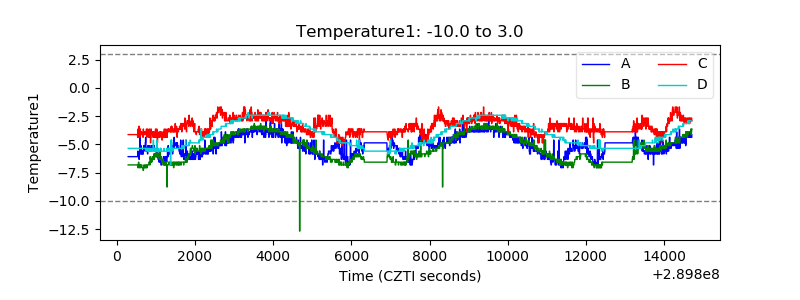 |
| Veto HV Monitor | 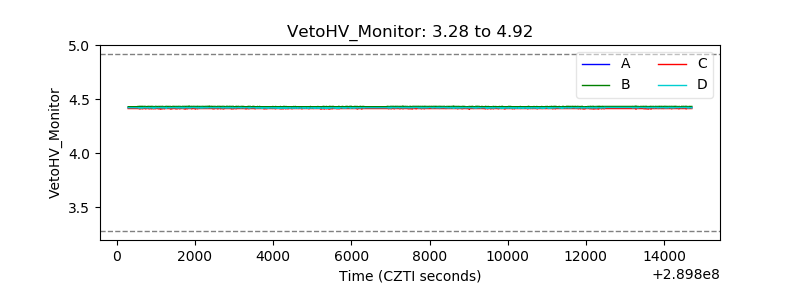 |
| Veto LLD | 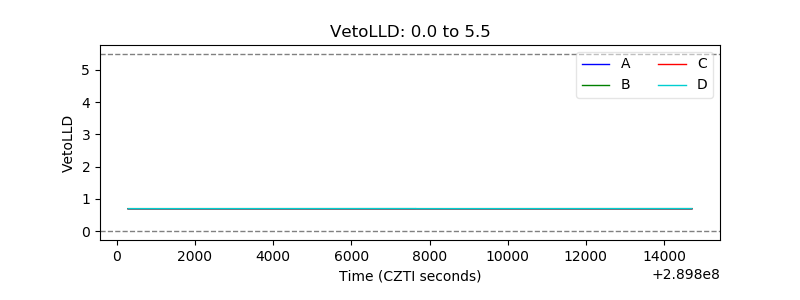 |
| Alpha Counter | 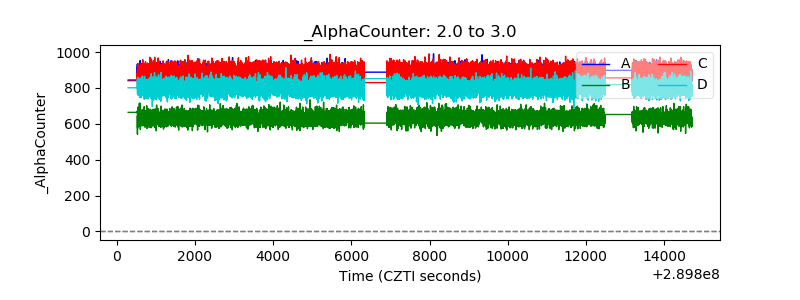 |
| _CPM_Rate | 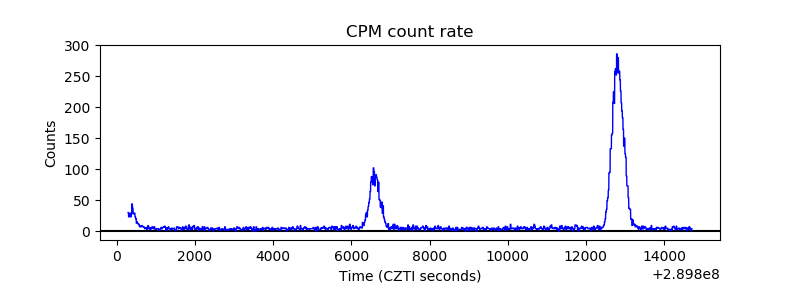 |
| CZT Counter | 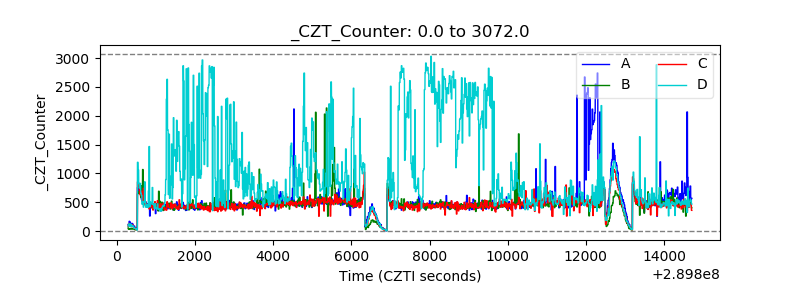 |
| +2.5 Volts monitor |  |
| +5 Volts monitor |  |
| _ROLL_ROT | 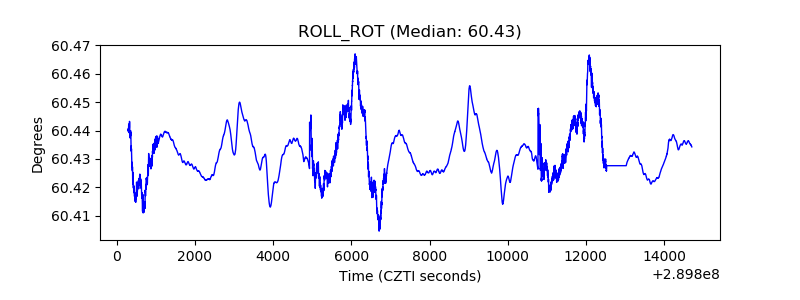 |
| _Roll_DEC |  |
| _Roll_RA | 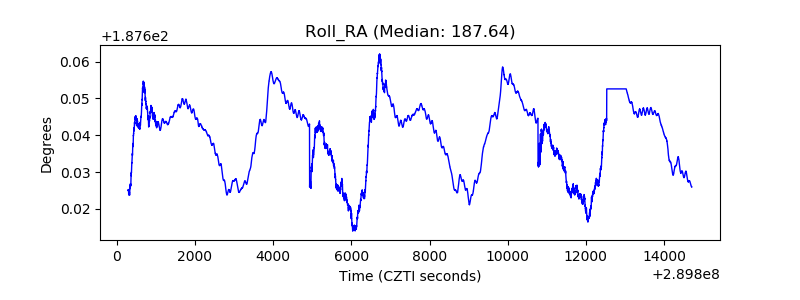 |
| Veto Counter | 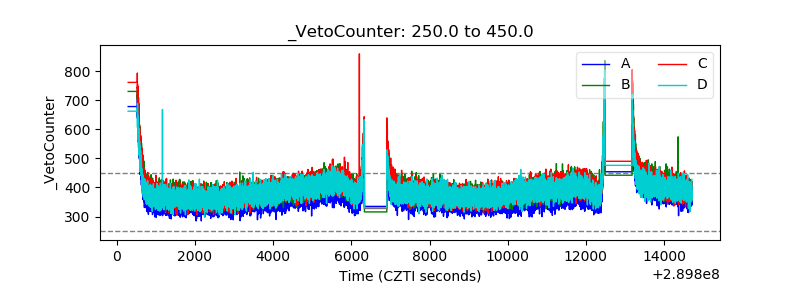 |