| Param | Original file | Final file |
|---|---|---|
| Filename | modeM0/AS1A05_104T07_9000002780_18624cztM0_level2.evt | modeM0/AS1A05_104T07_9000002780_18624cztM0_level2_quad_clean.evt |
| Size (bytes) | 284,999,040 | 36,100,800 |
| Size | 271.8 MB | 34.4 MB |
| Events in quadrant A | 2,019,820 | 211,428 |
| Events in quadrant B | 1,968,302 | 213,709 |
| Events in quadrant C | 1,827,599 | 202,967 |
| Events in quadrant D | 2,557,598 | 197,496 |
| Mode M0 | |||
|---|---|---|---|
| Quadrant | BADHDUFLAG | Total packets | Discarded packets |
| A | 0 | 8352 | 1 |
| B | 0 | 8171 | 1 |
| C | 0 | 7709 | 1 |
| D | 0 | 10075 | 1 |
| Mode SS | |||
|---|---|---|---|
| Quadrant | BADHDUFLAG | Total packets | Discarded packets |
| A | 0 | 76 | 0 |
| B | 0 | 76 | 0 |
| C | 0 | 76 | 0 |
| D | 0 | 76 | 0 |
| Mode M9 | |||
|---|---|---|---|
| Quadrant | BADHDUFLAG | Total packets | Discarded packets |
| A | 0 | 6 | 0 |
| B | 0 | 7 | 0 |
| C | 0 | 7 | 0 |
| D | 0 | 7 | 0 |
| Quadrant | Total seconds | Saturated seconds | Saturation percentage |
|---|---|---|---|
| A | 3776 | 31 | 0.820975% |
| B | 3776 | 17 | 0.450212% |
| C | 3776 | 20 | 0.529661% |
| D | 3776 | 65 | 1.721398% |
Noise dominated data is calculated using 1-second bins in cleaned event files. If a bin has >2000 counts, and if more than 50% of those come from <1% of pixels, then it is considered to be noise-dominated and hence unusable.
| Quadrant | # 1 sec bins | Bins with >0 counts | Bins with >2000 counts | High rate bins dominated by noise | Noise dominated (total time) | Noise dominated (detector-on time) | Marked lightcurve |
|---|---|---|---|---|---|---|---|
| A | 3776 | 3776 | 5 | 5 | 0.13% | 0.13% | 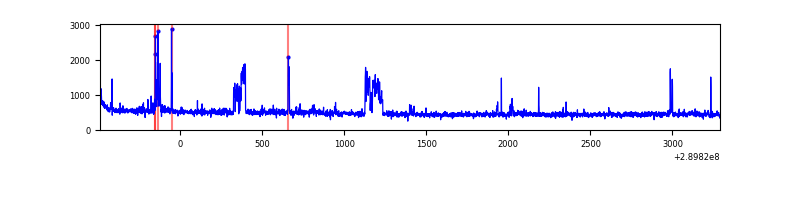 |
| B | 3776 | 3776 | 2 | 2 | 0.05% | 0.05% | 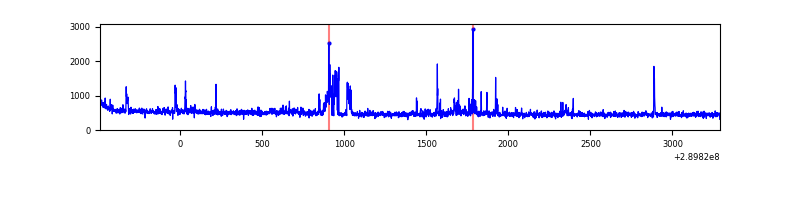 |
| C | 3776 | 3776 | 0 | 0 | 0.00% | 0.00% | 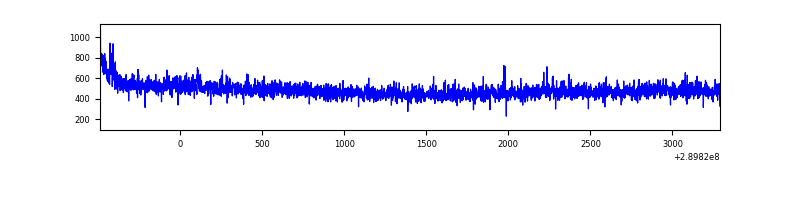 |
| D | 3776 | 3776 | 39 | 39 | 1.03% | 1.03% | 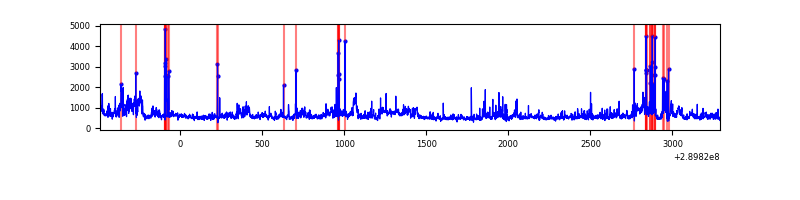 |
Top three noisy pixels from each quadrant. If the there are fewer than three noisy pixels in the level2.evt file, extra rows are filled as -1
| Pixel properties | Quadrant properties | ||||||
|---|---|---|---|---|---|---|---|
| Quadrant | DetID | PixID | Counts | Sigma | Mean | Median | Sigma |
| A | 14 | 111 | 198085 | 2100.2 | 464 | 454 | 94.1 |
| A | 0 | 13 | 31700 | 332.05 | 464 | 454 | 94.1 |
| A | 13 | 254 | 4963 | 47.92 | 464 | 454 | 94.1 |
| B | 4 | 80 | 82047 | 917.12 | 458 | 447 | 89.0 |
| B | 0 | 230 | 66919 | 747.09 | 458 | 447 | 89.0 |
| B | 4 | 216 | 18803 | 206.31 | 458 | 447 | 89.0 |
| C | 14 | 238 | 69620 | 655.77 | 443 | 445 | 105.5 |
| C | 9 | 221 | 18080 | 167.18 | 443 | 445 | 105.5 |
| C | 3 | 233 | 13561 | 124.34 | 443 | 445 | 105.5 |
| D | 1 | 52 | 566951 | 5124.82 | 448 | 434 | 110.5 |
| D | 7 | 238 | 286234 | 2585.4 | 448 | 434 | 110.5 |
| D | 2 | 234 | 13437 | 117.63 | 448 | 434 | 110.5 |
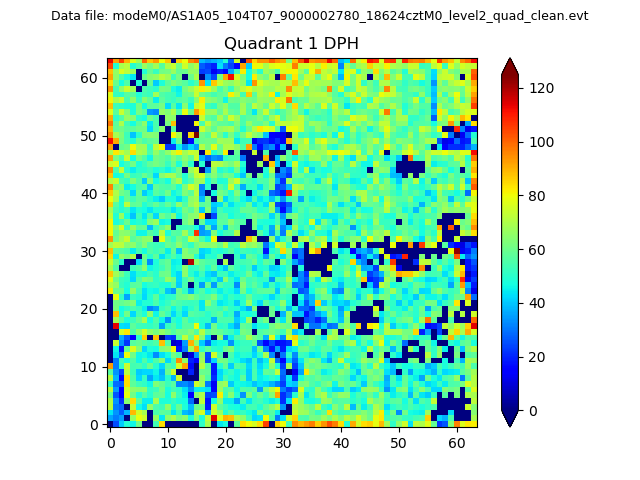
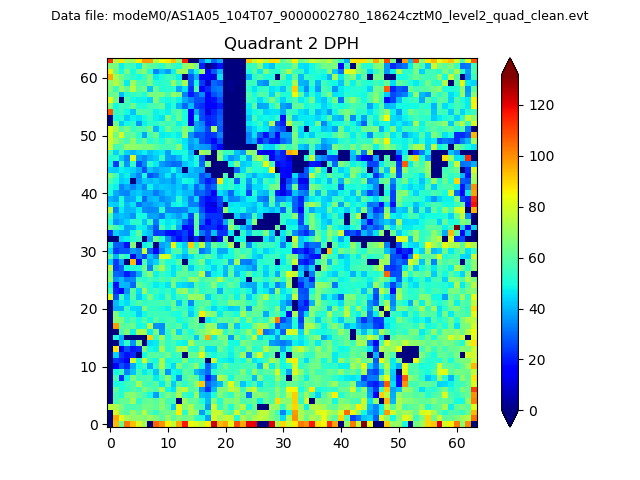
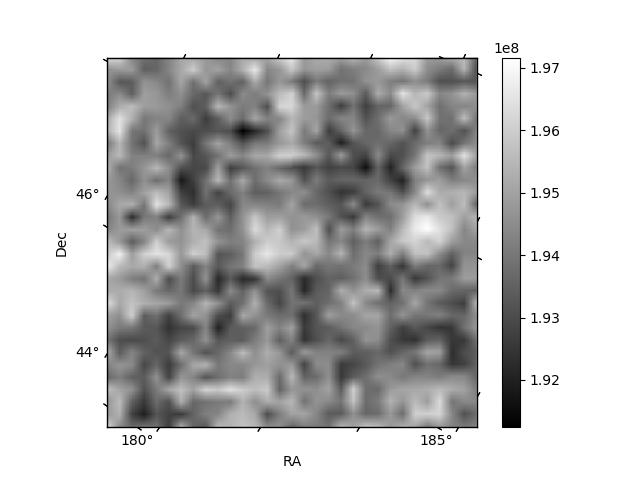
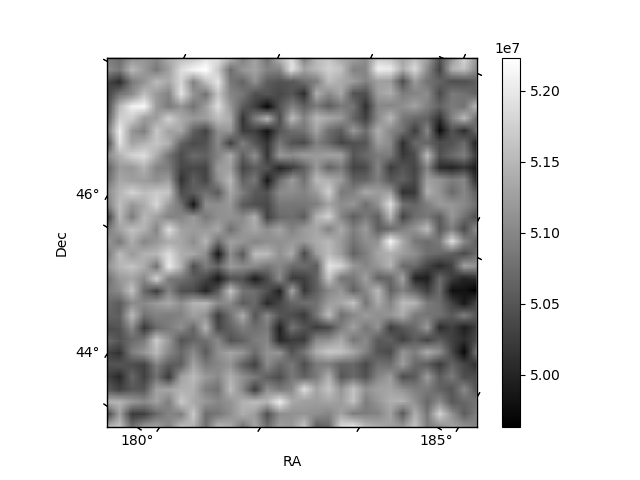
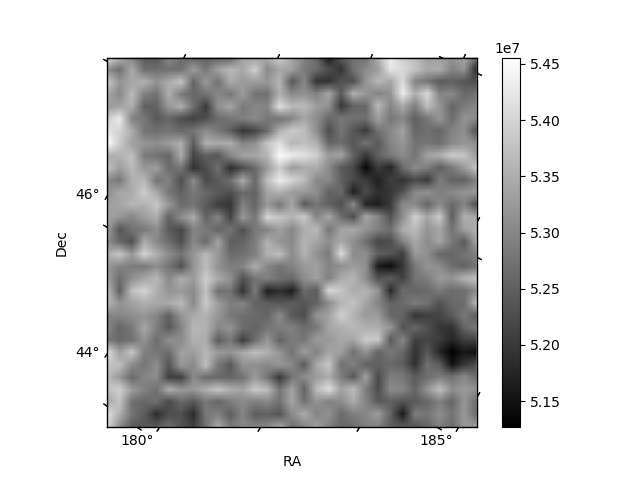
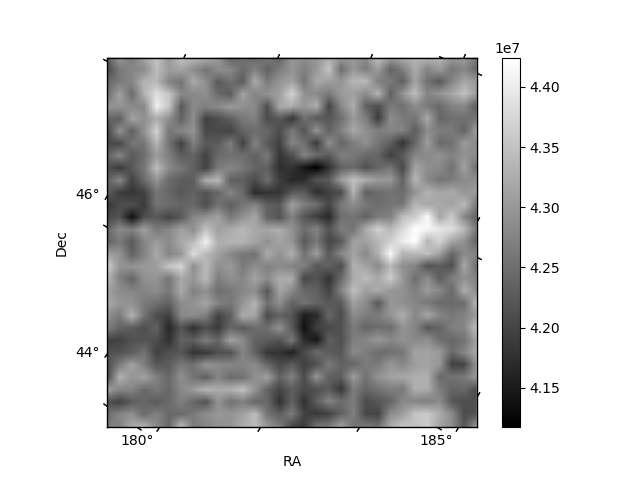
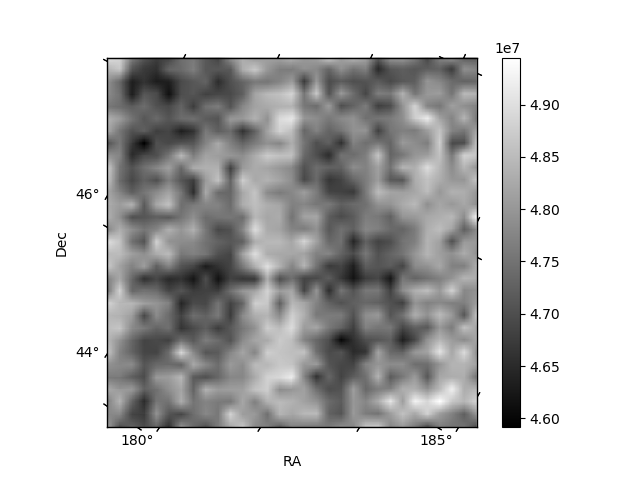
Histogram calculated using DETX and DETY for each event in the final _common_clean file
| Quadrant A |  |
 |
Quadrant B |
|---|---|---|---|
| Quadrant D | 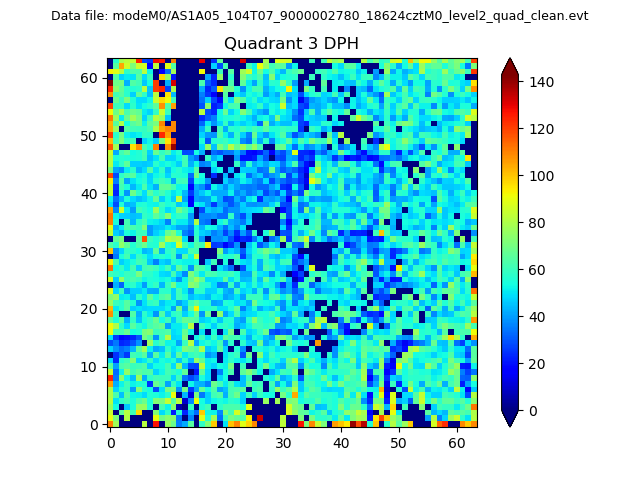 |
 |
Quadrant C |
| Plot type | Count rate plots | Images |
|---|---|---|
| Comparison with Poisson distribution Blue bars denote a histogram of data divided into 1 sec bins. Red curve is a Poisson curve with rate = median count rate of data. |
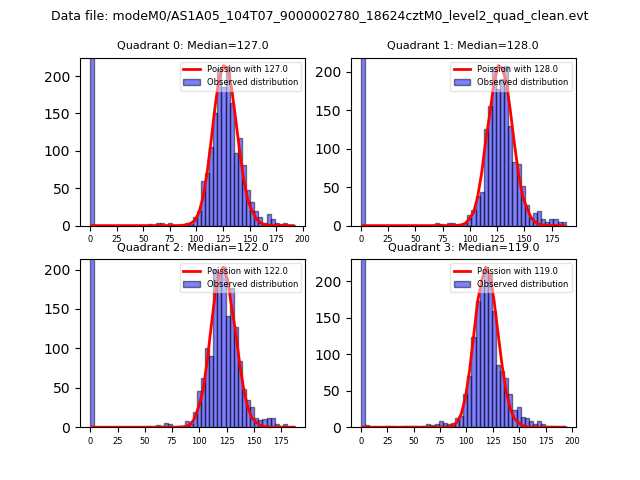 |
 |
| Quadrant-wise count rates Data is divided into 100 sec bins |
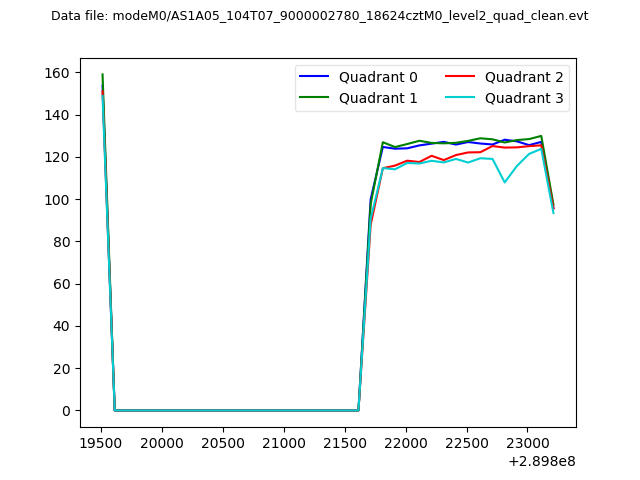 |
|
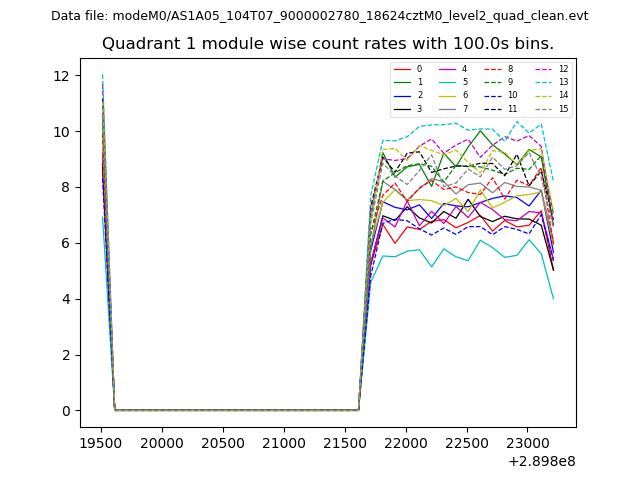
| Module-wise count rates for Quadrant A Data is divided into 100 sec bins |
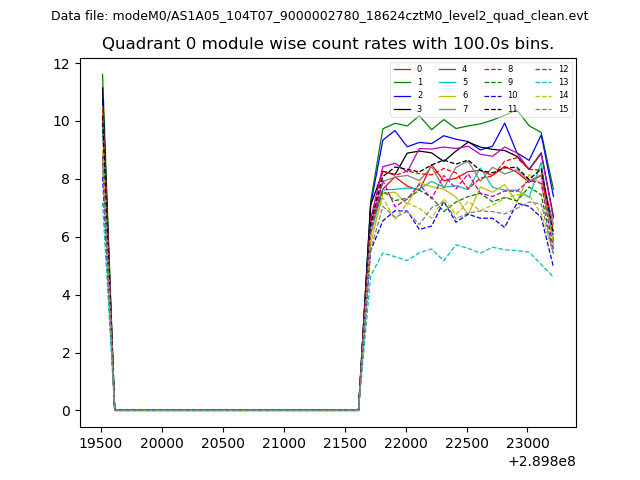 |
 |
| Module-wise count rates for Quadrant B Data is divided into 100 sec bins |
 |
 |
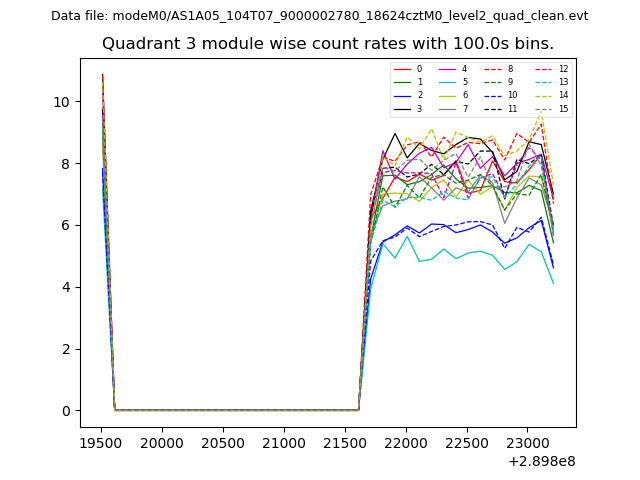
| Module-wise count rates for Quadrant C Data is divided into 100 sec bins |
 |
 |
| Module-wise count rates for Quadrant D Data is divided into 100 sec bins |
 |
 |
| Parameter | Plot |
|---|---|
| CZT HV Monitor | 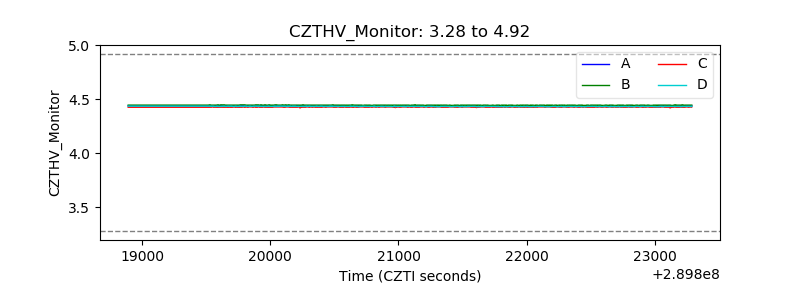 |
| D_VDD | 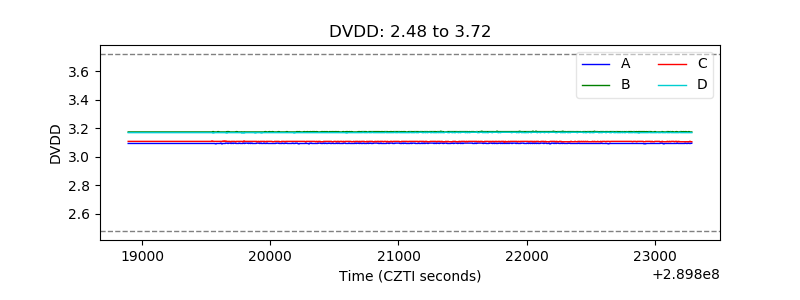 |
| Temperature 1 | 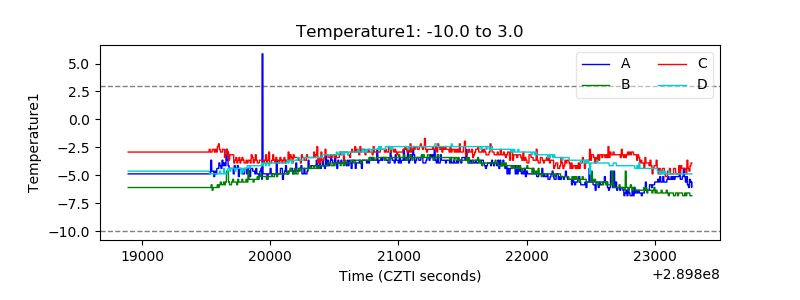 |
| Veto HV Monitor | 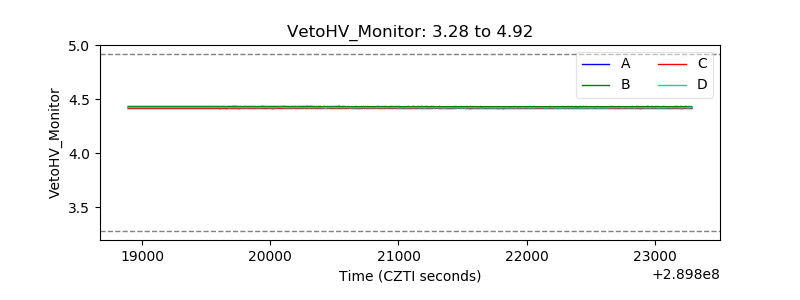 |
| Veto LLD |  |
| Alpha Counter | 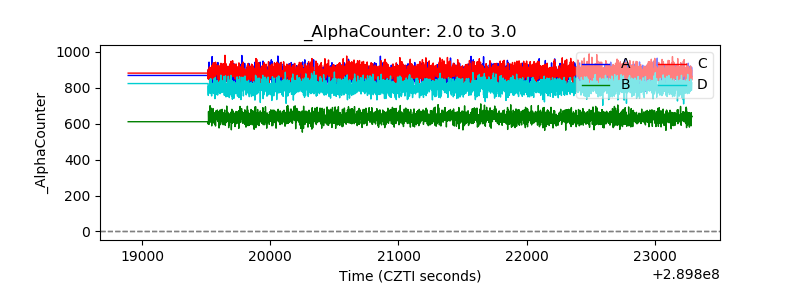 |
| _CPM_Rate | 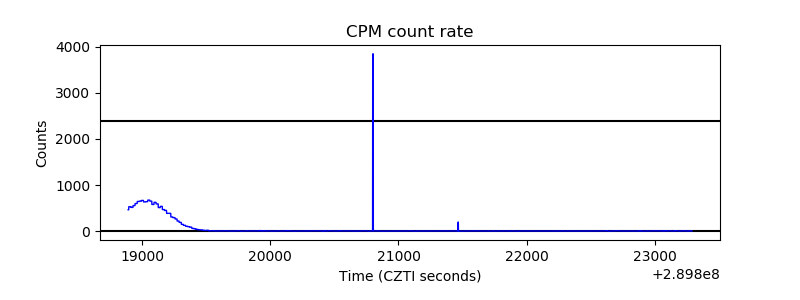 |
| CZT Counter | 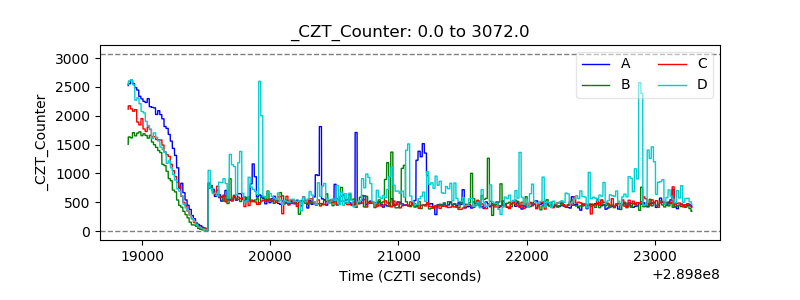 |
| +2.5 Volts monitor |  |
| +5 Volts monitor |  |
| _ROLL_ROT | 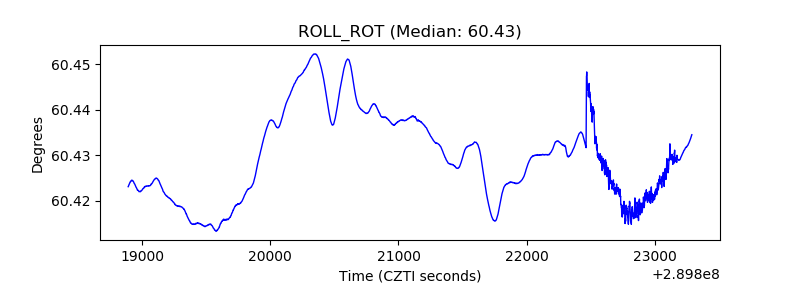 |
| _Roll_DEC | 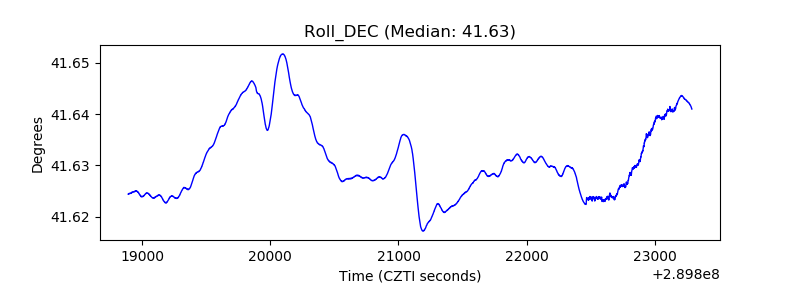 |
| _Roll_RA | 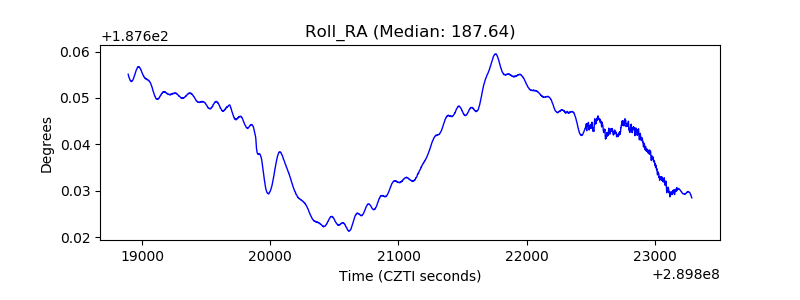 |
| Veto Counter | 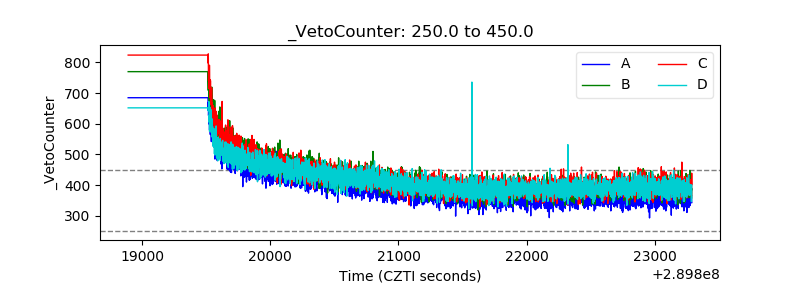 |