| Param | Original file | Final file |
|---|---|---|
| Filename | modeM0/AS1A05_118T04_9000002782cztM0_level2.fits | modeM0/AS1A05_118T04_9000002782cztM0_level2_quad_clean.evt |
| Size (bytes) | 196,056,000 | 151,390,080 |
| Size | 187.0 MB | 144.4 MB |
| Events in quadrant A | 1,225,864 | 863,118 |
| Events in quadrant B | 1,186,830 | 875,154 |
| Events in quadrant C | 1,225,824 | 839,908 |
| Events in quadrant D | 1,068,670 | 775,243 |
| Mode M0 | |||
|---|---|---|---|
| Quadrant | BADHDUFLAG | Total packets | Discarded packets |
| A | 0 | 40378 | 0 |
| B | 0 | 39363 | 0 |
| C | 0 | 40168 | 0 |
| D | 0 | 47298 | 0 |
| Mode M9 | |||
|---|---|---|---|
| Quadrant | BADHDUFLAG | Total packets | Discarded packets |
| A | 0 | 48 | 0 |
| B | 0 | 48 | 0 |
| C | 0 | 48 | 0 |
| D | 0 | 48 | 0 |
| Mode SS | |||
|---|---|---|---|
| Quadrant | BADHDUFLAG | Total packets | Discarded packets |
| A | 0 | 366 | 0 |
| B | 0 | 366 | 0 |
| C | 0 | 366 | 0 |
| D | 0 | 366 | 0 |
| Quadrant | Total seconds | Saturated seconds | Saturation percentage |
|---|---|---|---|
| A | 17849 | 380 | 2.128971% |
| B | 17849 | 292 | 1.635946% |
| C | 17849 | 391 | 2.190599% |
| D | 17849 | 549 | 3.075803% |
Noise dominated data is calculated using 1-second bins in cleaned event files. If a bin has >2000 counts, and if more than 50% of those come from <1% of pixels, then it is considered to be noise-dominated and hence unusable.
| Quadrant | # 1 sec bins | Bins with >0 counts | Bins with >2000 counts | High rate bins dominated by noise | Noise dominated (total time) | Noise dominated (detector-on time) | Marked lightcurve |
|---|---|---|---|---|---|---|---|
| A | 22669 | 17844 | 0 | 0 | 0.00% | 0.00% |  |
| B | 22669 | 17845 | 0 | 0 | 0.00% | 0.00% |  |
| C | 22669 | 17845 | 0 | 0 | 0.00% | 0.00% |  |
| D | 22669 | 17845 | 0 | 0 | 0.00% | 0.00% |  |
Top three noisy pixels from each quadrant. If the there are fewer than three noisy pixels in the level2.evt file, extra rows are filled as -1
| Pixel properties | Quadrant properties | ||||||
|---|---|---|---|---|---|---|---|
| Quadrant | DetID | PixID | Counts | Sigma | Mean | Median | Sigma |
| A | 0 | 29 | 981 | 8.58 | 319 | 301 | 79.3 |
| A | 9 | 19 | 961 | 8.33 | 319 | 301 | 79.3 |
| A | 7 | 110 | 910 | 7.68 | 319 | 301 | 79.3 |
| B | 2 | 9 | 941 | 9.92 | 313 | 299 | 64.7 |
| B | 2 | 8 | 831 | 8.22 | 313 | 299 | 64.7 |
| B | 5 | 225 | 781 | 7.45 | 313 | 299 | 64.7 |
| C | 1 | 81 | 925 | 7.51 | 323 | 305 | 82.5 |
| C | 1 | 80 | 870 | 6.85 | 323 | 305 | 82.5 |
| C | 12 | 241 | 839 | 6.47 | 323 | 305 | 82.5 |
| D | 10 | 190 | 821 | 6.71 | 304 | 279 | 80.8 |
| D | 10 | 189 | 793 | 6.36 | 304 | 279 | 80.8 |
| D | 6 | 231 | 749 | 5.82 | 304 | 279 | 80.8 |
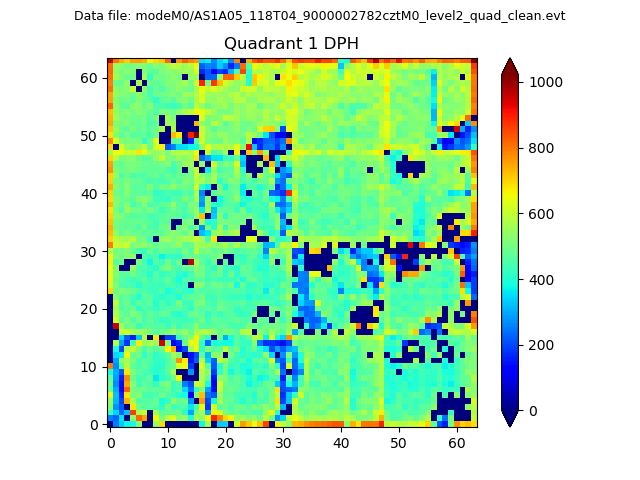
Histogram calculated using DETX and DETY for each event in the final _common_clean file
| Quadrant A |  |
 |
Quadrant B |
|---|---|---|---|
| Quadrant D |  |
 |
Quadrant C |
| Plot type | Count rate plots | Images |
|---|---|---|
| Comparison with Poisson distribution Blue bars denote a histogram of data divided into 1 sec bins. Red curve is a Poisson curve with rate = median count rate of data. |
 |
 |
| Quadrant-wise count rates Data is divided into 100 sec bins |
 |
|
| Module-wise count rates for Quadrant A Data is divided into 100 sec bins |
 |
 |
| Module-wise count rates for Quadrant B Data is divided into 100 sec bins |
 |
 |
| Module-wise count rates for Quadrant C Data is divided into 100 sec bins |
 |
 |
| Module-wise count rates for Quadrant D Data is divided into 100 sec bins |
 |
 |
| Parameter | Plot |
|---|---|
| CZT HV Monitor |  |
| D_VDD | 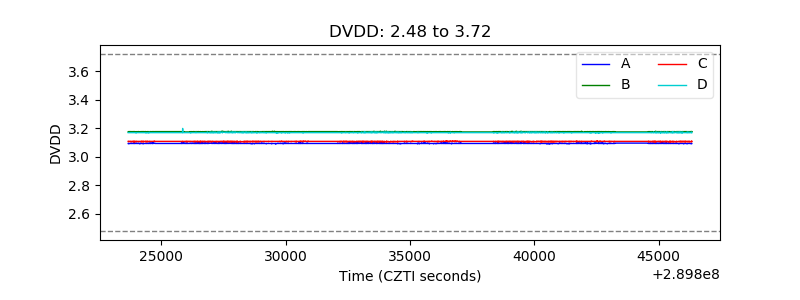 |
| Temperature 1 | 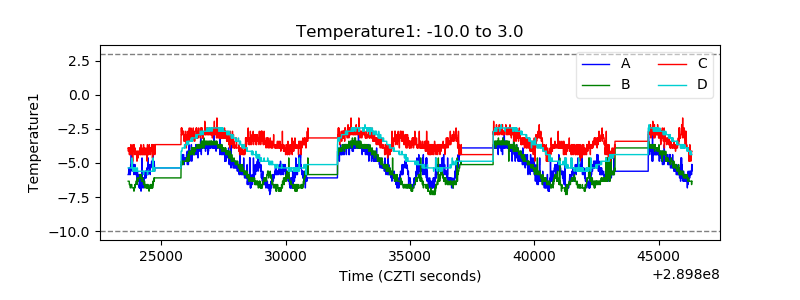 |
| Veto HV Monitor | 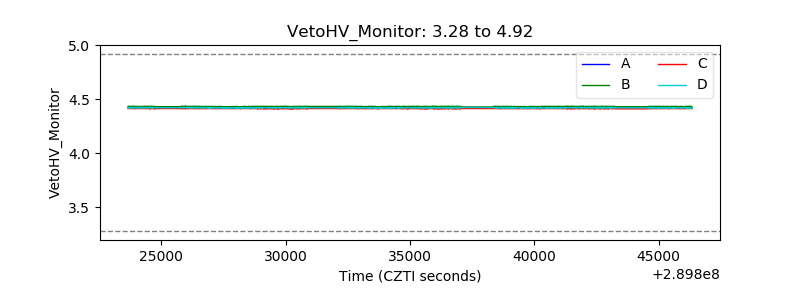 |
| Veto LLD |  |
| Alpha Counter |  |
| _CPM_Rate | 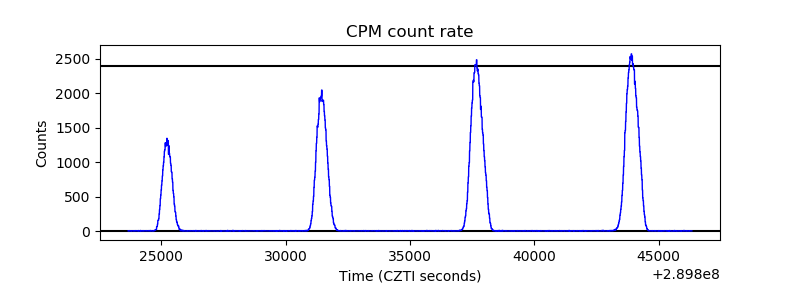 |
| CZT Counter |  |
| +2.5 Volts monitor |  |
| +5 Volts monitor |  |
| _ROLL_ROT |  |
| _Roll_DEC | 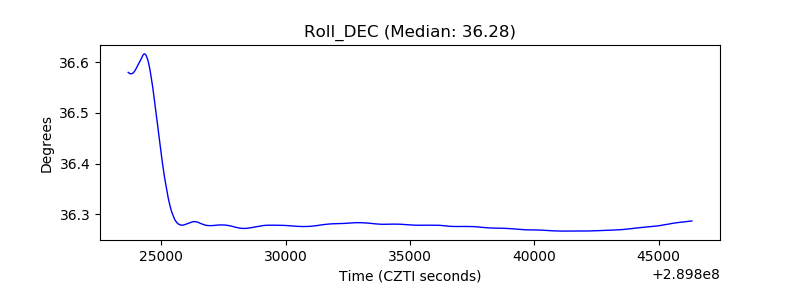 |
| _Roll_RA |  |
| Veto Counter |  |