| Param | Original file | Final file |
|---|---|---|
| Filename | modeM0/AS1A05_118T04_9000002782_18626cztM0_level2.evt | modeM0/AS1A05_118T04_9000002782_18626cztM0_level2_quad_clean.evt |
| Size (bytes) | 532,756,800 | 78,675,840 |
| Size | 508.1 MB | 75.0 MB |
| Events in quadrant A | 3,774,080 | 481,306 |
| Events in quadrant B | 3,574,174 | 492,329 |
| Events in quadrant C | 3,784,693 | 473,438 |
| Events in quadrant D | 4,545,053 | 466,085 |
| Mode M0 | |||
|---|---|---|---|
| Quadrant | BADHDUFLAG | Total packets | Discarded packets |
| A | 0 | 15702 | 2 |
| B | 0 | 14983 | 2 |
| C | 0 | 15488 | 2 |
| D | 0 | 18048 | 2 |
| Mode M9 | |||
|---|---|---|---|
| Quadrant | BADHDUFLAG | Total packets | Discarded packets |
| A | 0 | 22 | 0 |
| B | 0 | 22 | 0 |
| C | 0 | 22 | 0 |
| D | 0 | 22 | 0 |
| Mode SS | |||
|---|---|---|---|
| Quadrant | BADHDUFLAG | Total packets | Discarded packets |
| A | 0 | 138 | 0 |
| B | 0 | 138 | 0 |
| C | 0 | 138 | 0 |
| D | 0 | 138 | 0 |
| Quadrant | Total seconds | Saturated seconds | Saturation percentage |
|---|---|---|---|
| A | 6733 | 169 | 2.510025% |
| B | 6734 | 120 | 1.782002% |
| C | 6734 | 163 | 2.420552% |
| D | 6734 | 122 | 1.811702% |
Noise dominated data is calculated using 1-second bins in cleaned event files. If a bin has >2000 counts, and if more than 50% of those come from <1% of pixels, then it is considered to be noise-dominated and hence unusable.
| Quadrant | # 1 sec bins | Bins with >0 counts | Bins with >2000 counts | High rate bins dominated by noise | Noise dominated (total time) | Noise dominated (detector-on time) | Marked lightcurve |
|---|---|---|---|---|---|---|---|
| A | 8948 | 6733 | 32 | 32 | 0.36% | 0.48% | 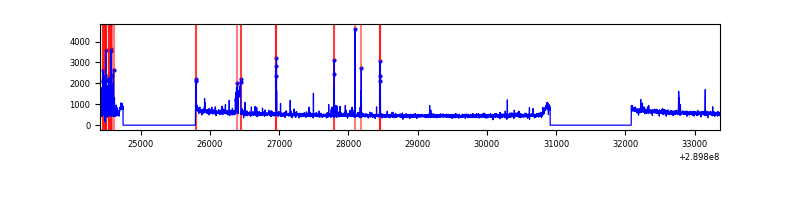 |
| B | 8949 | 6735 | 0 | 0 | 0.00% | 0.00% | 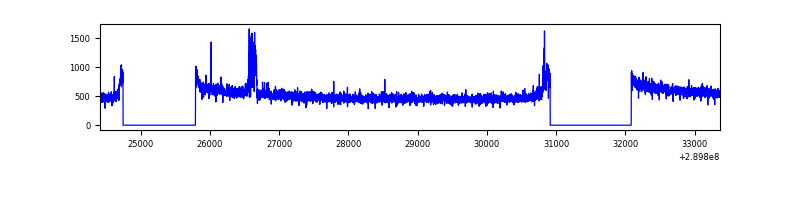 |
| C | 8949 | 6734 | 13 | 13 | 0.15% | 0.19% |  |
| D | 8949 | 6734 | 18 | 18 | 0.20% | 0.27% | 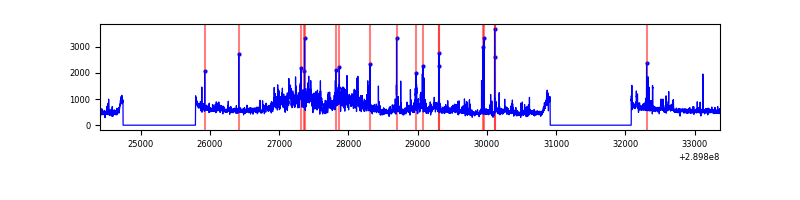 |
Top three noisy pixels from each quadrant. If the there are fewer than three noisy pixels in the level2.evt file, extra rows are filled as -1
| Pixel properties | Quadrant properties | ||||||
|---|---|---|---|---|---|---|---|
| Quadrant | DetID | PixID | Counts | Sigma | Mean | Median | Sigma |
| A | 0 | 13 | 153055 | 848.78 | 899 | 881 | 179.3 |
| A | 14 | 111 | 113968 | 630.76 | 899 | 881 | 179.3 |
| A | 9 | 143 | 33024 | 179.28 | 899 | 881 | 179.3 |
| B | 0 | 230 | 70147 | 405.8 | 894 | 872 | 170.7 |
| B | 12 | 111 | 20354 | 114.12 | 894 | 872 | 170.7 |
| B | 11 | 111 | 17940 | 99.98 | 894 | 872 | 170.7 |
| C | 9 | 54 | 180539 | 897.47 | 862 | 869 | 200.2 |
| C | 14 | 238 | 135559 | 672.79 | 862 | 869 | 200.2 |
| C | 3 | 233 | 68335 | 337.0 | 862 | 869 | 200.2 |
| D | 1 | 52 | 989135 | 4676.81 | 877 | 852 | 211.3 |
| D | 7 | 238 | 226714 | 1068.84 | 877 | 852 | 211.3 |
| D | 2 | 234 | 26996 | 123.72 | 877 | 852 | 211.3 |
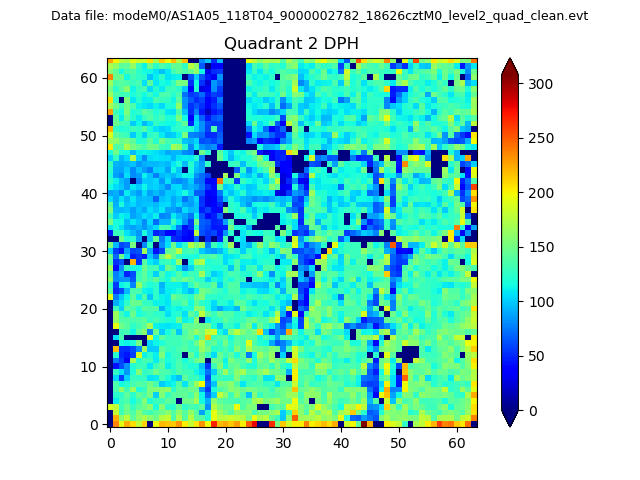
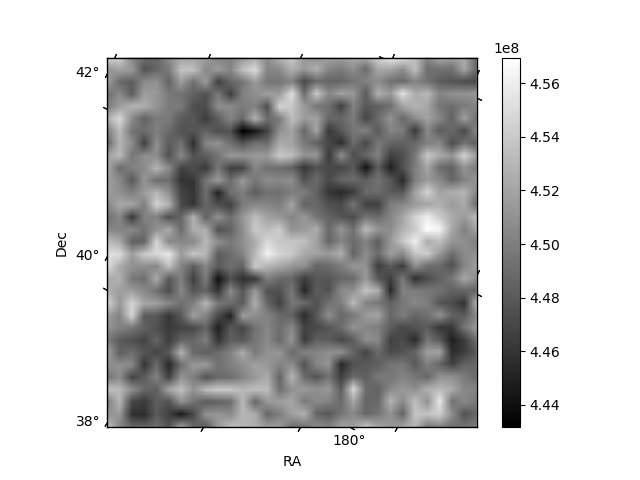
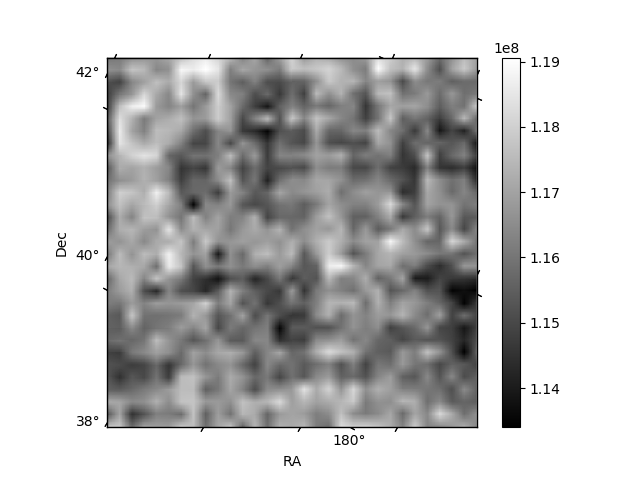
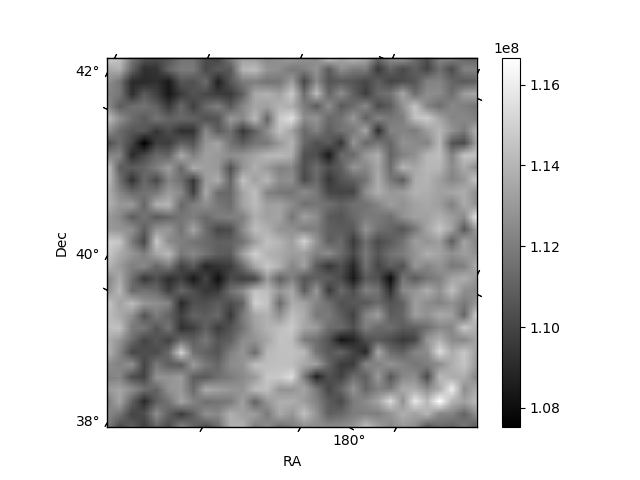
Histogram calculated using DETX and DETY for each event in the final _common_clean file
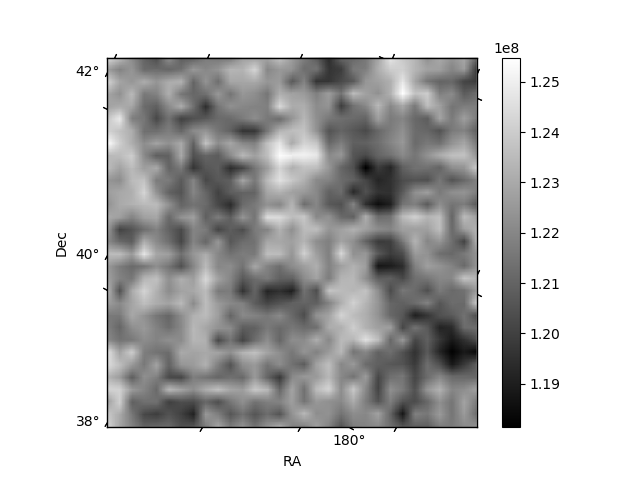
| Quadrant A | 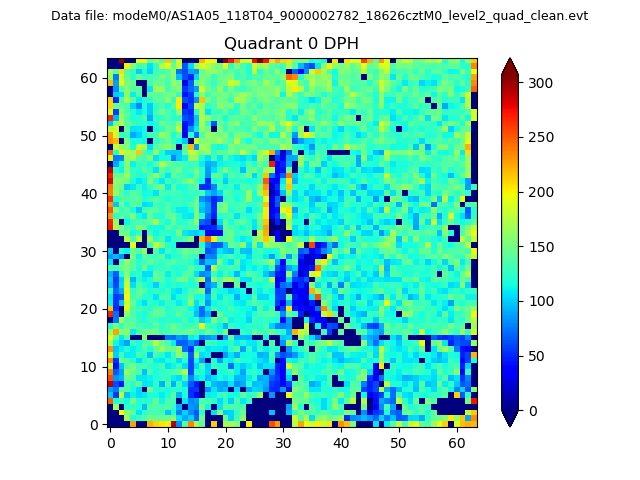 |
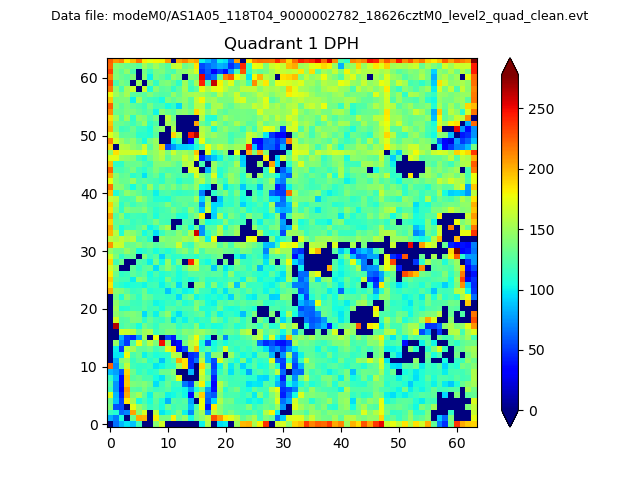 |
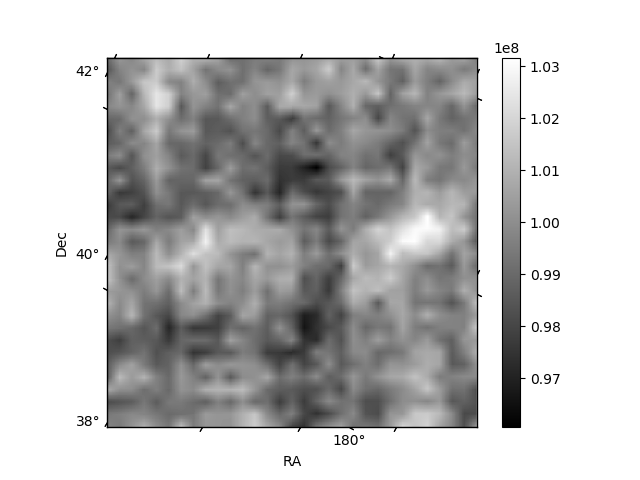
Quadrant B |
|---|---|---|---|
| Quadrant D | 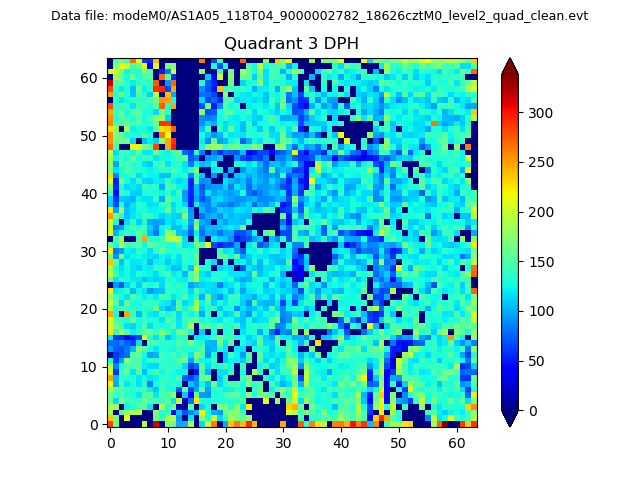 |
 |
Quadrant C |
| Plot type | Count rate plots | Images |
|---|---|---|
| Comparison with Poisson distribution Blue bars denote a histogram of data divided into 1 sec bins. Red curve is a Poisson curve with rate = median count rate of data. |
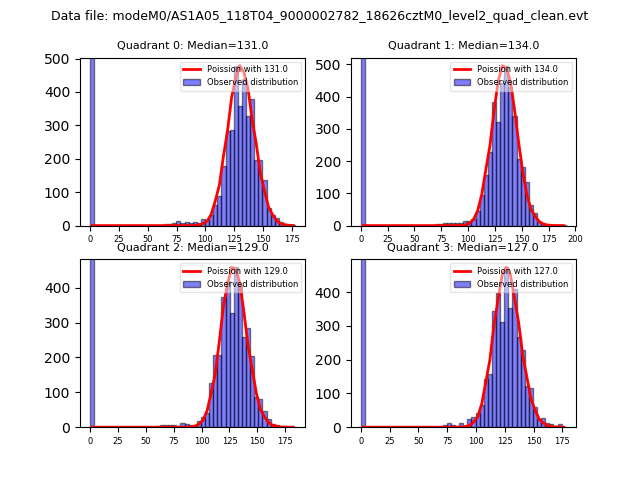 |
 |
| Quadrant-wise count rates Data is divided into 100 sec bins |
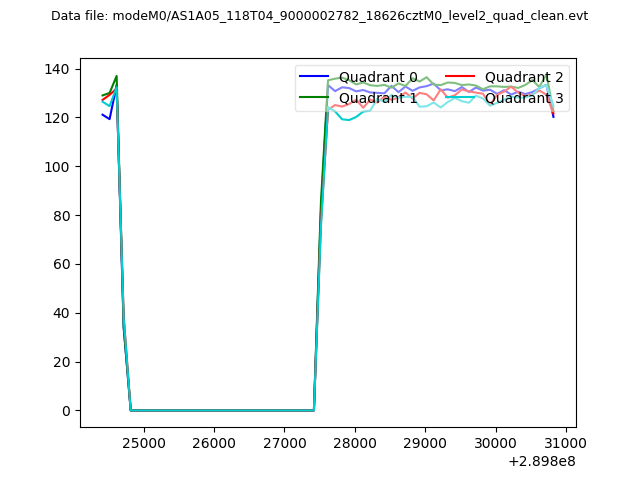 |
|
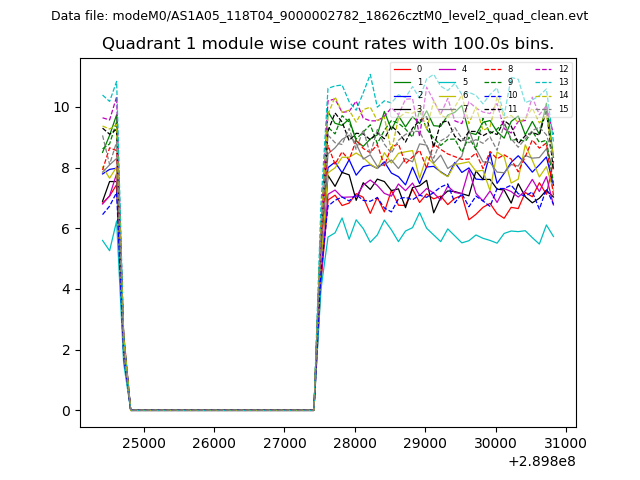
| Module-wise count rates for Quadrant A Data is divided into 100 sec bins |
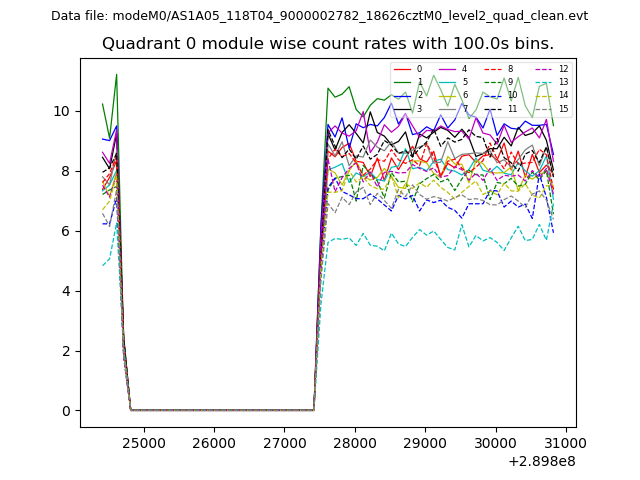 |
 |
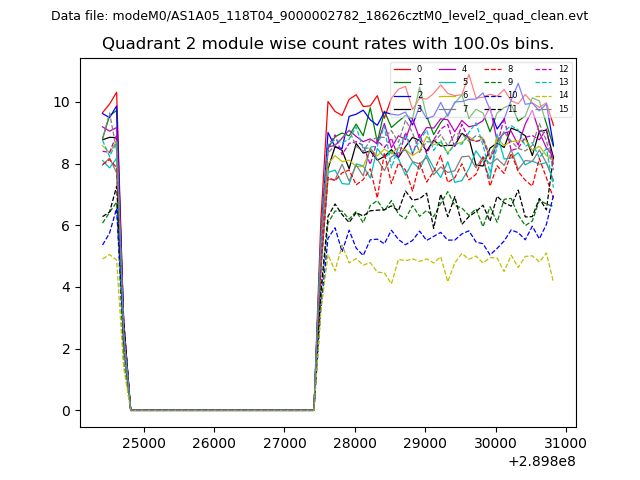
| Module-wise count rates for Quadrant B Data is divided into 100 sec bins |
 |
 |
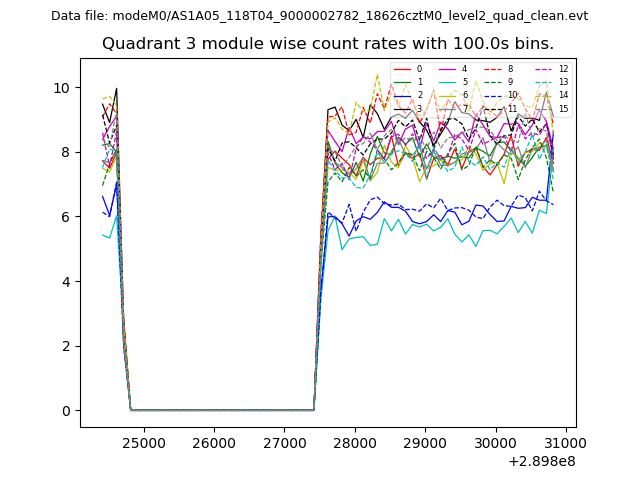
| Module-wise count rates for Quadrant C Data is divided into 100 sec bins |
 |
 |
| Module-wise count rates for Quadrant D Data is divided into 100 sec bins |
 |
 |
| Parameter | Plot |
|---|---|
| CZT HV Monitor | 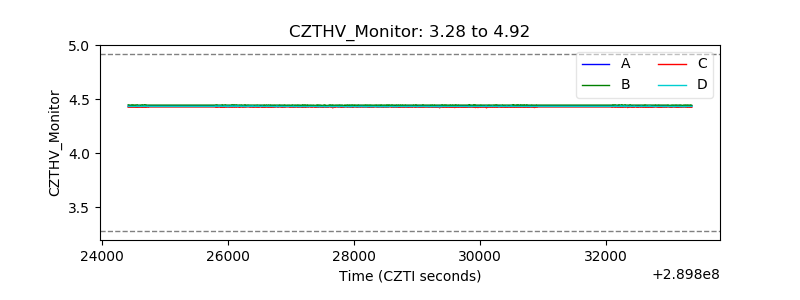 |
| D_VDD | 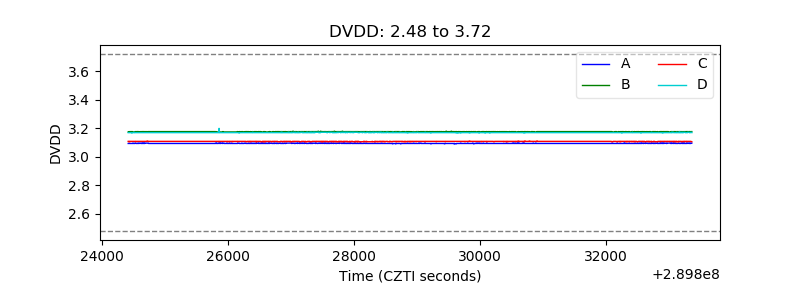 |
| Temperature 1 | 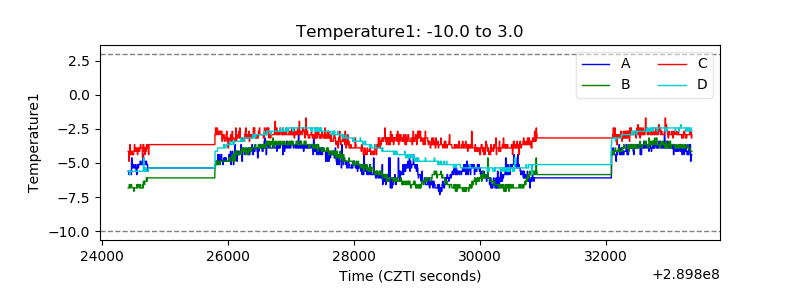 |
| Veto HV Monitor | 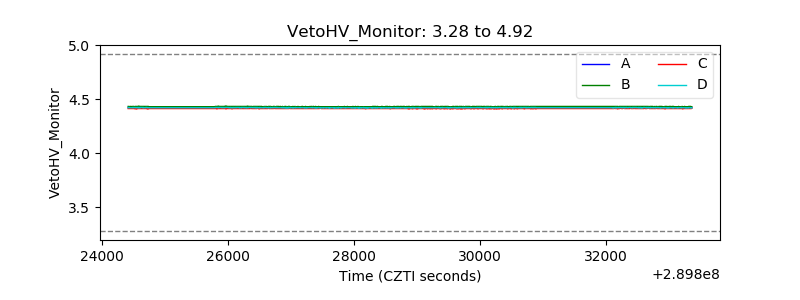 |
| Veto LLD | 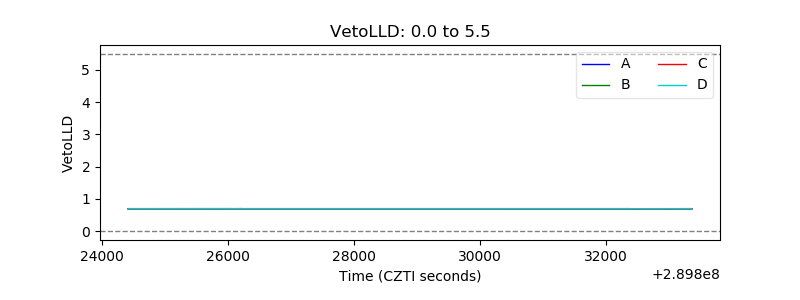 |
| Alpha Counter | 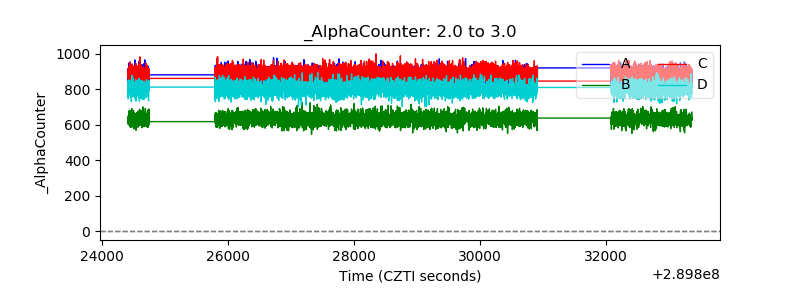 |
| _CPM_Rate | 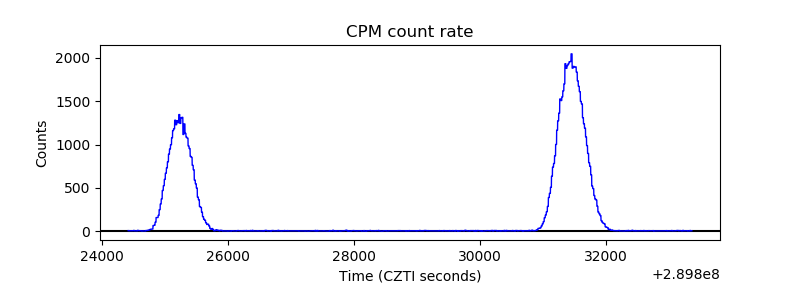 |
| CZT Counter | 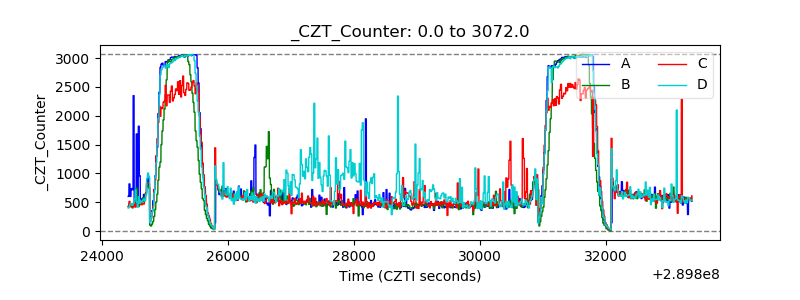 |
| +2.5 Volts monitor |  |
| +5 Volts monitor | 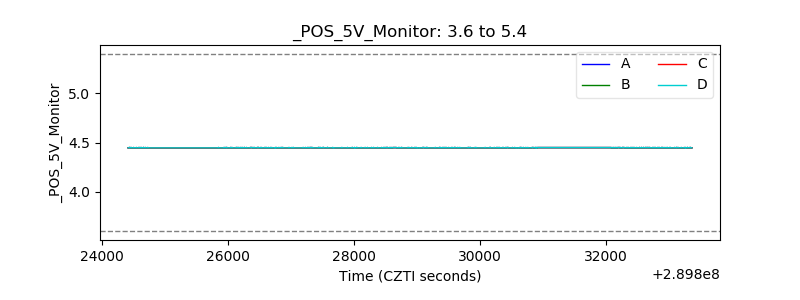 |
| _ROLL_ROT | 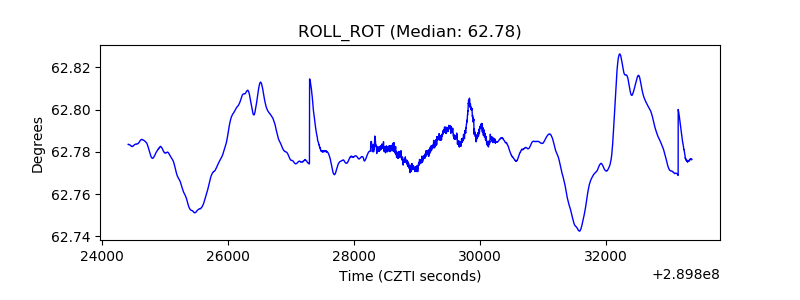 |
| _Roll_DEC | 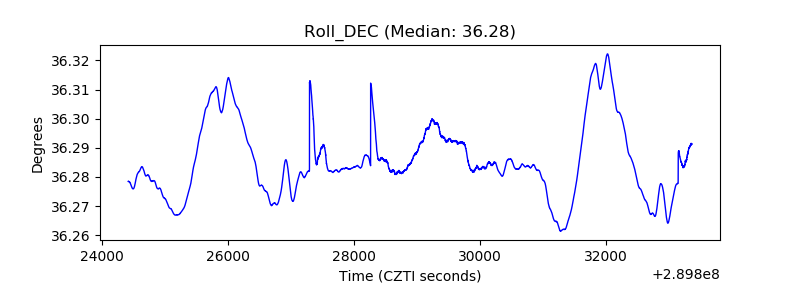 |
| _Roll_RA | 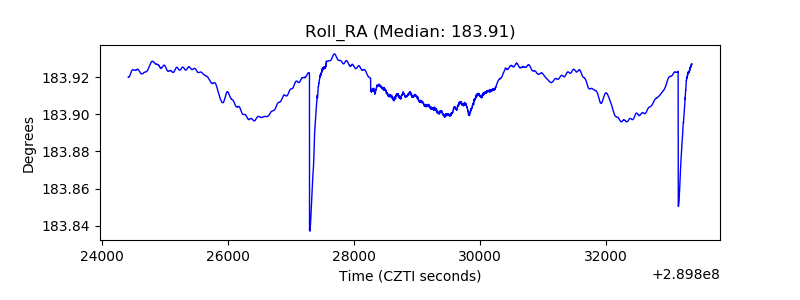 |
| Veto Counter | 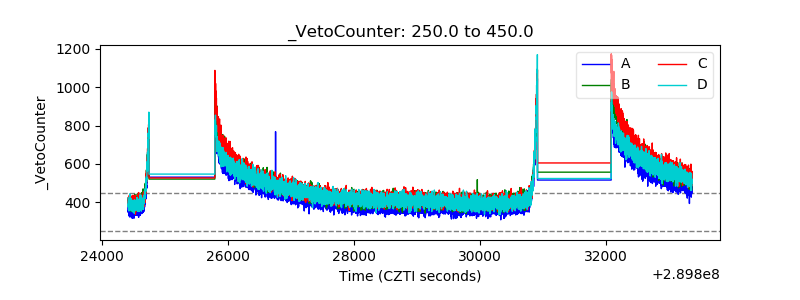 |