| Param | Original file | Final file |
|---|---|---|
| Filename | modeM0/AS1C04_001T01_9000002784cztM0_level2.fits | modeM0/AS1C04_001T01_9000002784cztM0_level2_quad_clean.evt |
| Size (bytes) | 597,484,800 | 772,122,240 |
| Size | 569.8 MB | 736.4 MB |
| Events in quadrant A | 3,638,968 | 4,982,324 |
| Events in quadrant B | 3,388,336 | 4,720,614 |
| Events in quadrant C | 3,627,086 | 4,923,612 |
| Events in quadrant D | 3,128,368 | 4,449,661 |
| Mode SS | |||
|---|---|---|---|
| Quadrant | BADHDUFLAG | Total packets | Discarded packets |
| A | 0 | 1276 | 0 |
| B | 0 | 1276 | 0 |
| C | 0 | 1276 | 0 |
| D | 0 | 1276 | 0 |
| Mode M9 | |||
|---|---|---|---|
| Quadrant | BADHDUFLAG | Total packets | Discarded packets |
| A | 0 | 88 | 0 |
| B | 0 | 88 | 0 |
| C | 0 | 88 | 0 |
| D | 0 | 88 | 0 |
| Mode M0 | |||
|---|---|---|---|
| Quadrant | BADHDUFLAG | Total packets | Discarded packets |
| A | 0 | 131122 | 0 |
| B | 0 | 172767 | 0 |
| C | 0 | 132907 | 0 |
| D | 0 | 155793 | 0 |
| Quadrant | Total seconds | Saturated seconds | Saturation percentage |
|---|---|---|---|
| A | 62853 | 612 | 0.973701% |
| B | 62853 | 4746 | 7.550952% |
| C | 62853 | 946 | 1.505099% |
| D | 62853 | 1964 | 3.124751% |
Noise dominated data is calculated using 1-second bins in cleaned event files. If a bin has >2000 counts, and if more than 50% of those come from <1% of pixels, then it is considered to be noise-dominated and hence unusable.
| Quadrant | # 1 sec bins | Bins with >0 counts | Bins with >2000 counts | High rate bins dominated by noise | Noise dominated (total time) | Noise dominated (detector-on time) | Marked lightcurve |
|---|---|---|---|---|---|---|---|
| A | 71383 | 62851 | 0 | 0 | 0.00% | 0.00% |  |
| B | 71383 | 62748 | 0 | 0 | 0.00% | 0.00% |  |
| C | 71383 | 62849 | 0 | 0 | 0.00% | 0.00% |  |
| D | 71383 | 62793 | 0 | 0 | 0.00% | 0.00% |  |
Top three noisy pixels from each quadrant. If the there are fewer than three noisy pixels in the level2.evt file, extra rows are filled as -1
| Pixel properties | Quadrant properties | ||||||
|---|---|---|---|---|---|---|---|
| Quadrant | DetID | PixID | Counts | Sigma | Mean | Median | Sigma |
| A | 0 | 29 | 3041 | 9.26 | 946 | 892 | 232.1 |
| A | 7 | 110 | 2960 | 8.91 | 946 | 892 | 232.1 |
| A | 9 | 19 | 2775 | 8.11 | 946 | 892 | 232.1 |
| B | 2 | 9 | 2776 | 11.07 | 896 | 858 | 173.3 |
| B | 2 | 8 | 2330 | 8.49 | 896 | 858 | 173.3 |
| B | 5 | 255 | 2195 | 7.71 | 896 | 858 | 173.3 |
| C | 3 | 126 | 2550 | 6.79 | 957 | 901 | 242.8 |
| C | 12 | 241 | 2544 | 6.77 | 957 | 901 | 242.8 |
| C | 2 | 191 | 2490 | 6.54 | 957 | 901 | 242.8 |
| D | 10 | 190 | 2355 | 6.59 | 891 | 814 | 233.9 |
| D | 10 | 189 | 2210 | 5.97 | 891 | 814 | 233.9 |
| D | 6 | 38 | 2188 | 5.87 | 891 | 814 | 233.9 |
Histogram calculated using DETX and DETY for each event in the final _common_clean file
| Quadrant A | 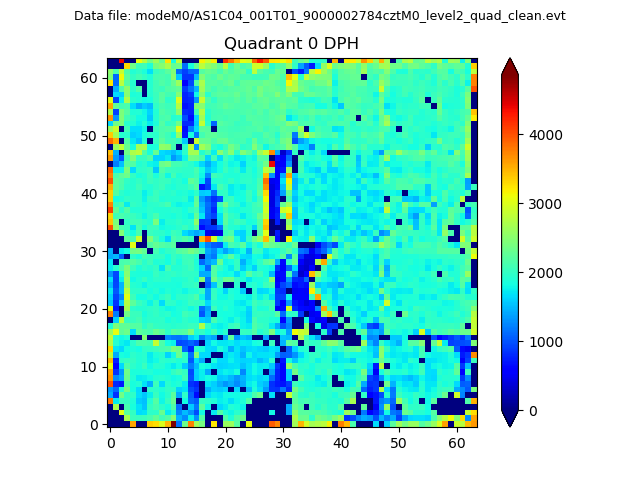 |
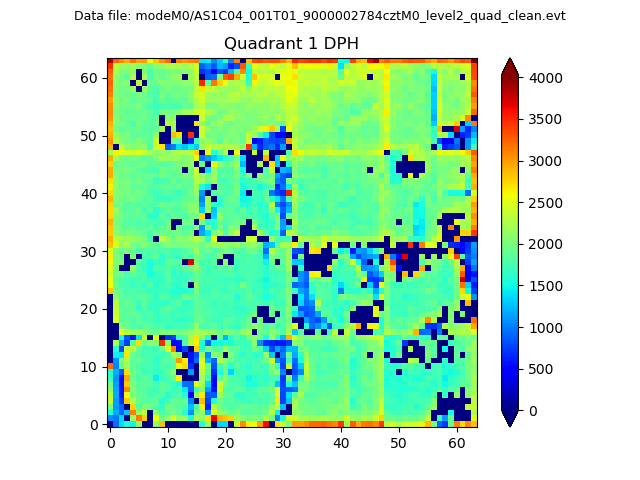 |
Quadrant B |
|---|---|---|---|
| Quadrant D |  |
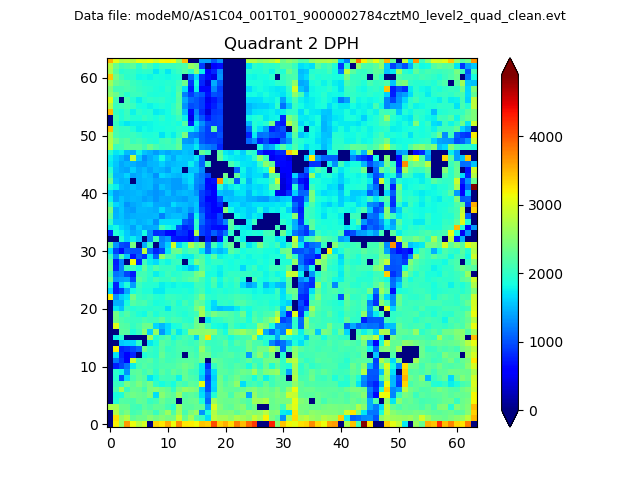 |
Quadrant C |
| Plot type | Count rate plots | Images |
|---|---|---|
| Comparison with Poisson distribution Blue bars denote a histogram of data divided into 1 sec bins. Red curve is a Poisson curve with rate = median count rate of data. |
 |
 |
| Quadrant-wise count rates Data is divided into 100 sec bins |
 |
|
| Module-wise count rates for Quadrant A Data is divided into 100 sec bins |
 |
 |
| Module-wise count rates for Quadrant B Data is divided into 100 sec bins |
 |
 |
| Module-wise count rates for Quadrant C Data is divided into 100 sec bins |
 |
 |
| Module-wise count rates for Quadrant D Data is divided into 100 sec bins |
 |
 |
| Parameter | Plot |
|---|---|
| CZT HV Monitor |  |
| D_VDD |  |
| Temperature 1 |  |
| Veto HV Monitor |  |
| Veto LLD |  |
| Alpha Counter |  |
| _CPM_Rate |  |
| CZT Counter |  |
| +2.5 Volts monitor |  |
| +5 Volts monitor |  |
| _ROLL_ROT |  |
| _Roll_DEC |  |
| _Roll_RA |  |
| Veto Counter |  |