| Param | Original file | Final file |
|---|---|---|
| Filename | modeM0/AS1C04_001T01_9000002784_18630cztM0_level2.evt | modeM0/AS1C04_001T01_9000002784_18630cztM0_level2_quad_clean.evt |
| Size (bytes) | 469,005,120 | 133,266,240 |
| Size | 447.3 MB | 127.1 MB |
| Events in quadrant A | 3,236,961 | 895,968 |
| Events in quadrant B | 3,211,768 | 923,777 |
| Events in quadrant C | 3,731,214 | 901,601 |
| Events in quadrant D | 3,596,700 | 876,228 |
| Mode SS | |||
|---|---|---|---|
| Quadrant | BADHDUFLAG | Total packets | Discarded packets |
| A | 0 | 128 | 0 |
| B | 0 | 128 | 0 |
| C | 0 | 128 | 0 |
| D | 0 | 128 | 0 |
| Mode M9 | |||
|---|---|---|---|
| Quadrant | BADHDUFLAG | Total packets | Discarded packets |
| A | 0 | 13 | 0 |
| B | 0 | 14 | 0 |
| C | 0 | 14 | 0 |
| D | 0 | 14 | 0 |
| Mode M0 | |||
|---|---|---|---|
| Quadrant | BADHDUFLAG | Total packets | Discarded packets |
| A | 0 | 13777 | 2 |
| B | 0 | 13513 | 2 |
| C | 0 | 15292 | 2 |
| D | 0 | 14977 | 2 |
| Quadrant | Total seconds | Saturated seconds | Saturation percentage |
|---|---|---|---|
| A | 6287 | 99 | 1.574678% |
| B | 6287 | 83 | 1.320185% |
| C | 6287 | 193 | 3.069827% |
| D | 6287 | 150 | 2.385876% |
Noise dominated data is calculated using 1-second bins in cleaned event files. If a bin has >2000 counts, and if more than 50% of those come from <1% of pixels, then it is considered to be noise-dominated and hence unusable.
| Quadrant | # 1 sec bins | Bins with >0 counts | Bins with >2000 counts | High rate bins dominated by noise | Noise dominated (total time) | Noise dominated (detector-on time) | Marked lightcurve |
|---|---|---|---|---|---|---|---|
| A | 7542 | 6288 | 29 | 29 | 0.38% | 0.46% | 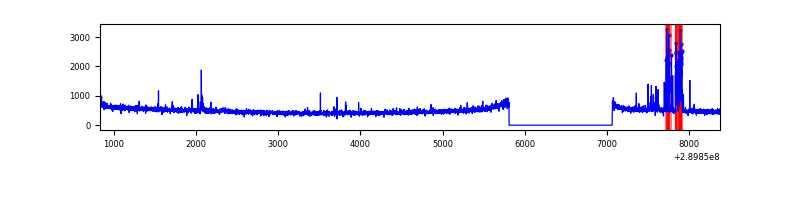 |
| B | 7542 | 6288 | 1 | 1 | 0.01% | 0.02% | 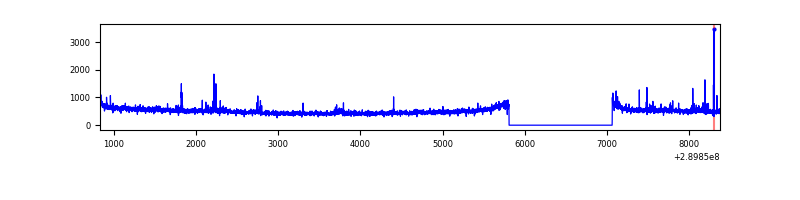 |
| C | 7542 | 6288 | 29 | 29 | 0.38% | 0.46% | 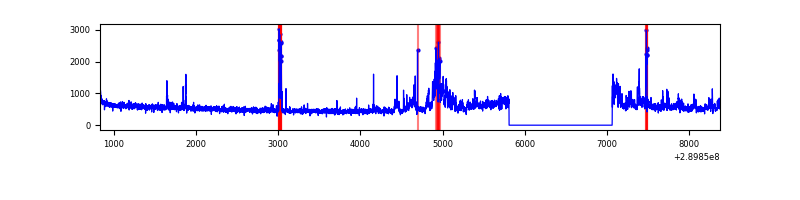 |
| D | 7542 | 6288 | 43 | 43 | 0.57% | 0.68% | 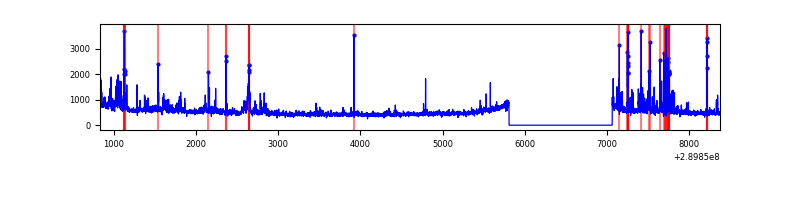 |
Top three noisy pixels from each quadrant. If the there are fewer than three noisy pixels in the level2.evt file, extra rows are filled as -1
| Pixel properties | Quadrant properties | ||||||
|---|---|---|---|---|---|---|---|
| Quadrant | DetID | PixID | Counts | Sigma | Mean | Median | Sigma |
| A | 6 | 16 | 138962 | 869.87 | 794 | 779 | 158.9 |
| A | 9 | 143 | 32636 | 200.54 | 794 | 779 | 158.9 |
| A | 13 | 254 | 9290 | 53.57 | 794 | 779 | 158.9 |
| B | 0 | 229 | 22298 | 145.01 | 799 | 781 | 148.4 |
| B | 0 | 189 | 18263 | 117.82 | 799 | 781 | 148.4 |
| B | 12 | 111 | 17012 | 109.39 | 799 | 781 | 148.4 |
| C | 3 | 233 | 432181 | 2406.22 | 783 | 790 | 179.3 |
| C | 14 | 238 | 123195 | 682.75 | 783 | 790 | 179.3 |
| C | 9 | 54 | 112894 | 625.3 | 783 | 790 | 179.3 |
| D | 1 | 52 | 285871 | 1517.69 | 786 | 762 | 187.9 |
| D | 7 | 238 | 160006 | 847.69 | 786 | 762 | 187.9 |
| D | 14 | 34 | 105429 | 557.16 | 786 | 762 | 187.9 |
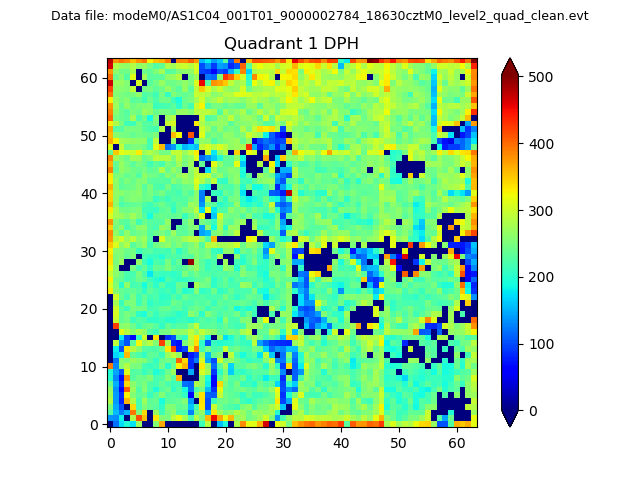
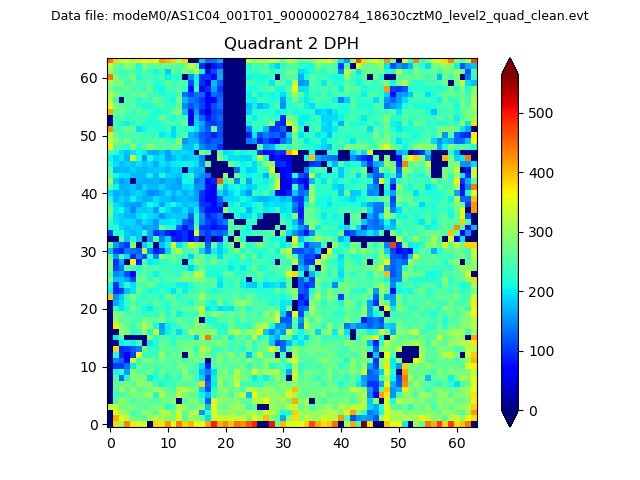
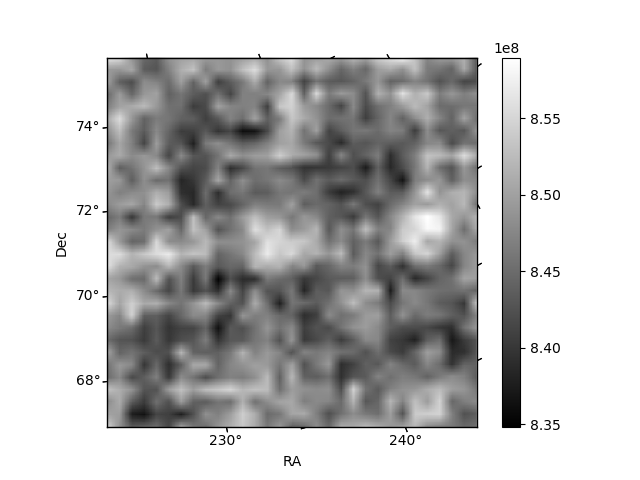
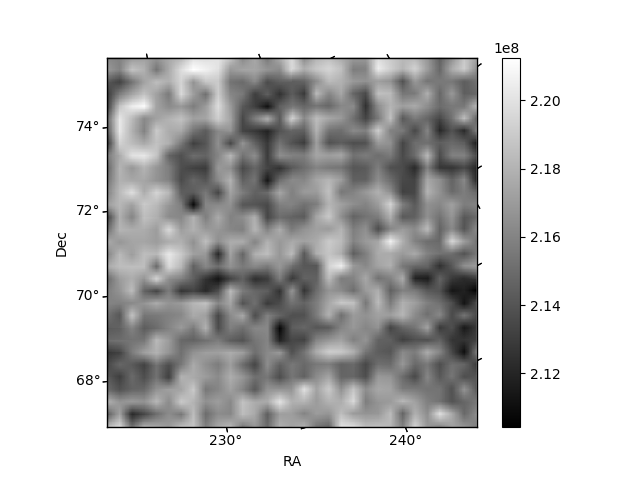
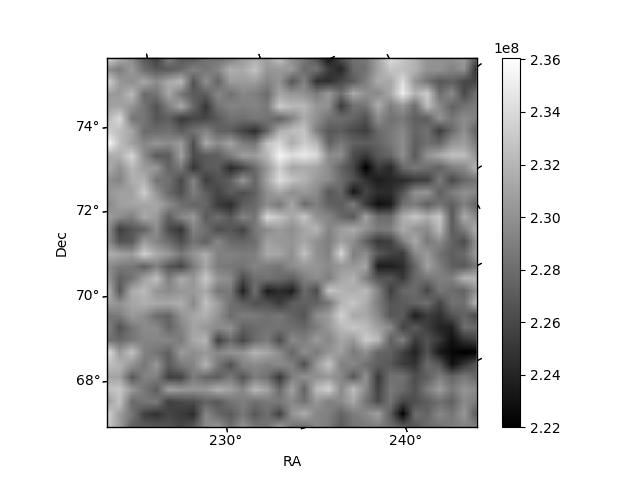
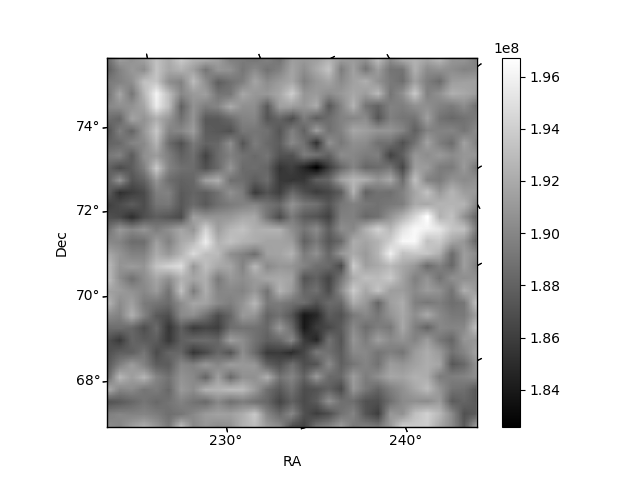
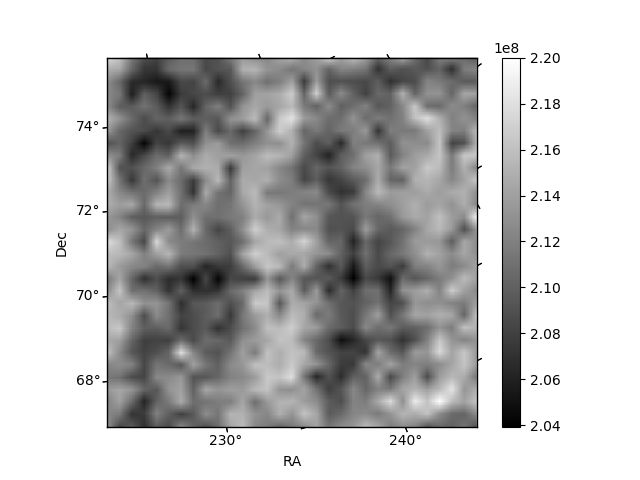
Histogram calculated using DETX and DETY for each event in the final _common_clean file
| Quadrant A |  |
 |
Quadrant B |
|---|---|---|---|
| Quadrant D | 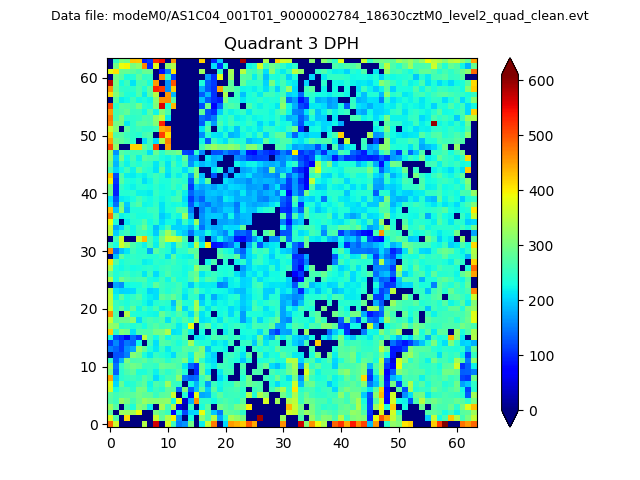 |
 |
Quadrant C |
| Plot type | Count rate plots | Images |
|---|---|---|
| Comparison with Poisson distribution Blue bars denote a histogram of data divided into 1 sec bins. Red curve is a Poisson curve with rate = median count rate of data. |
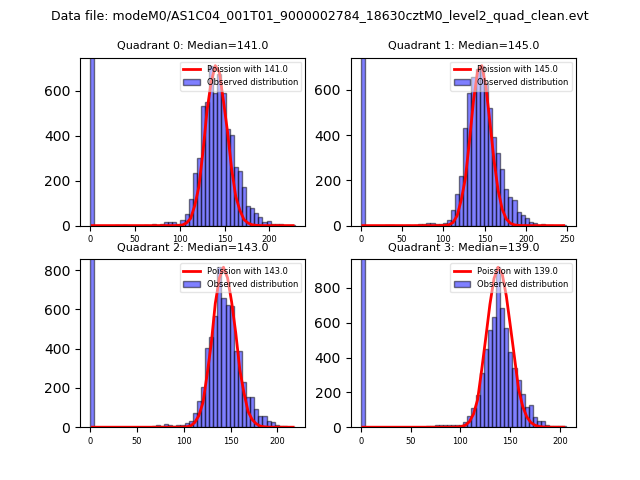 |
 |
| Quadrant-wise count rates Data is divided into 100 sec bins |
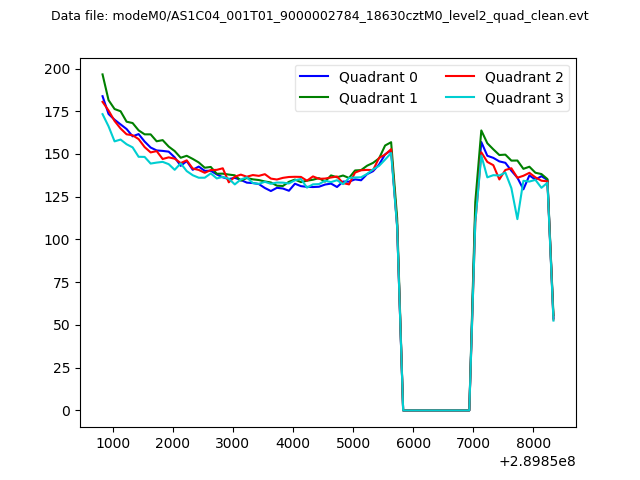 |
|
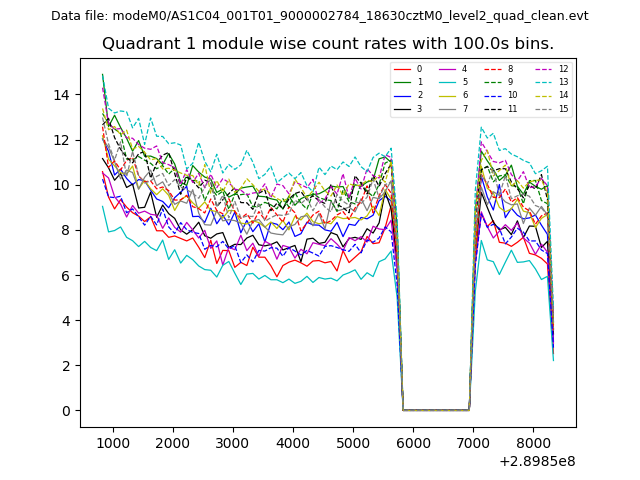
| Module-wise count rates for Quadrant A Data is divided into 100 sec bins |
 |
 |
| Module-wise count rates for Quadrant B Data is divided into 100 sec bins |
 |
 |
| Module-wise count rates for Quadrant C Data is divided into 100 sec bins |
 |
 |
| Module-wise count rates for Quadrant D Data is divided into 100 sec bins |
 |
 |
| Parameter | Plot |
|---|---|
| CZT HV Monitor | 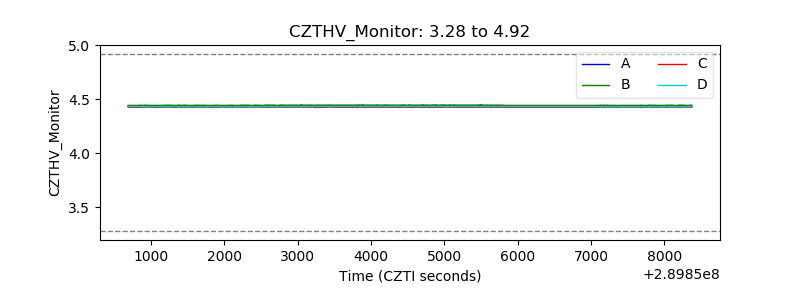 |
| D_VDD | 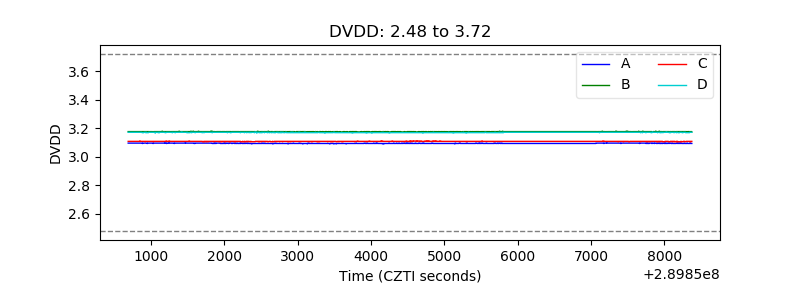 |
| Temperature 1 | 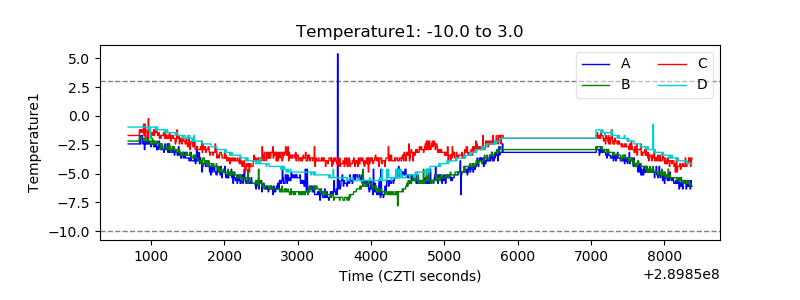 |
| Veto HV Monitor |  |
| Veto LLD | 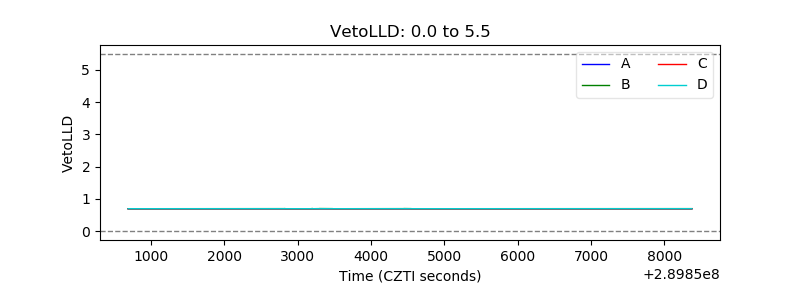 |
| Alpha Counter | 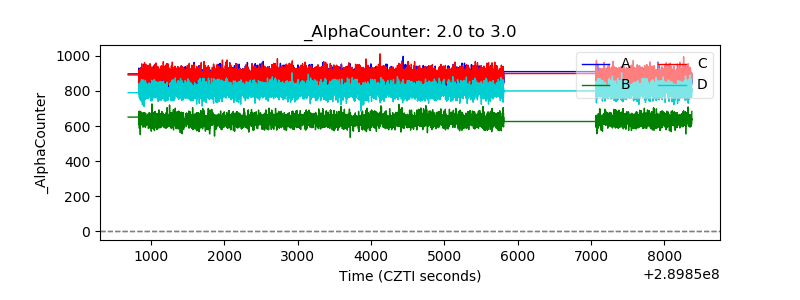 |
| _CPM_Rate | 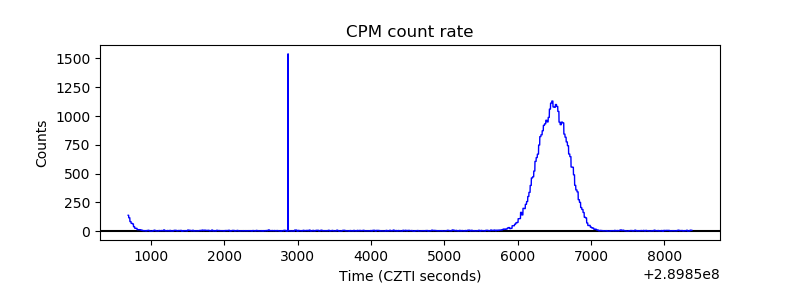 |
| CZT Counter | 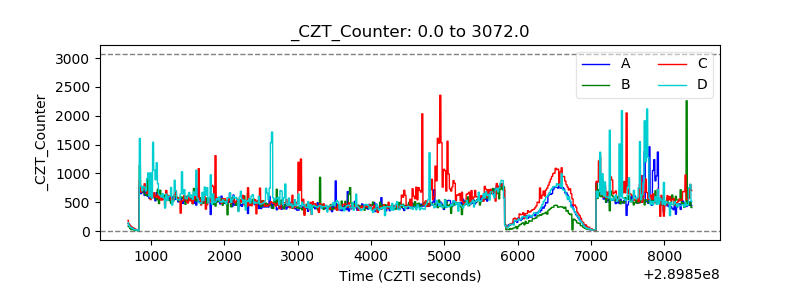 |
| +2.5 Volts monitor |  |
| +5 Volts monitor |  |
| _ROLL_ROT | 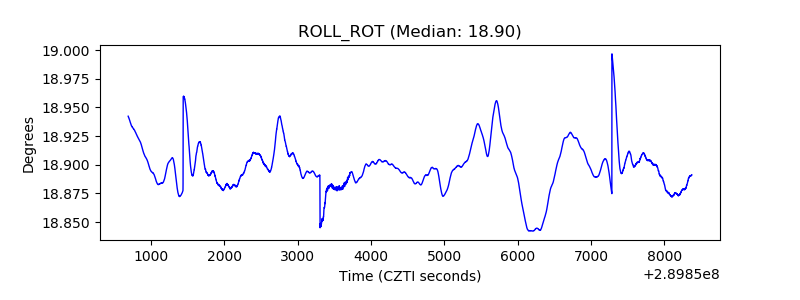 |
| _Roll_DEC | 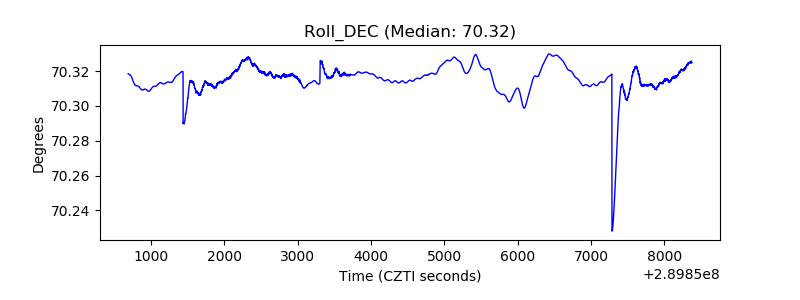 |
| _Roll_RA |  |
| Veto Counter | 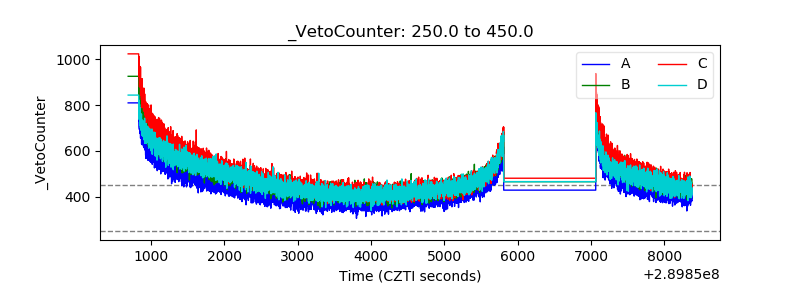 |