| Param | Original file | Final file |
|---|---|---|
| Filename | modeM0/AS1C04_001T01_9000002784_18633cztM0_level2.evt | modeM0/AS1C04_001T01_9000002784_18633cztM0_level2_quad_clean.evt |
| Size (bytes) | 540,636,480 | 134,694,720 |
| Size | 515.6 MB | 128.5 MB |
| Events in quadrant A | 3,548,062 | 888,986 |
| Events in quadrant B | 3,831,196 | 904,112 |
| Events in quadrant C | 3,794,108 | 891,997 |
| Events in quadrant D | 4,678,783 | 860,662 |
| Mode SS | |||
|---|---|---|---|
| Quadrant | BADHDUFLAG | Total packets | Discarded packets |
| A | 0 | 156 | 0 |
| B | 0 | 156 | 0 |
| C | 0 | 156 | 0 |
| D | 0 | 156 | 0 |
| Mode M9 | |||
|---|---|---|---|
| Quadrant | BADHDUFLAG | Total packets | Discarded packets |
| A | 0 | 9 | 0 |
| B | 0 | 9 | 0 |
| C | 0 | 9 | 0 |
| D | 0 | 9 | 0 |
| Mode M0 | |||
|---|---|---|---|
| Quadrant | BADHDUFLAG | Total packets | Discarded packets |
| A | 0 | 15936 | 2 |
| B | 0 | 16633 | 2 |
| C | 0 | 16621 | 2 |
| D | 0 | 19315 | 4 |
| Quadrant | Total seconds | Saturated seconds | Saturation percentage |
|---|---|---|---|
| A | 7686 | 51 | 0.663544% |
| B | 7686 | 132 | 1.717408% |
| C | 7687 | 186 | 2.419670% |
| D | 7686 | 209 | 2.719230% |
Noise dominated data is calculated using 1-second bins in cleaned event files. If a bin has >2000 counts, and if more than 50% of those come from <1% of pixels, then it is considered to be noise-dominated and hence unusable.
| Quadrant | # 1 sec bins | Bins with >0 counts | Bins with >2000 counts | High rate bins dominated by noise | Noise dominated (total time) | Noise dominated (detector-on time) | Marked lightcurve |
|---|---|---|---|---|---|---|---|
| A | 8401 | 7689 | 0 | 0 | 0.00% | 0.00% | 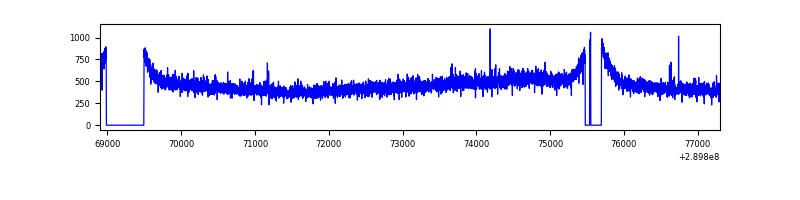 |
| B | 8401 | 7689 | 13 | 13 | 0.15% | 0.17% | 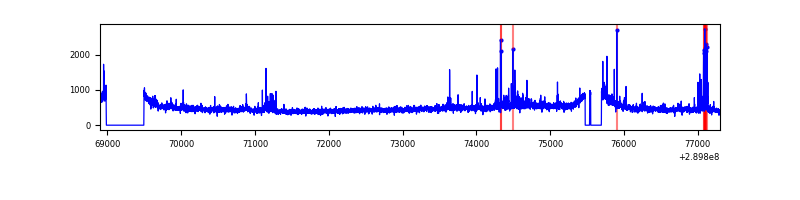 |
| C | 8402 | 7690 | 1 | 1 | 0.01% | 0.01% | 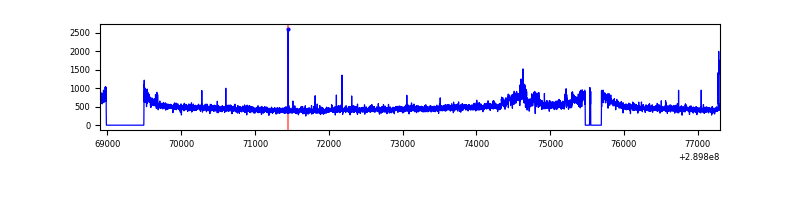 |
| D | 8401 | 7688 | 109 | 109 | 1.30% | 1.42% | 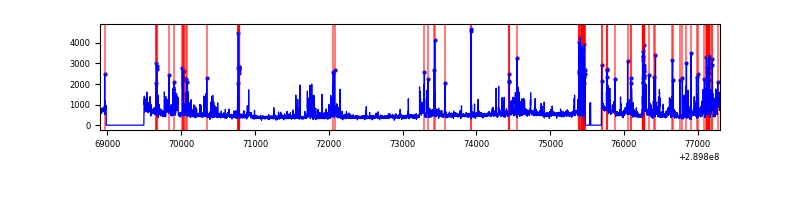 |
Top three noisy pixels from each quadrant. If the there are fewer than three noisy pixels in the level2.evt file, extra rows are filled as -1
| Pixel properties | Quadrant properties | ||||||
|---|---|---|---|---|---|---|---|
| Quadrant | DetID | PixID | Counts | Sigma | Mean | Median | Sigma |
| A | 13 | 254 | 11615 | 58.0 | 914 | 892 | 184.9 |
| A | 11 | 29 | 11580 | 57.81 | 914 | 892 | 184.9 |
| A | 0 | 226 | 8040 | 38.66 | 914 | 892 | 184.9 |
| B | 0 | 230 | 82996 | 469.41 | 919 | 896 | 174.9 |
| B | 7 | 220 | 60926 | 343.23 | 919 | 896 | 174.9 |
| B | 0 | 197 | 22819 | 125.35 | 919 | 896 | 174.9 |
| C | 14 | 238 | 138598 | 658.72 | 895 | 900 | 209.0 |
| C | 3 | 233 | 105880 | 502.2 | 895 | 900 | 209.0 |
| C | 9 | 54 | 33221 | 154.62 | 895 | 900 | 209.0 |
| D | 1 | 52 | 762543 | 3535.11 | 891 | 866 | 215.5 |
| D | 7 | 238 | 330050 | 1527.81 | 891 | 866 | 215.5 |
| D | 14 | 34 | 110544 | 509.04 | 891 | 866 | 215.5 |
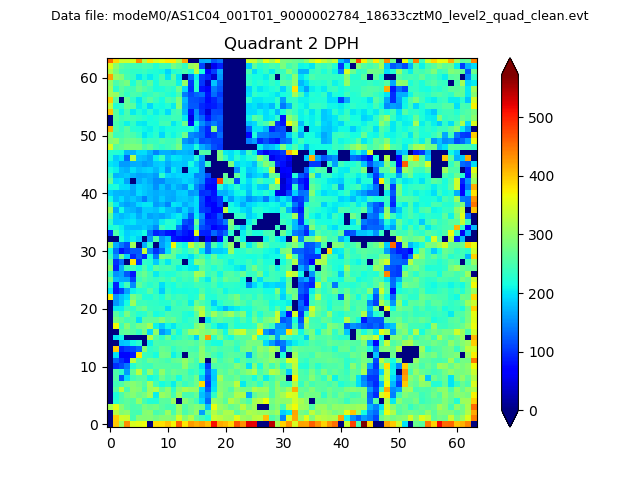
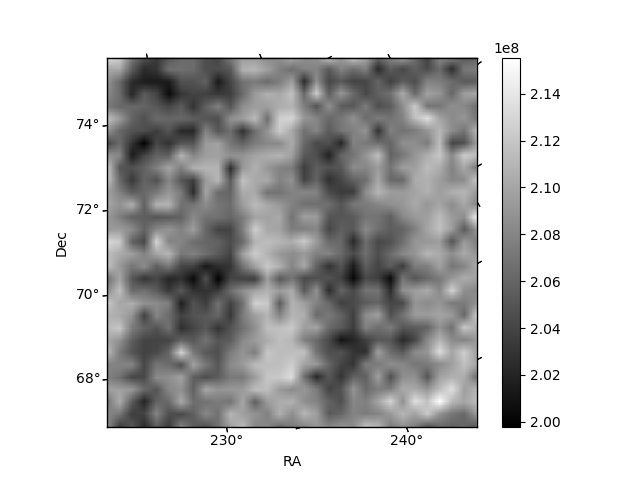
Histogram calculated using DETX and DETY for each event in the final _common_clean file
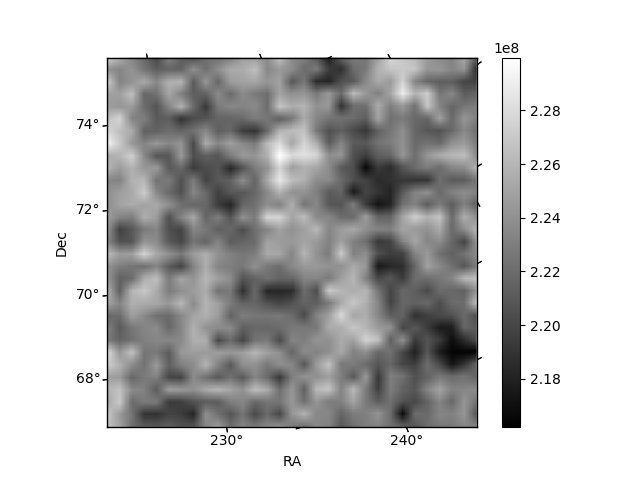
| Quadrant A | 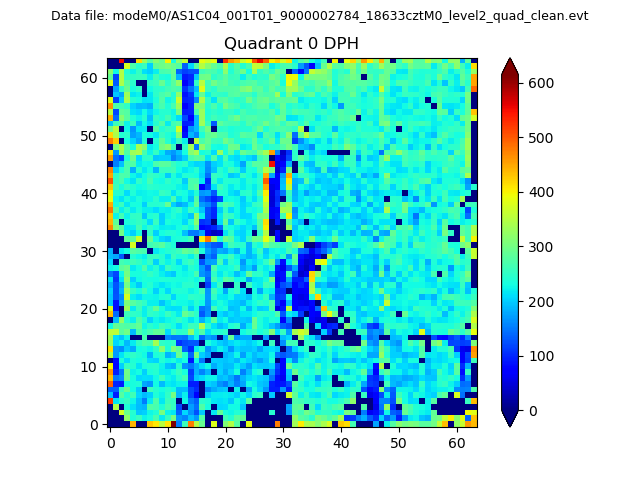 |
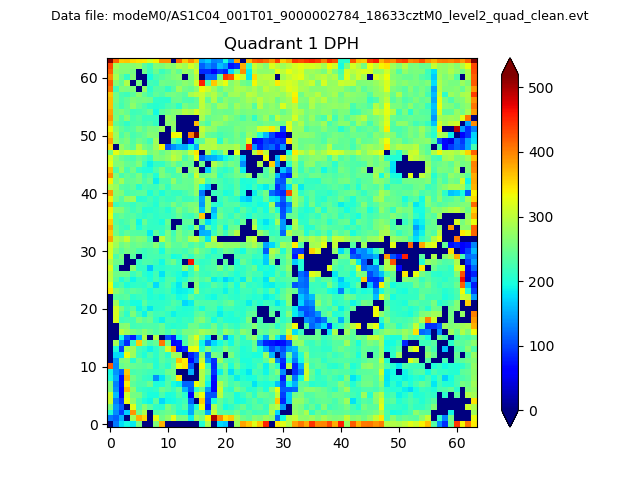 |
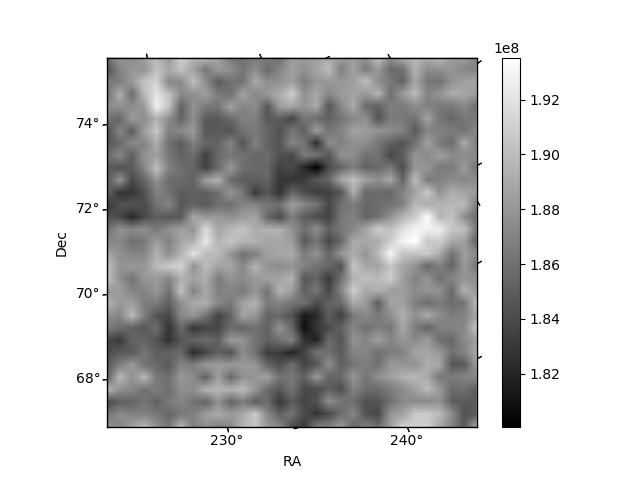
Quadrant B |
|---|---|---|---|
| Quadrant D | 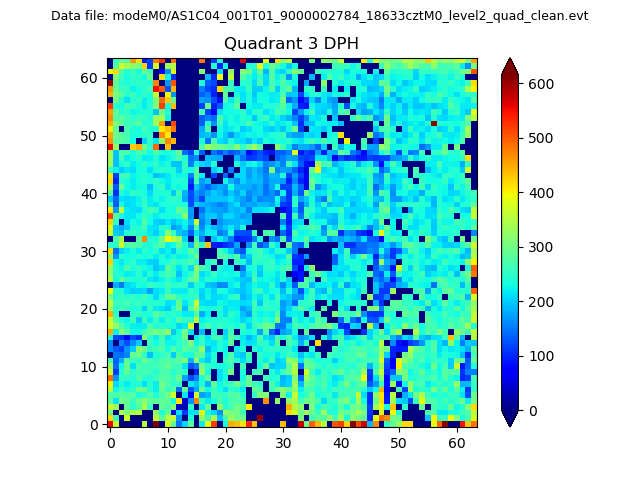 |
 |
Quadrant C |
| Plot type | Count rate plots | Images |
|---|---|---|
| Comparison with Poisson distribution Blue bars denote a histogram of data divided into 1 sec bins. Red curve is a Poisson curve with rate = median count rate of data. |
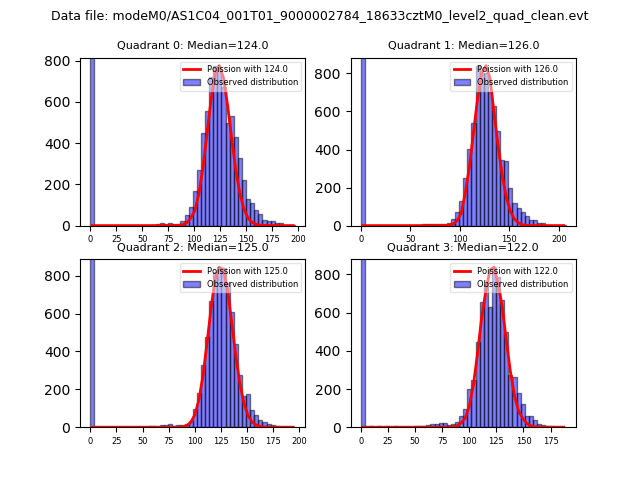 |
 |
| Quadrant-wise count rates Data is divided into 100 sec bins |
 |
|
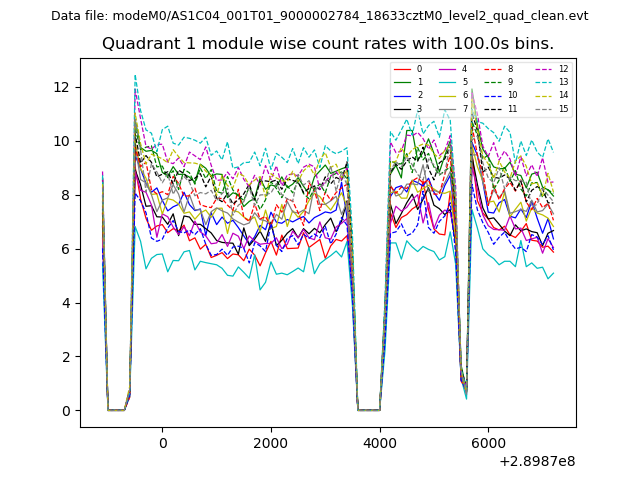
| Module-wise count rates for Quadrant A Data is divided into 100 sec bins |
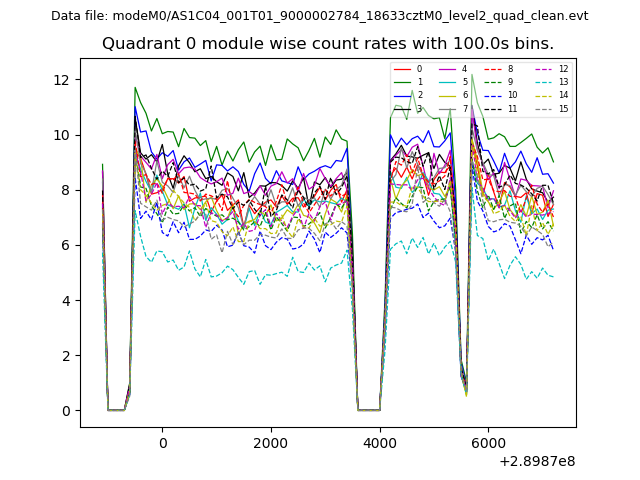 |
 |
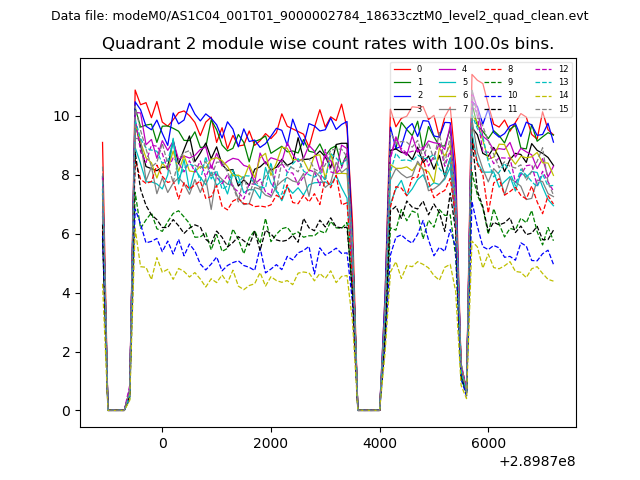
| Module-wise count rates for Quadrant B Data is divided into 100 sec bins |
 |
 |
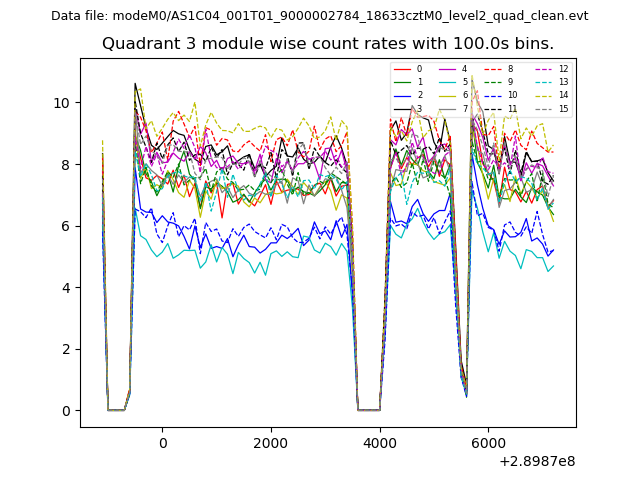
| Module-wise count rates for Quadrant C Data is divided into 100 sec bins |
 |
 |
| Module-wise count rates for Quadrant D Data is divided into 100 sec bins |
 |
 |
| Parameter | Plot |
|---|---|
| CZT HV Monitor | 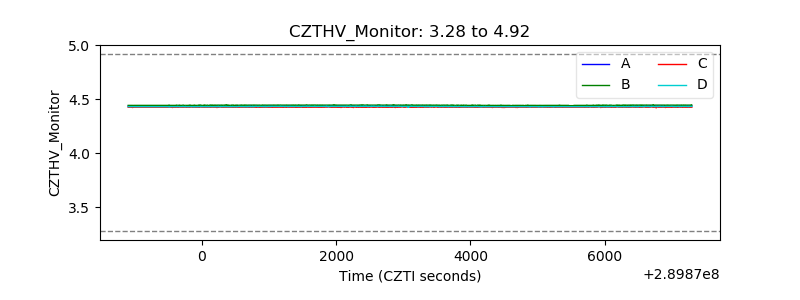 |
| D_VDD | 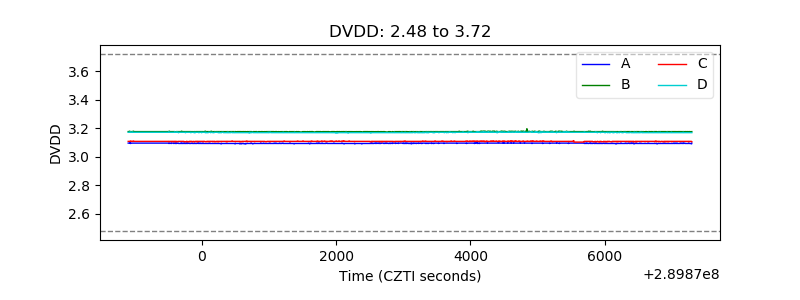 |
| Temperature 1 |  |
| Veto HV Monitor |  |
| Veto LLD |  |
| Alpha Counter | 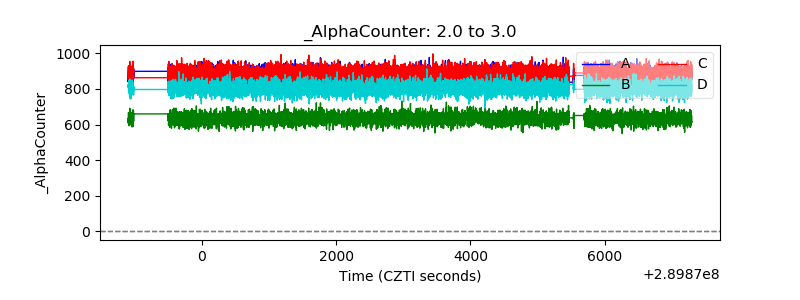 |
| _CPM_Rate | 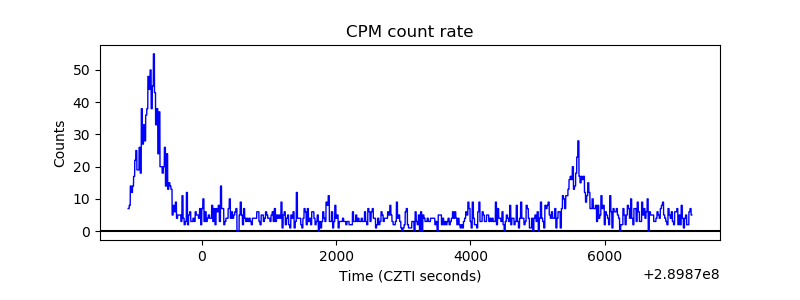 |
| CZT Counter | 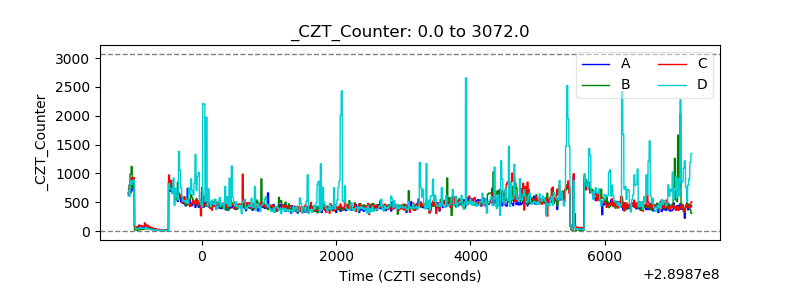 |
| +2.5 Volts monitor |  |
| +5 Volts monitor |  |
| _ROLL_ROT | 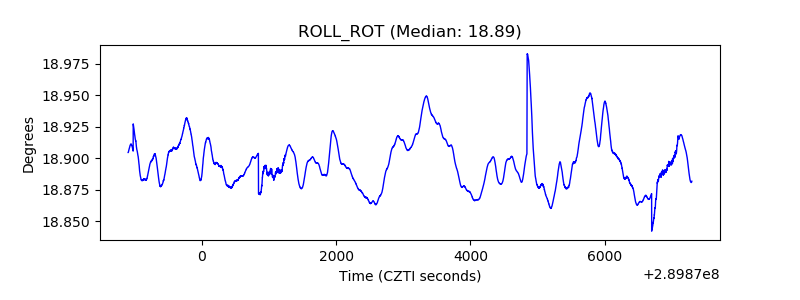 |
| _Roll_DEC | 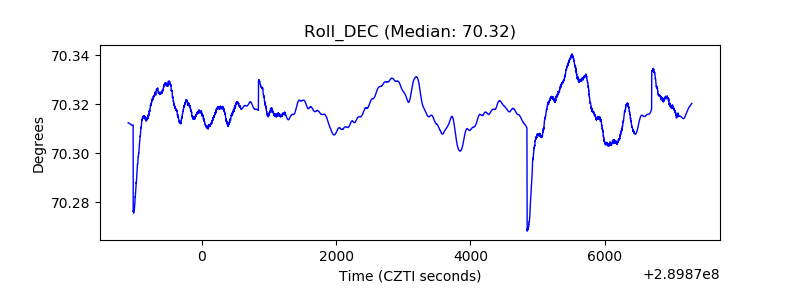 |
| _Roll_RA | 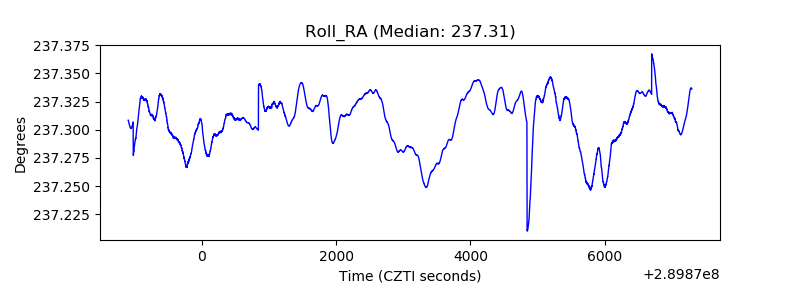 |
| Veto Counter | 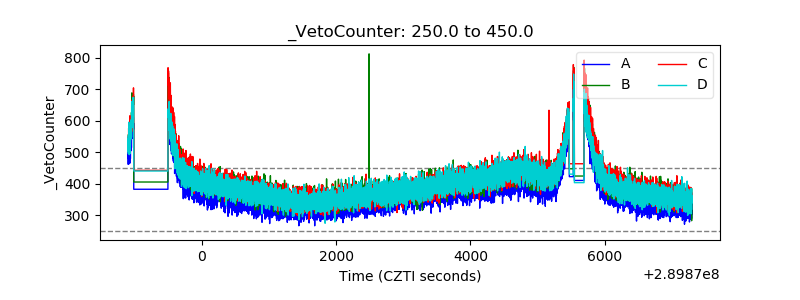 |