| Param | Original file | Final file |
|---|---|---|
| Filename | modeM0/AS1C04_001T01_9000002784_18634cztM0_level2.evt | modeM0/AS1C04_001T01_9000002784_18634cztM0_level2_quad_clean.evt |
| Size (bytes) | 608,276,160 | 139,354,560 |
| Size | 580.1 MB | 132.9 MB |
| Events in quadrant A | 3,711,762 | 920,135 |
| Events in quadrant B | 4,446,394 | 931,142 |
| Events in quadrant C | 3,854,349 | 929,265 |
| Events in quadrant D | 5,864,947 | 882,154 |
| Mode SS | |||
|---|---|---|---|
| Quadrant | BADHDUFLAG | Total packets | Discarded packets |
| A | 0 | 166 | 0 |
| B | 0 | 166 | 0 |
| C | 0 | 166 | 0 |
| D | 0 | 166 | 0 |
| Mode M9 | |||
|---|---|---|---|
| Quadrant | BADHDUFLAG | Total packets | Discarded packets |
| A | 0 | 6 | 0 |
| B | 0 | 6 | 0 |
| C | 0 | 6 | 0 |
| D | 0 | 6 | 0 |
| Mode M0 | |||
|---|---|---|---|
| Quadrant | BADHDUFLAG | Total packets | Discarded packets |
| A | 0 | 16704 | 2 |
| B | 0 | 18669 | 2 |
| C | 0 | 16900 | 2 |
| D | 0 | 22865 | 3 |
| Quadrant | Total seconds | Saturated seconds | Saturation percentage |
|---|---|---|---|
| A | 8028 | 70 | 0.871948% |
| B | 8028 | 287 | 3.574988% |
| C | 8028 | 144 | 1.793722% |
| D | 8028 | 449 | 5.592925% |
Noise dominated data is calculated using 1-second bins in cleaned event files. If a bin has >2000 counts, and if more than 50% of those come from <1% of pixels, then it is considered to be noise-dominated and hence unusable.
| Quadrant | # 1 sec bins | Bins with >0 counts | Bins with >2000 counts | High rate bins dominated by noise | Noise dominated (total time) | Noise dominated (detector-on time) | Marked lightcurve |
|---|---|---|---|---|---|---|---|
| A | 8533 | 8033 | 1 | 1 | 0.01% | 0.01% | 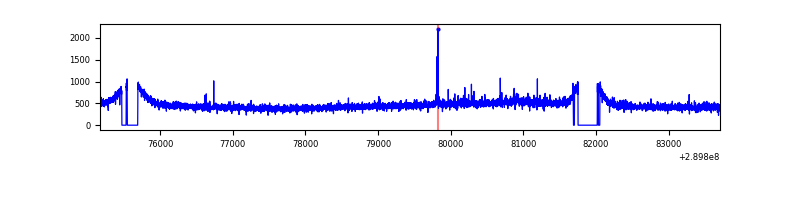 |
| B | 8533 | 8033 | 99 | 99 | 1.16% | 1.23% | 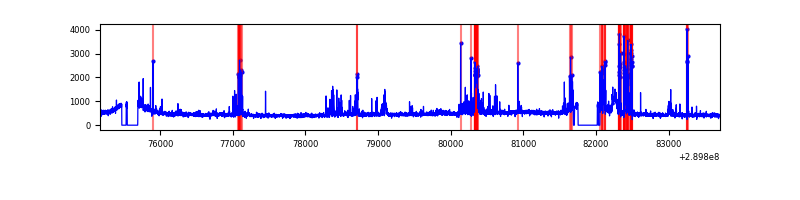 |
| C | 8533 | 8033 | 3 | 3 | 0.04% | 0.04% | 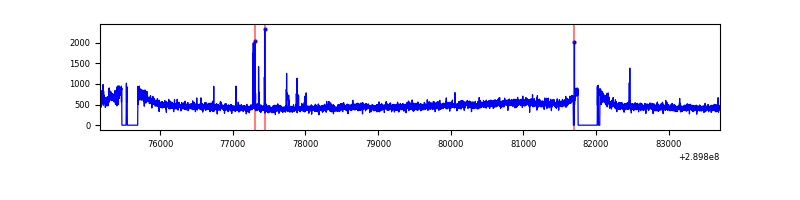 |
| D | 8533 | 8031 | 292 | 292 | 3.42% | 3.64% | 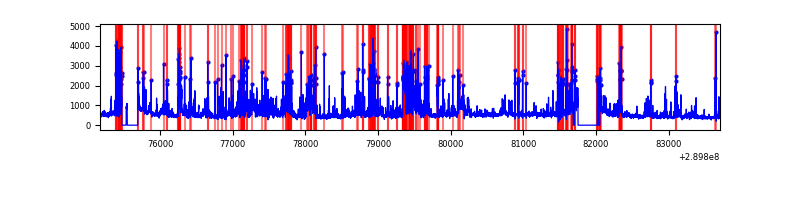 |
Top three noisy pixels from each quadrant. If the there are fewer than three noisy pixels in the level2.evt file, extra rows are filled as -1
| Pixel properties | Quadrant properties | ||||||
|---|---|---|---|---|---|---|---|
| Quadrant | DetID | PixID | Counts | Sigma | Mean | Median | Sigma |
| A | 3 | 1 | 29524 | 148.56 | 948 | 928 | 192.5 |
| A | 9 | 143 | 15753 | 77.02 | 948 | 928 | 192.5 |
| A | 13 | 254 | 11740 | 56.17 | 948 | 928 | 192.5 |
| B | 10 | 245 | 286559 | 1587.43 | 948 | 924 | 179.9 |
| B | 0 | 230 | 176724 | 977.02 | 948 | 924 | 179.9 |
| B | 12 | 18 | 72263 | 396.47 | 948 | 924 | 179.9 |
| C | 14 | 238 | 143082 | 653.98 | 928 | 931 | 217.4 |
| C | 3 | 233 | 49745 | 224.57 | 928 | 931 | 217.4 |
| C | 9 | 54 | 45887 | 206.82 | 928 | 931 | 217.4 |
| D | 1 | 52 | 1432318 | 6464.27 | 911 | 882 | 221.4 |
| D | 7 | 238 | 859894 | 3879.24 | 911 | 882 | 221.4 |
| D | 14 | 34 | 84310 | 376.76 | 911 | 882 | 221.4 |
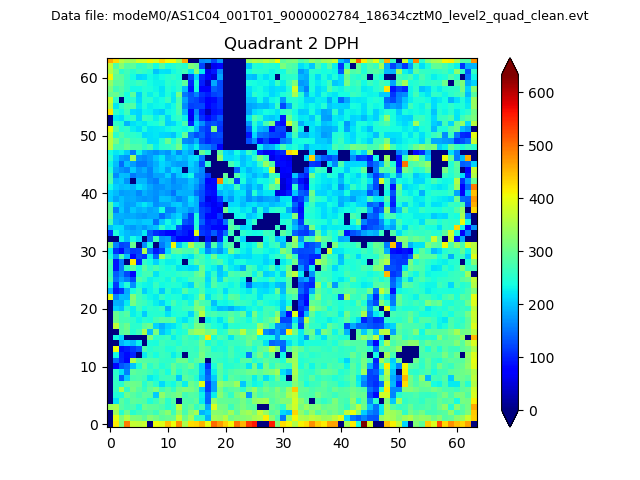
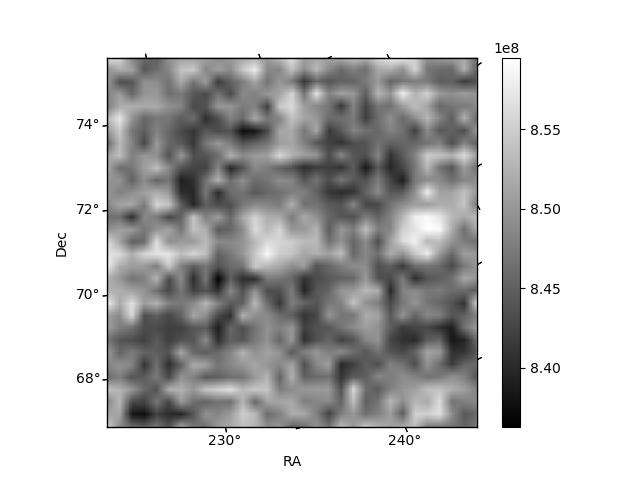
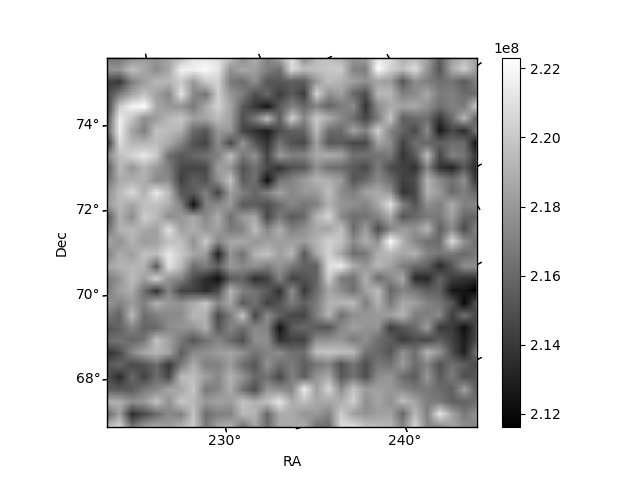
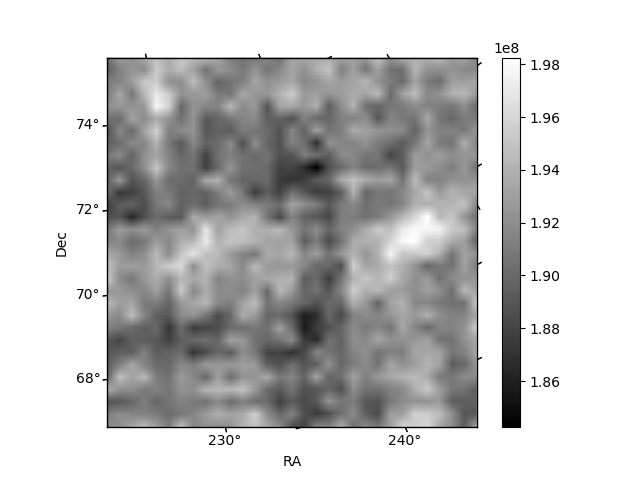
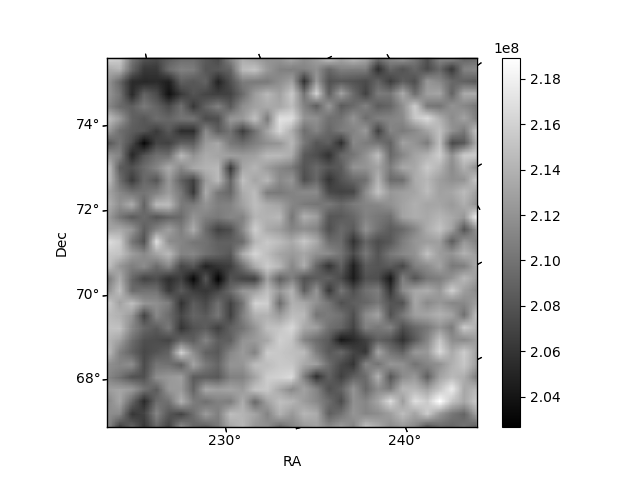
Histogram calculated using DETX and DETY for each event in the final _common_clean file
| Quadrant A | 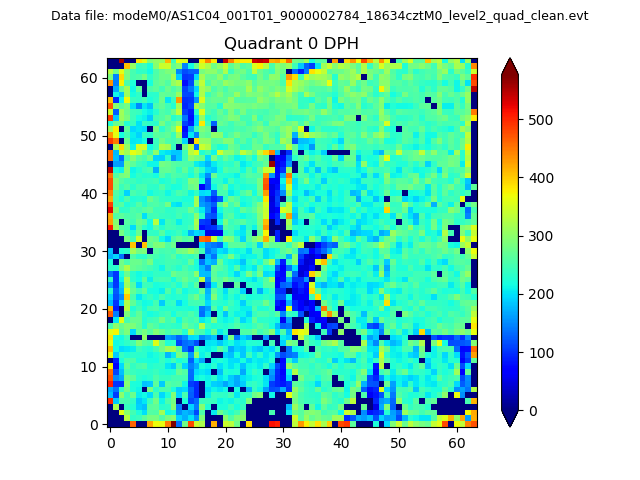 |
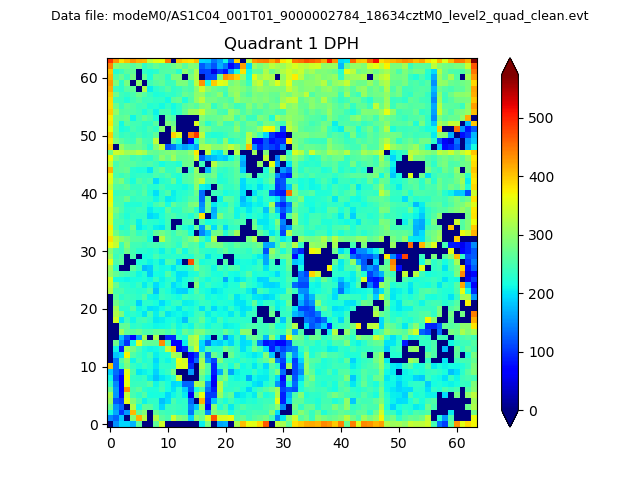 |
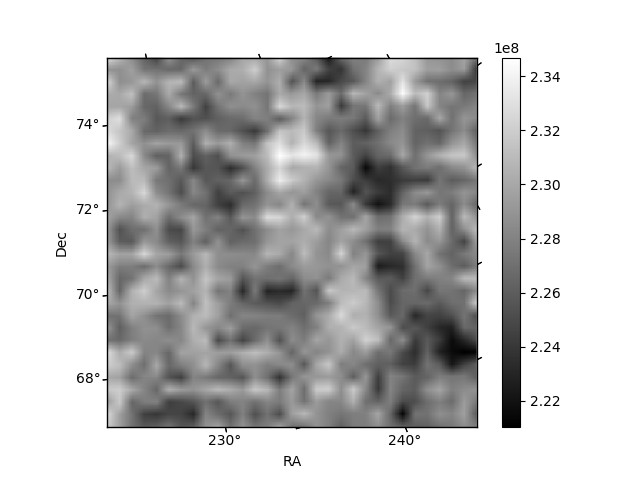
Quadrant B |
|---|---|---|---|
| Quadrant D | 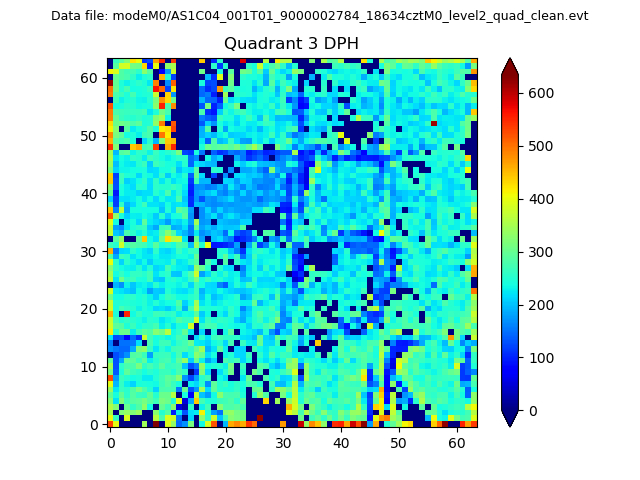 |
 |
Quadrant C |
| Plot type | Count rate plots | Images |
|---|---|---|
| Comparison with Poisson distribution Blue bars denote a histogram of data divided into 1 sec bins. Red curve is a Poisson curve with rate = median count rate of data. |
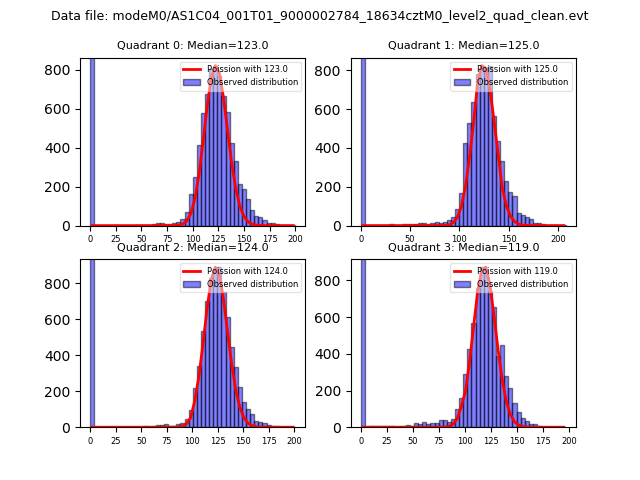 |
 |
| Quadrant-wise count rates Data is divided into 100 sec bins |
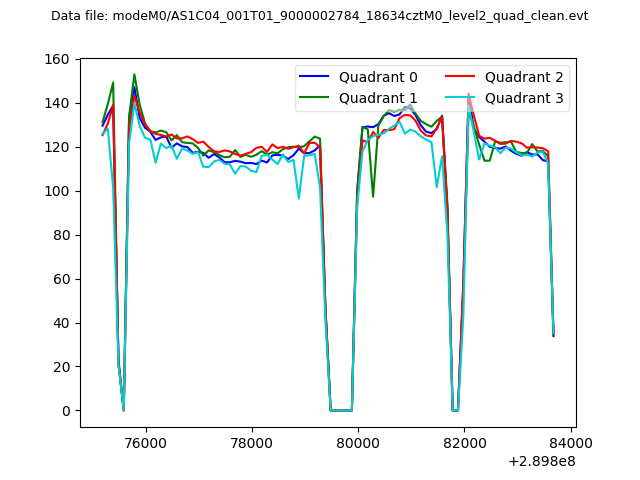 |
|
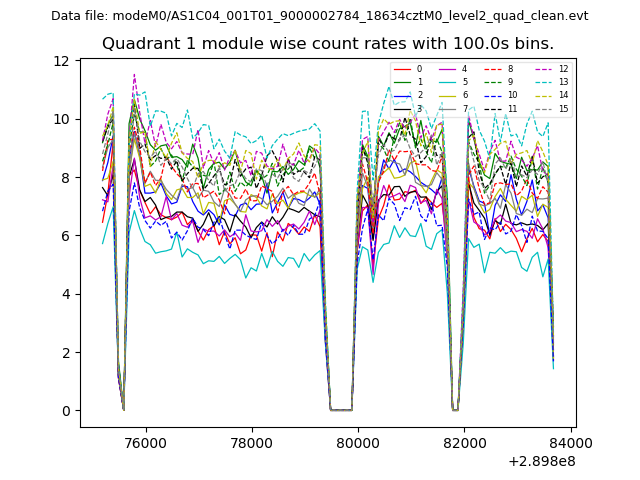
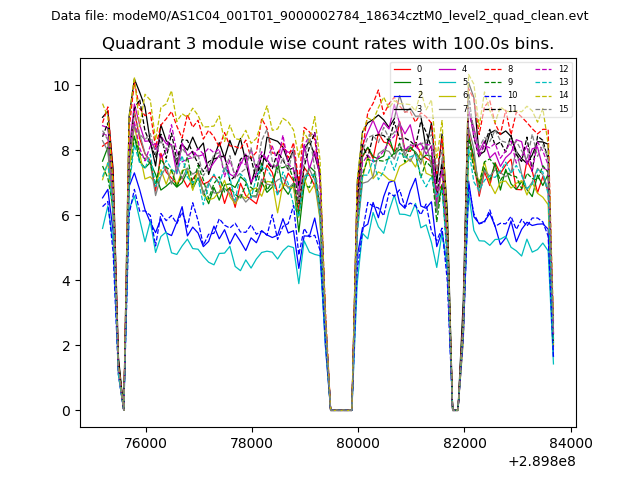
| Module-wise count rates for Quadrant A Data is divided into 100 sec bins |
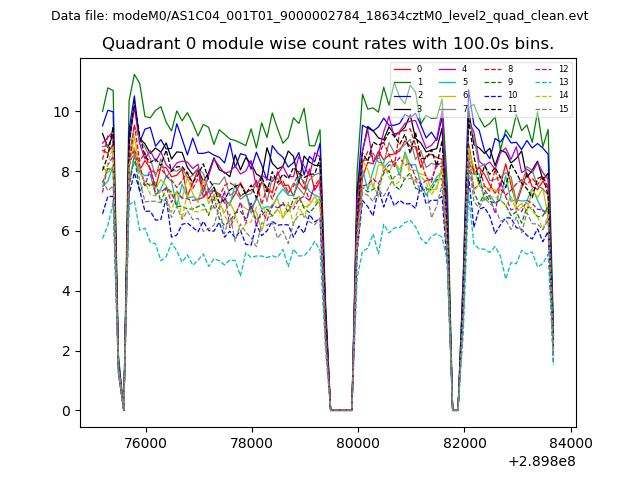 |
 |
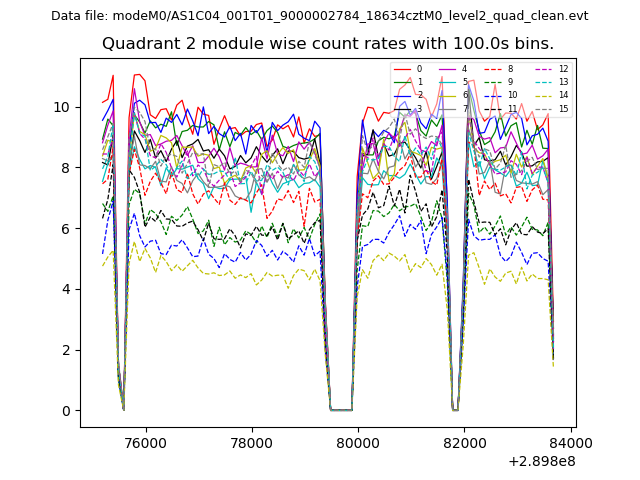
| Module-wise count rates for Quadrant B Data is divided into 100 sec bins |
 |
 |
| Module-wise count rates for Quadrant C Data is divided into 100 sec bins |
 |
 |
| Module-wise count rates for Quadrant D Data is divided into 100 sec bins |
 |
 |
| Parameter | Plot |
|---|---|
| CZT HV Monitor | 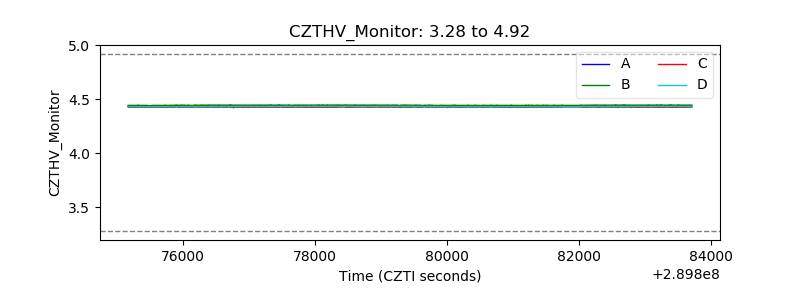 |
| D_VDD | 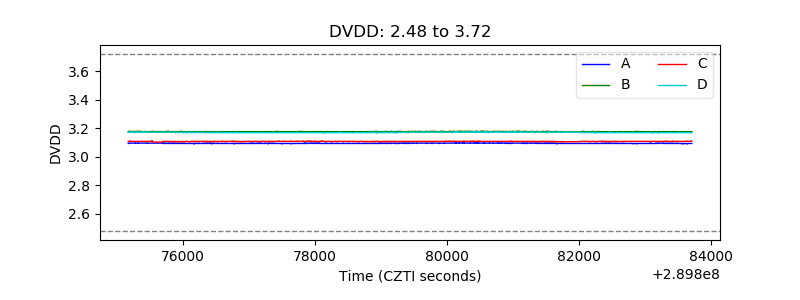 |
| Temperature 1 | 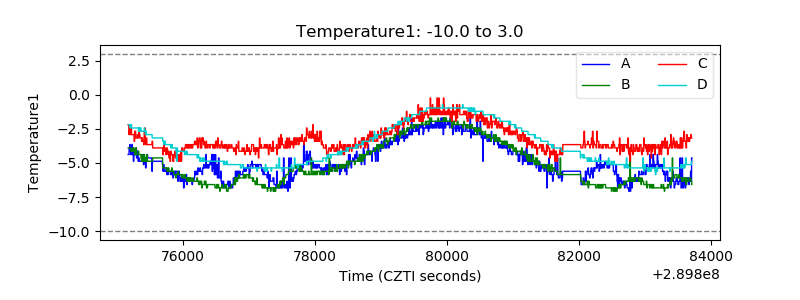 |
| Veto HV Monitor | 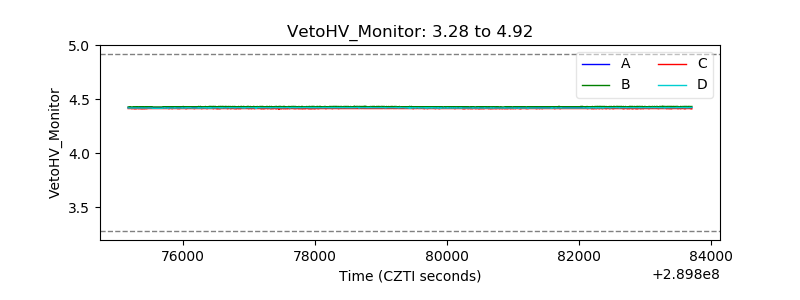 |
| Veto LLD | 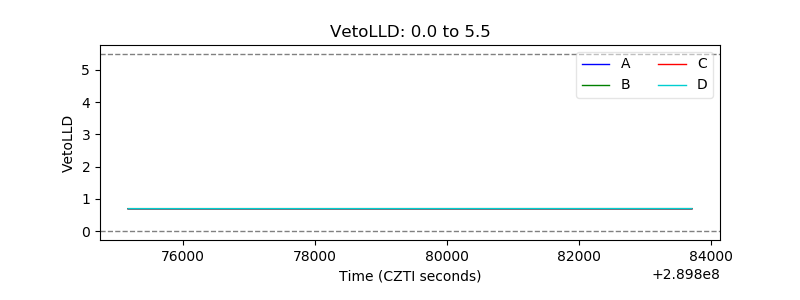 |
| Alpha Counter | 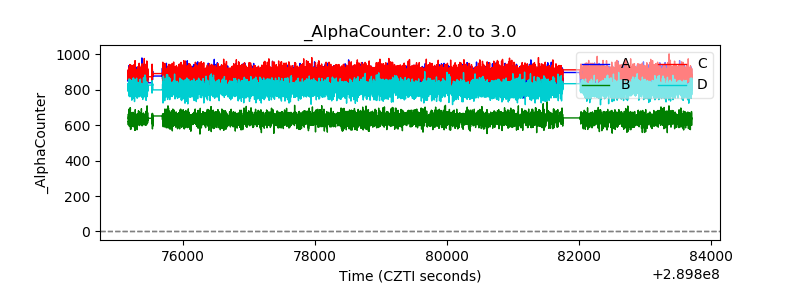 |
| _CPM_Rate | 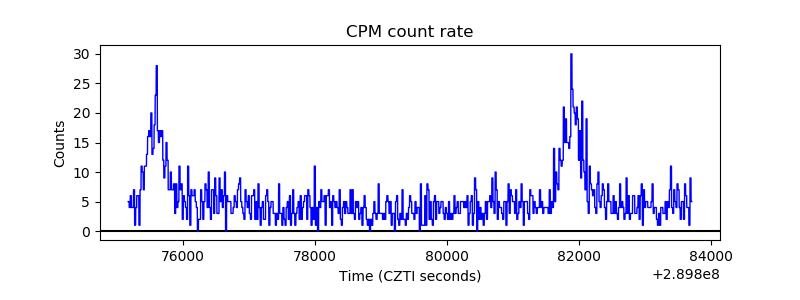 |
| CZT Counter | 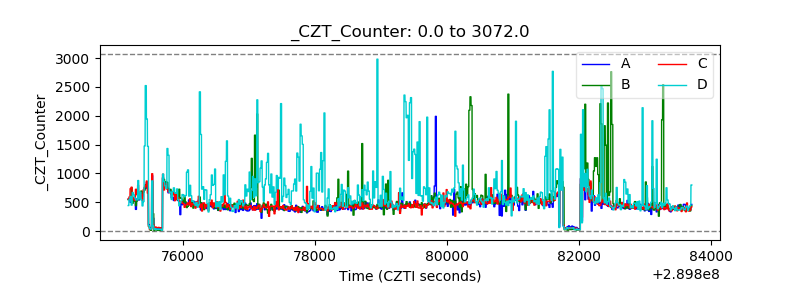 |
| +2.5 Volts monitor |  |
| +5 Volts monitor |  |
| _ROLL_ROT | 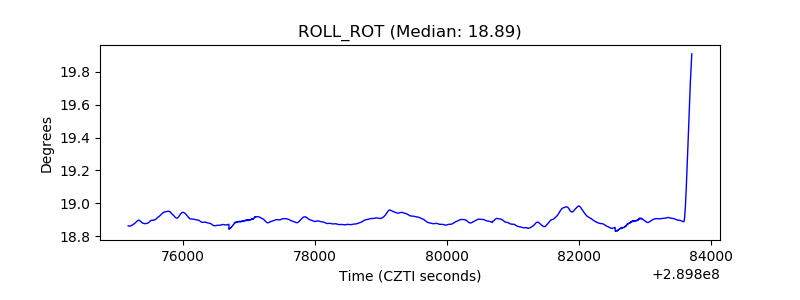 |
| _Roll_DEC | 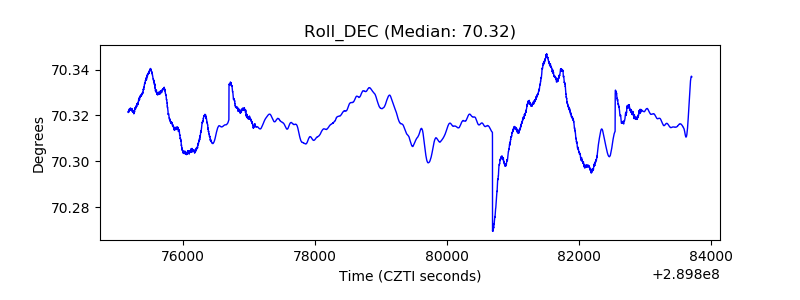 |
| _Roll_RA | 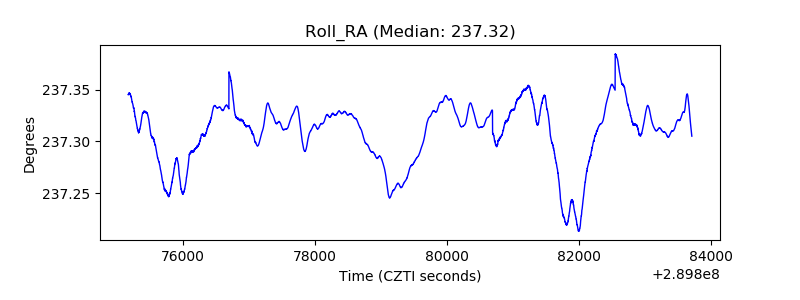 |
| Veto Counter | 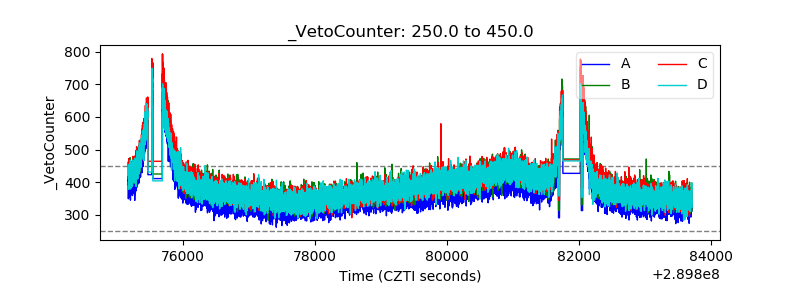 |