| Param | Original file | Final file |
|---|---|---|
| Filename | modeM0/AS1C04_001T01_9000002784_18637cztM0_level2.evt | modeM0/AS1C04_001T01_9000002784_18637cztM0_level2_quad_clean.evt |
| Size (bytes) | 827,959,680 | 163,123,200 |
| Size | 789.6 MB | 155.6 MB |
| Events in quadrant A | 4,880,037 | 1,093,113 |
| Events in quadrant B | 8,740,274 | 1,033,396 |
| Events in quadrant C | 4,647,848 | 1,089,754 |
| Events in quadrant D | 6,139,173 | 1,040,026 |
| Mode SS | |||
|---|---|---|---|
| Quadrant | BADHDUFLAG | Total packets | Discarded packets |
| A | 0 | 200 | 0 |
| B | 0 | 200 | 0 |
| C | 0 | 200 | 0 |
| D | 0 | 200 | 0 |
| Mode M9 | |||
|---|---|---|---|
| Quadrant | BADHDUFLAG | Total packets | Discarded packets |
| A | 0 | 16 | 0 |
| B | 0 | 16 | 0 |
| C | 0 | 16 | 0 |
| D | 0 | 16 | 0 |
| Mode M0 | |||
|---|---|---|---|
| Quadrant | BADHDUFLAG | Total packets | Discarded packets |
| A | 0 | 21000 | 2 |
| B | 0 | 32491 | 2 |
| C | 0 | 20077 | 2 |
| D | 0 | 24854 | 2 |
| Quadrant | Total seconds | Saturated seconds | Saturation percentage |
|---|---|---|---|
| A | 9869 | 141 | 1.428716% |
| B | 9870 | 1329 | 13.465046% |
| C | 9870 | 68 | 0.688956% |
| D | 9870 | 474 | 4.802432% |
Noise dominated data is calculated using 1-second bins in cleaned event files. If a bin has >2000 counts, and if more than 50% of those come from <1% of pixels, then it is considered to be noise-dominated and hence unusable.
| Quadrant | # 1 sec bins | Bins with >0 counts | Bins with >2000 counts | High rate bins dominated by noise | Noise dominated (total time) | Noise dominated (detector-on time) | Marked lightcurve |
|---|---|---|---|---|---|---|---|
| A | 11334 | 9871 | 73 | 73 | 0.64% | 0.74% | 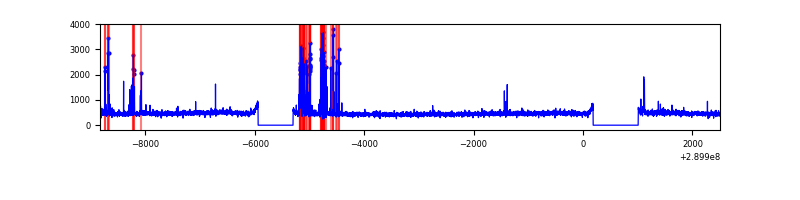 |
| B | 11335 | 9871 | 962 | 962 | 8.49% | 9.75% | 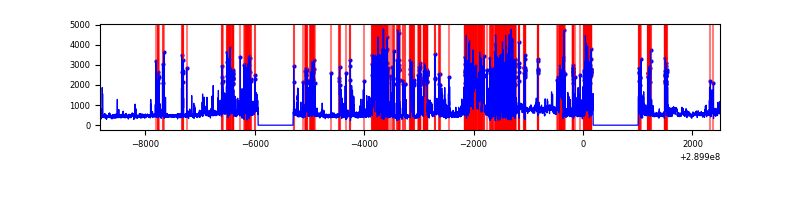 |
| C | 11335 | 9872 | 1 | 1 | 0.01% | 0.01% | 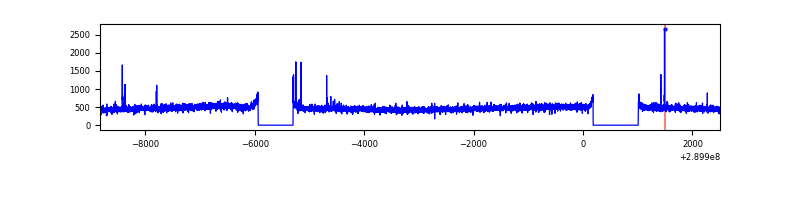 |
| D | 11335 | 9872 | 416 | 416 | 3.67% | 4.21% | 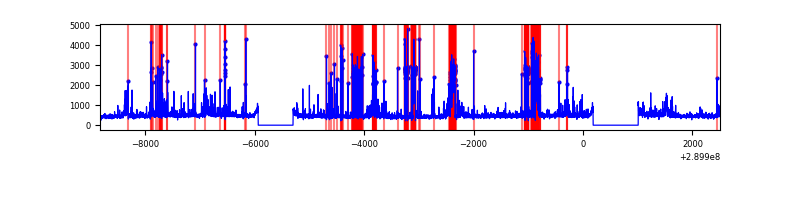 |
Top three noisy pixels from each quadrant. If the there are fewer than three noisy pixels in the level2.evt file, extra rows are filled as -1
| Pixel properties | Quadrant properties | ||||||
|---|---|---|---|---|---|---|---|
| Quadrant | DetID | PixID | Counts | Sigma | Mean | Median | Sigma |
| A | 6 | 16 | 307795 | 1294.04 | 1163 | 1134 | 237.0 |
| A | 9 | 143 | 38321 | 156.92 | 1163 | 1134 | 237.0 |
| A | 4 | 2 | 33924 | 138.36 | 1163 | 1134 | 237.0 |
| B | 10 | 245 | 4318268 | 20746.29 | 1099 | 1071 | 208.1 |
| B | 0 | 197 | 36201 | 168.82 | 1099 | 1071 | 208.1 |
| B | 12 | 111 | 25947 | 119.54 | 1099 | 1071 | 208.1 |
| C | 14 | 238 | 175061 | 661.26 | 1129 | 1137 | 263.0 |
| C | 9 | 54 | 39271 | 144.99 | 1129 | 1137 | 263.0 |
| C | 3 | 233 | 14783 | 51.88 | 1129 | 1137 | 263.0 |
| D | 1 | 52 | 824186 | 3039.86 | 1116 | 1080 | 270.8 |
| D | 7 | 223 | 580932 | 2141.49 | 1116 | 1080 | 270.8 |
| D | 7 | 238 | 436770 | 1609.07 | 1116 | 1080 | 270.8 |
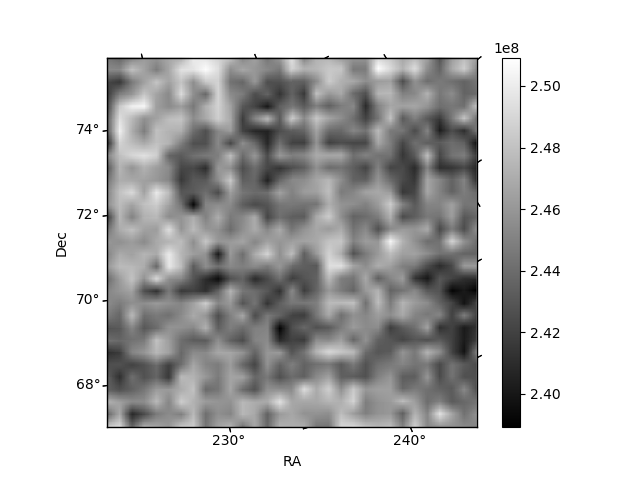
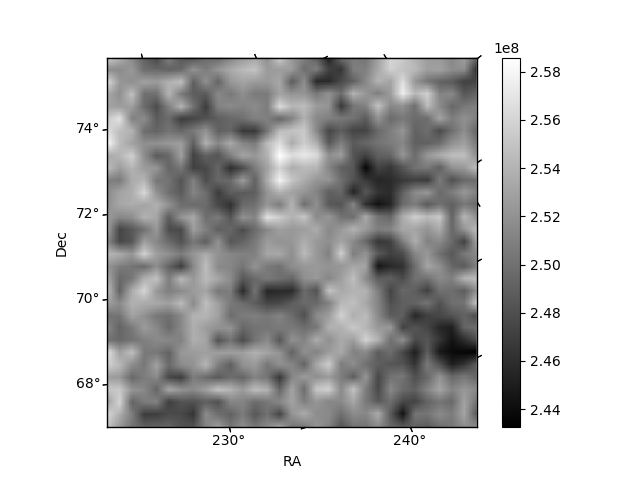
Histogram calculated using DETX and DETY for each event in the final _common_clean file
| Quadrant A | 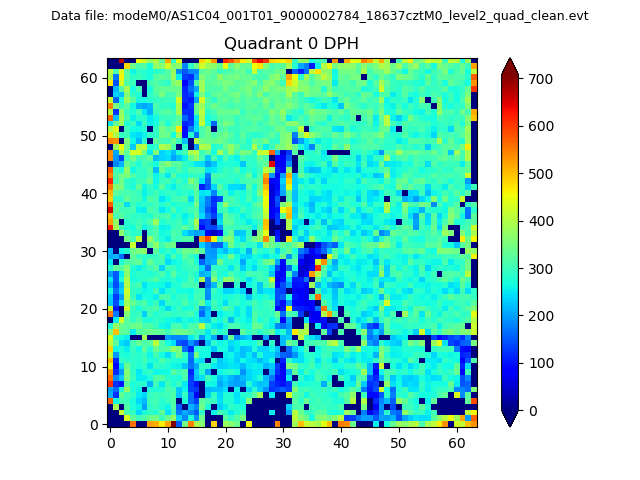 |
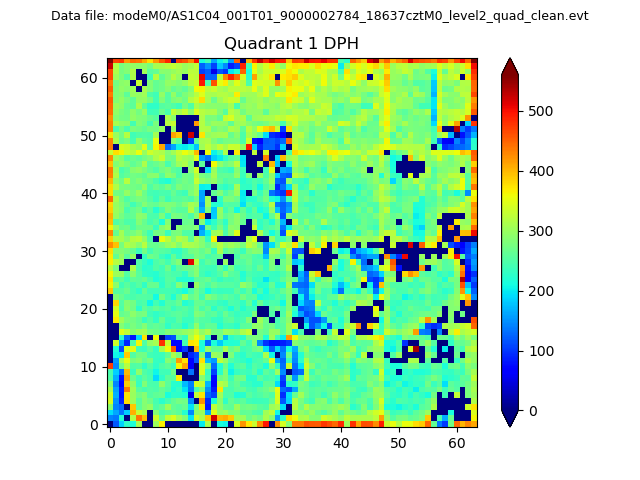 |
Quadrant B |
|---|---|---|---|
| Quadrant D |  |
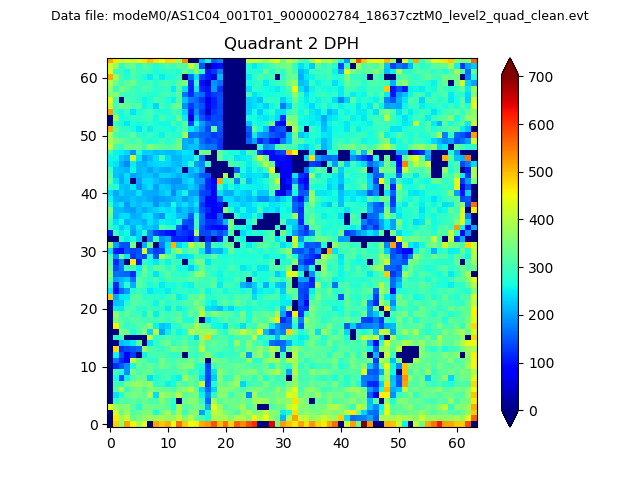 |
Quadrant C |
| Plot type | Count rate plots | Images |
|---|---|---|
| Comparison with Poisson distribution Blue bars denote a histogram of data divided into 1 sec bins. Red curve is a Poisson curve with rate = median count rate of data. |
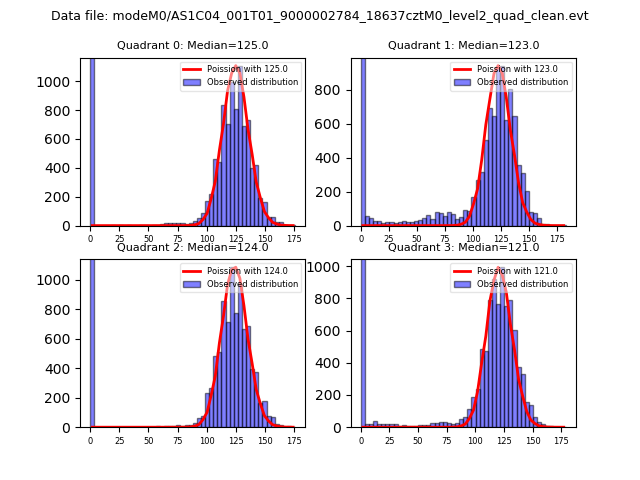 |
 |
| Quadrant-wise count rates Data is divided into 100 sec bins |
 |
|
| Module-wise count rates for Quadrant A Data is divided into 100 sec bins |
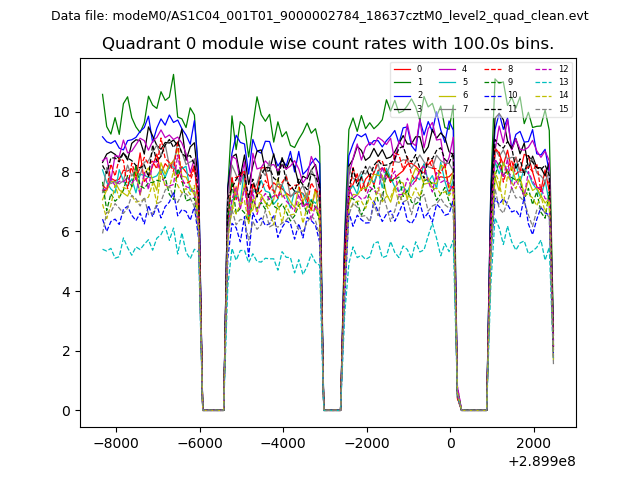 |
 |
| Module-wise count rates for Quadrant B Data is divided into 100 sec bins |
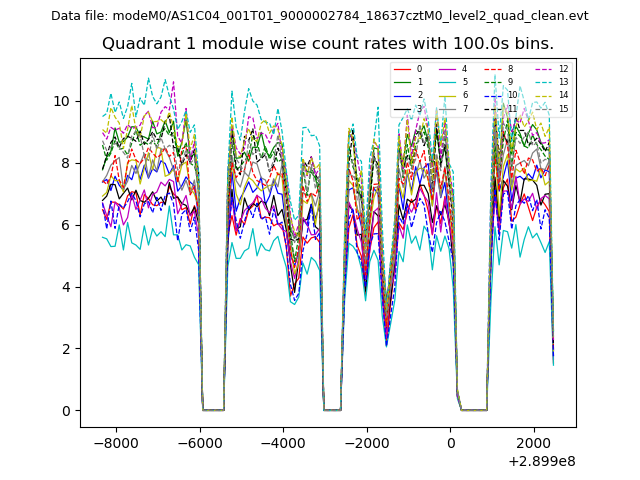 |
 |
| Module-wise count rates for Quadrant C Data is divided into 100 sec bins |
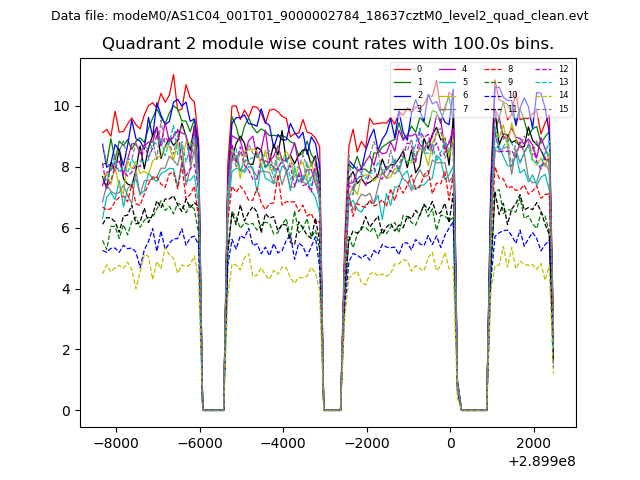 |
 |
| Module-wise count rates for Quadrant D Data is divided into 100 sec bins |
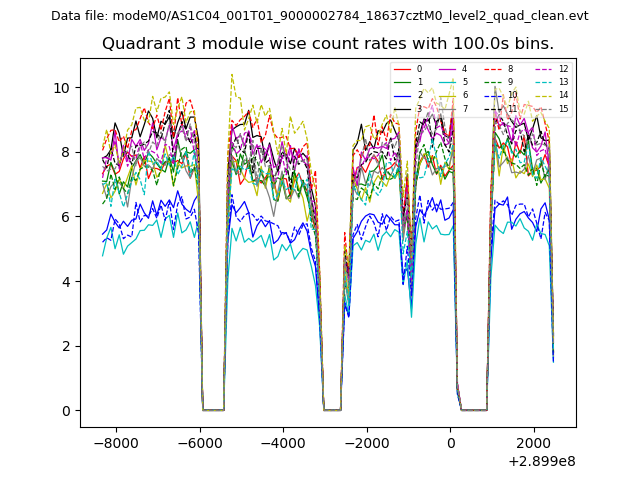 |
 |
| Parameter | Plot |
|---|---|
| CZT HV Monitor | 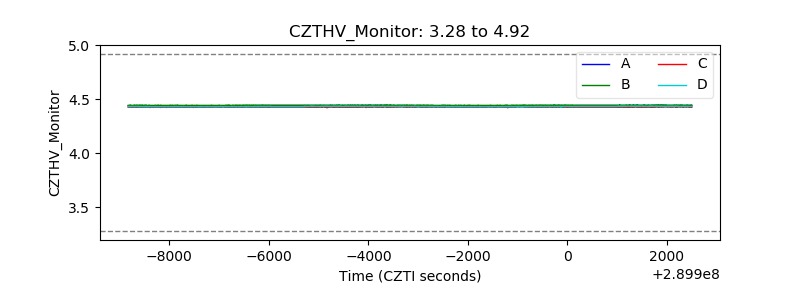 |
| D_VDD | 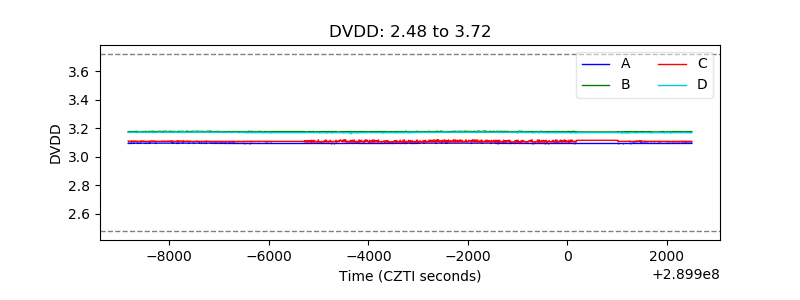 |
| Temperature 1 | 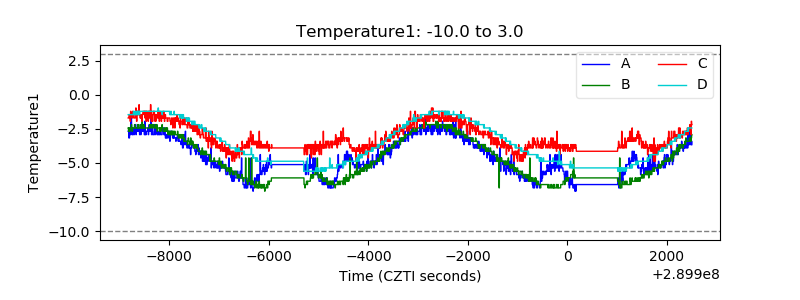 |
| Veto HV Monitor |  |
| Veto LLD | 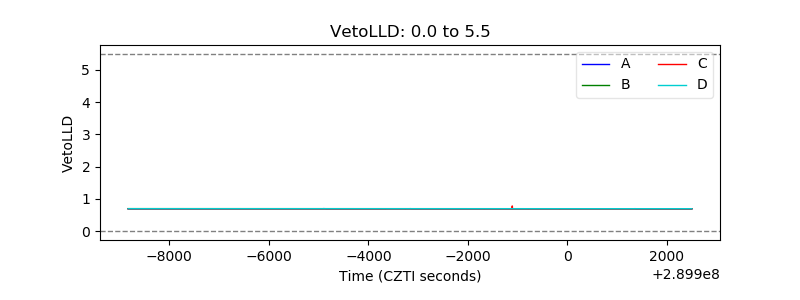 |
| Alpha Counter | 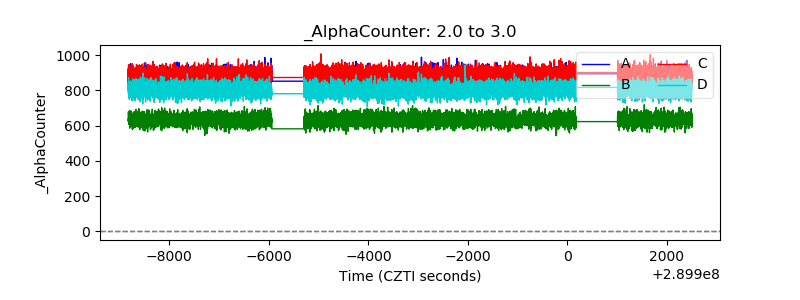 |
| _CPM_Rate | 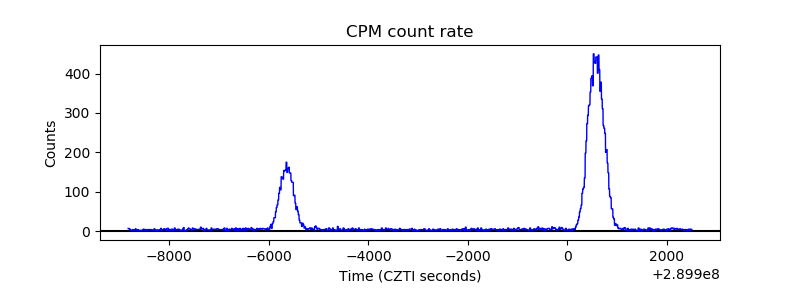 |
| CZT Counter | 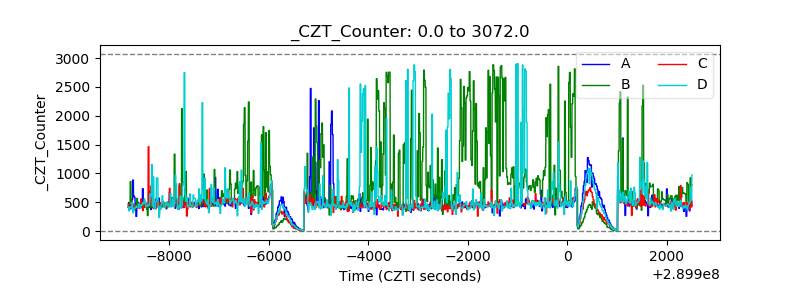 |
| +2.5 Volts monitor | 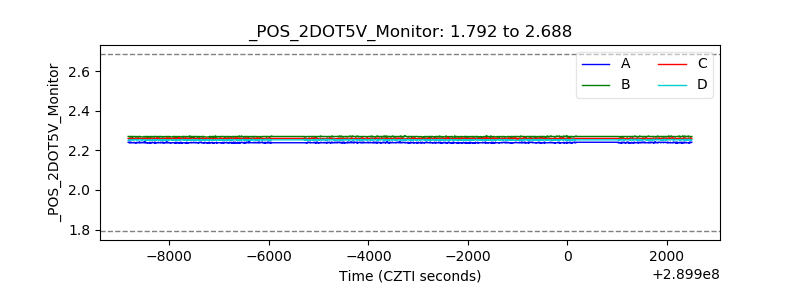 |
| +5 Volts monitor |  |
| _ROLL_ROT | 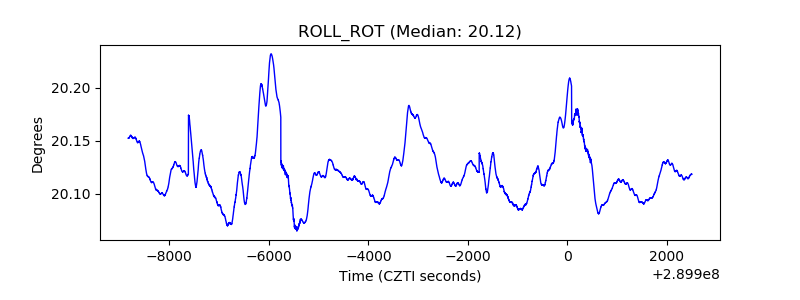 |
| _Roll_DEC | 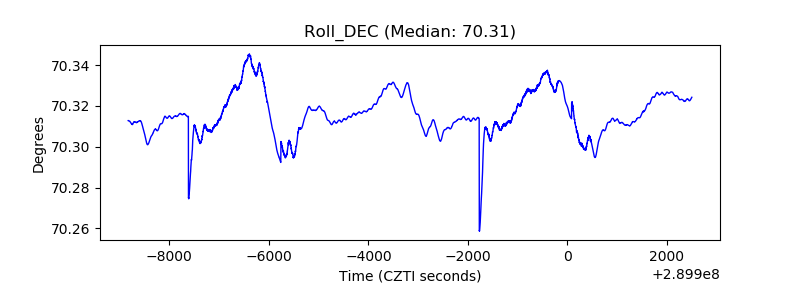 |
| _Roll_RA | 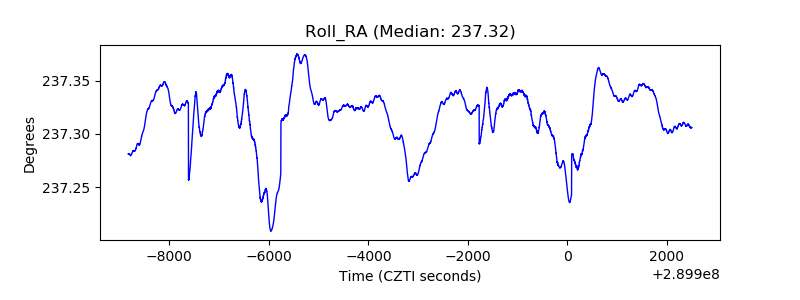 |
| Veto Counter | 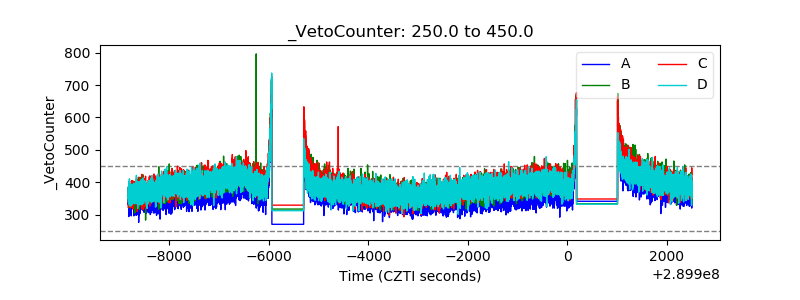 |