| Param | Original file | Final file |
|---|---|---|
| Filename | modeM0/AS1C04_001T01_9000002784_18640cztM0_level2.evt | modeM0/AS1C04_001T01_9000002784_18640cztM0_level2_quad_clean.evt |
| Size (bytes) | 592,980,480 | 111,159,360 |
| Size | 565.5 MB | 106.0 MB |
| Events in quadrant A | 3,173,408 | 748,130 |
| Events in quadrant B | 6,758,781 | 712,291 |
| Events in quadrant C | 3,208,662 | 734,763 |
| Events in quadrant D | 4,374,775 | 714,979 |
| Mode SS | |||
|---|---|---|---|
| Quadrant | BADHDUFLAG | Total packets | Discarded packets |
| A | 0 | 132 | 0 |
| B | 0 | 132 | 0 |
| C | 0 | 132 | 0 |
| D | 0 | 132 | 0 |
| Mode M9 | |||
|---|---|---|---|
| Quadrant | BADHDUFLAG | Total packets | Discarded packets |
| A | 0 | 11 | 0 |
| B | 0 | 11 | 0 |
| C | 0 | 11 | 0 |
| D | 0 | 11 | 0 |
| Mode M0 | |||
|---|---|---|---|
| Quadrant | BADHDUFLAG | Total packets | Discarded packets |
| A | 0 | 13633 | 1 |
| B | 0 | 24659 | 1 |
| C | 0 | 13633 | 1 |
| D | 0 | 17239 | 1 |
| Quadrant | Total seconds | Saturated seconds | Saturation percentage |
|---|---|---|---|
| A | 6542 | 50 | 0.764292% |
| B | 6543 | 1020 | 15.589179% |
| C | 6543 | 71 | 1.085129% |
| D | 6542 | 208 | 3.179456% |
Noise dominated data is calculated using 1-second bins in cleaned event files. If a bin has >2000 counts, and if more than 50% of those come from <1% of pixels, then it is considered to be noise-dominated and hence unusable.
| Quadrant | # 1 sec bins | Bins with >0 counts | Bins with >2000 counts | High rate bins dominated by noise | Noise dominated (total time) | Noise dominated (detector-on time) | Marked lightcurve |
|---|---|---|---|---|---|---|---|
| A | 7642 | 6542 | 1 | 1 | 0.01% | 0.02% | 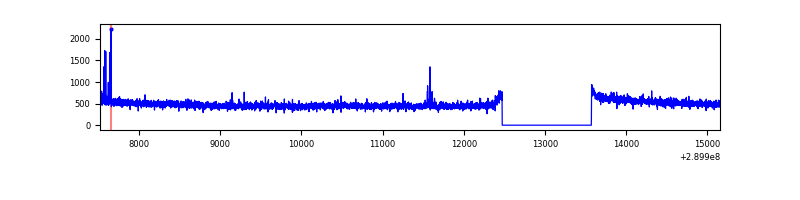 |
| B | 7642 | 6542 | 711 | 711 | 9.30% | 10.87% | 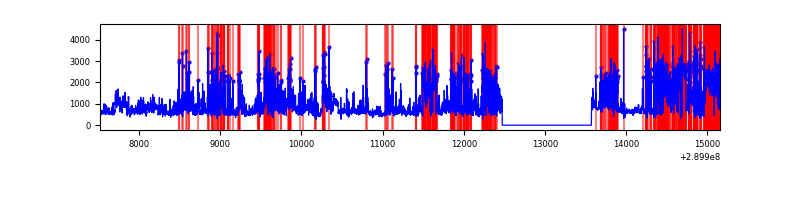 |
| C | 7643 | 6543 | 0 | 0 | 0.00% | 0.00% | 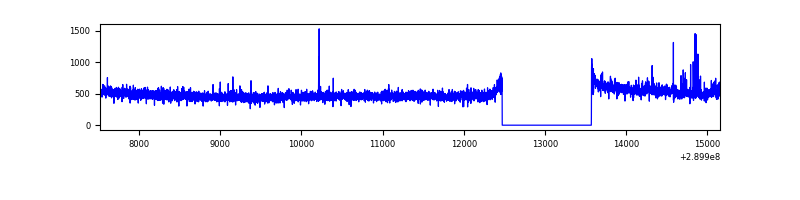 |
| D | 7642 | 6542 | 155 | 155 | 2.03% | 2.37% | 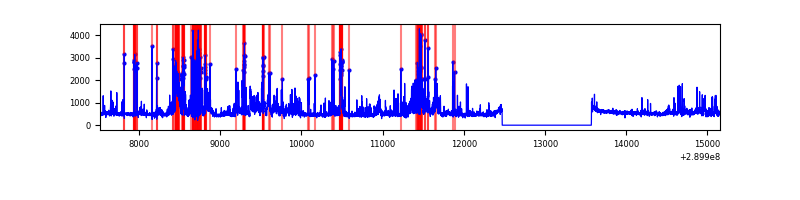 |
Top three noisy pixels from each quadrant. If the there are fewer than three noisy pixels in the level2.evt file, extra rows are filled as -1
| Pixel properties | Quadrant properties | ||||||
|---|---|---|---|---|---|---|---|
| Quadrant | DetID | PixID | Counts | Sigma | Mean | Median | Sigma |
| A | 0 | 13 | 28061 | 166.85 | 810 | 794 | 163.4 |
| A | 6 | 16 | 16451 | 95.81 | 810 | 794 | 163.4 |
| A | 13 | 254 | 9415 | 52.75 | 810 | 794 | 163.4 |
| B | 10 | 245 | 3561534 | 24845.71 | 758 | 740 | 143.3 |
| B | 12 | 18 | 67613 | 466.61 | 758 | 740 | 143.3 |
| B | 7 | 220 | 59216 | 408.02 | 758 | 740 | 143.3 |
| C | 14 | 238 | 122583 | 682.53 | 774 | 778 | 178.5 |
| C | 3 | 233 | 62358 | 345.06 | 774 | 778 | 178.5 |
| C | 9 | 54 | 5473 | 26.31 | 774 | 778 | 178.5 |
| D | 7 | 238 | 789803 | 4139.13 | 783 | 758 | 190.6 |
| D | 1 | 52 | 537805 | 2817.22 | 783 | 758 | 190.6 |
| D | 10 | 70 | 34899 | 179.1 | 783 | 758 | 190.6 |
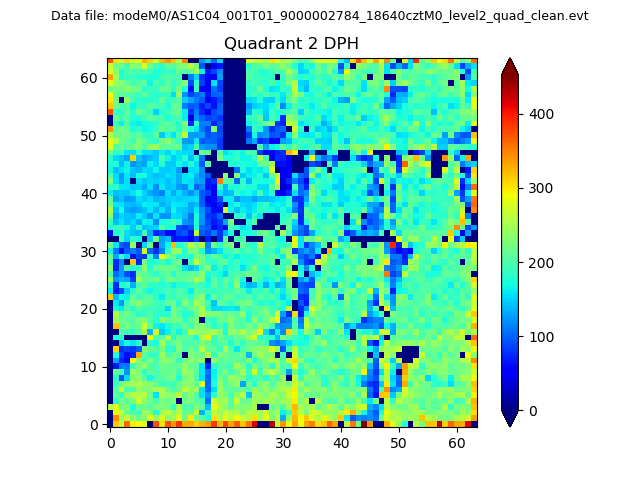
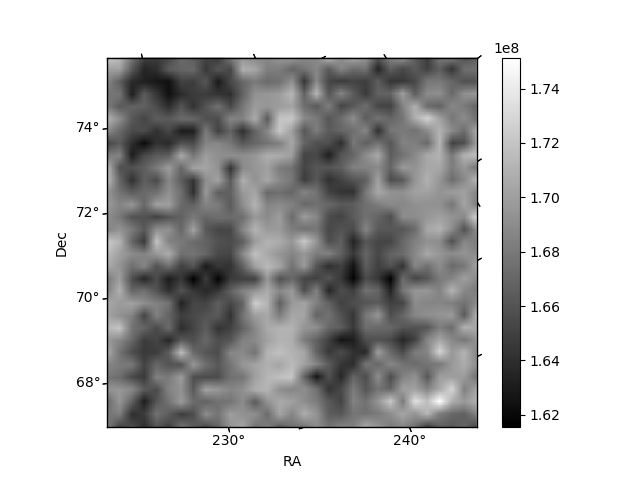
Histogram calculated using DETX and DETY for each event in the final _common_clean file
| Quadrant A | 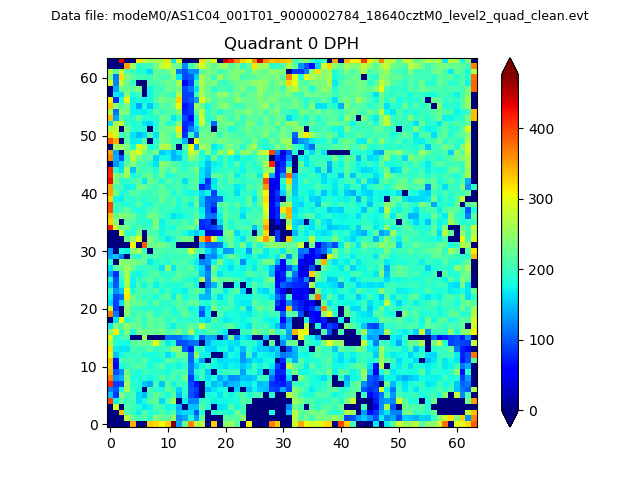 |
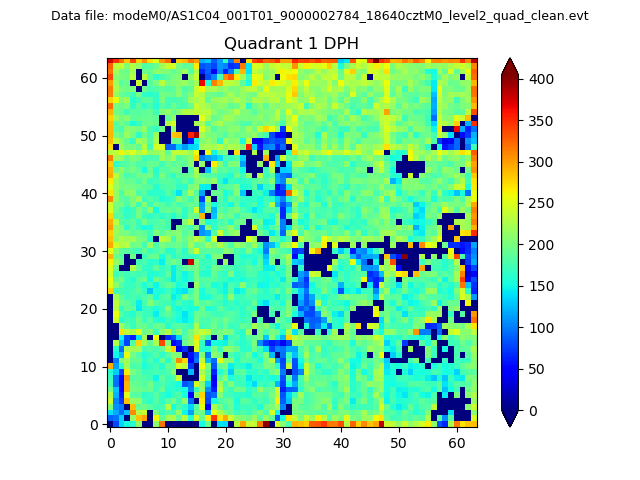 |
Quadrant B |
|---|---|---|---|
| Quadrant D | 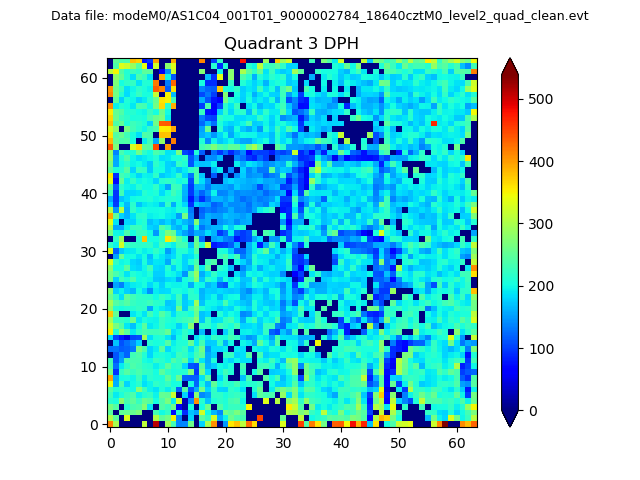 |
 |
Quadrant C |
| Plot type | Count rate plots | Images |
|---|---|---|
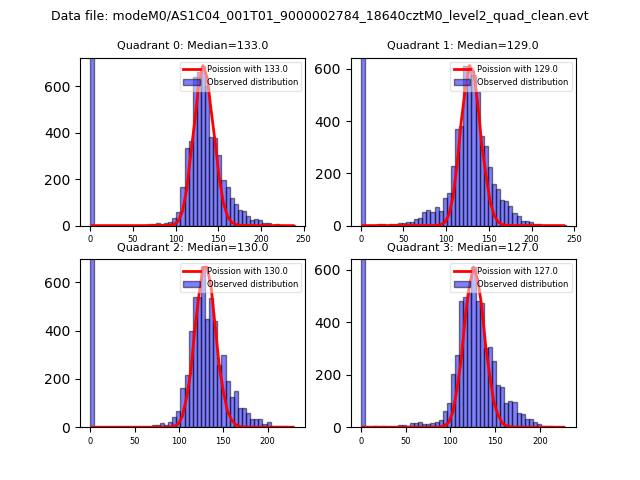
| Comparison with Poisson distribution Blue bars denote a histogram of data divided into 1 sec bins. Red curve is a Poisson curve with rate = median count rate of data. |
 |
 |
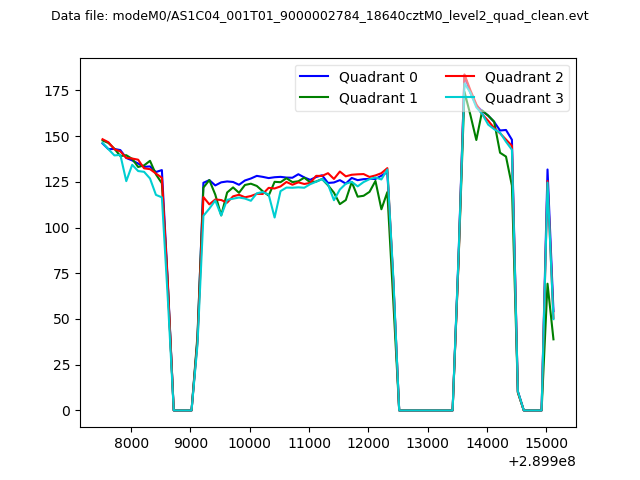
| Quadrant-wise count rates Data is divided into 100 sec bins |
 |
|
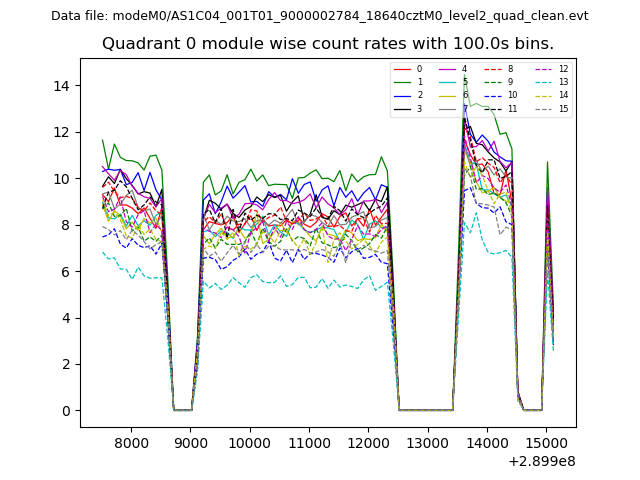
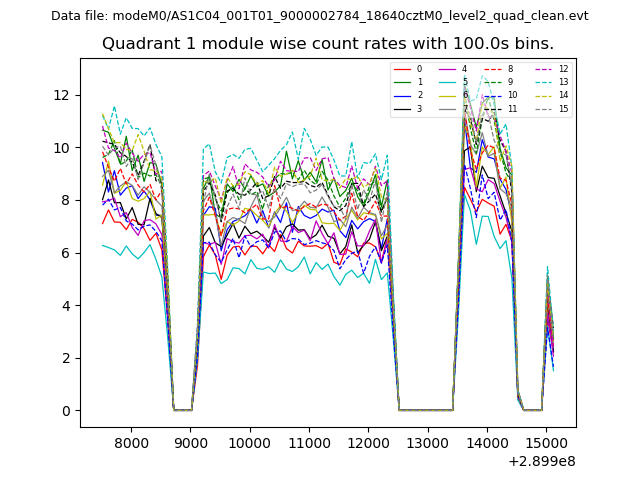
| Module-wise count rates for Quadrant A Data is divided into 100 sec bins |
 |
 |
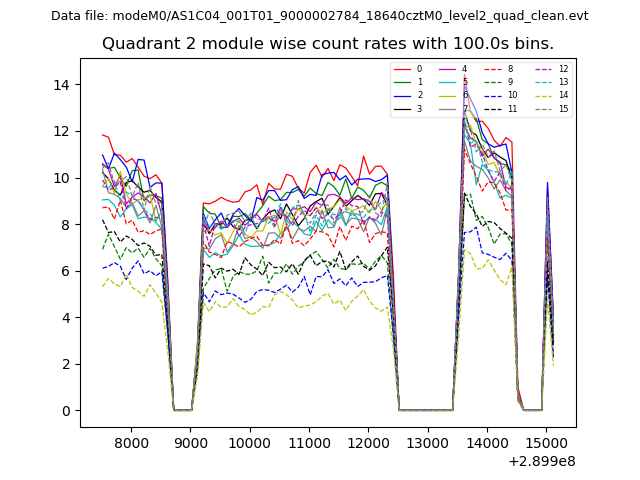
| Module-wise count rates for Quadrant B Data is divided into 100 sec bins |
 |
 |
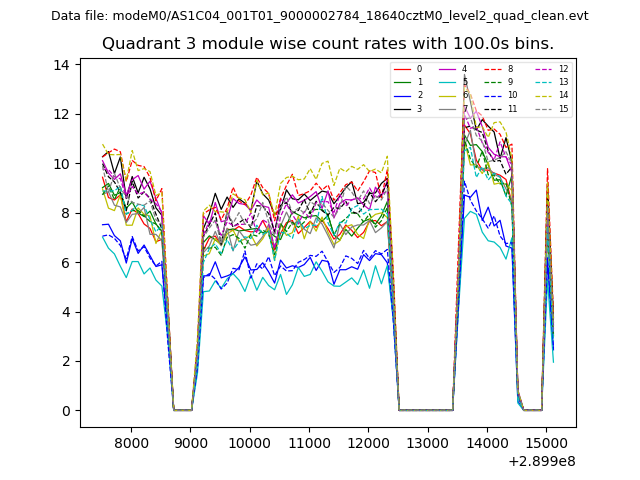
| Module-wise count rates for Quadrant C Data is divided into 100 sec bins |
 |
 |
| Module-wise count rates for Quadrant D Data is divided into 100 sec bins |
 |
 |
| Parameter | Plot |
|---|---|
| CZT HV Monitor | 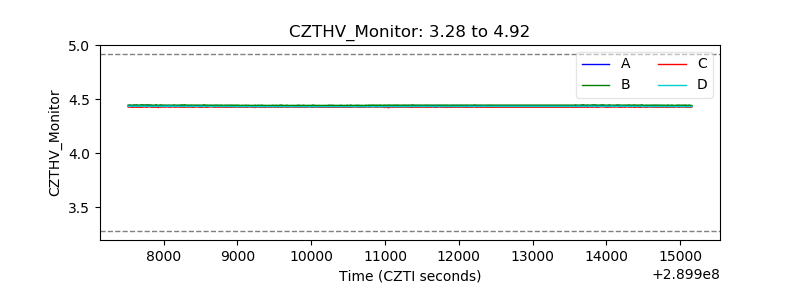 |
| D_VDD | 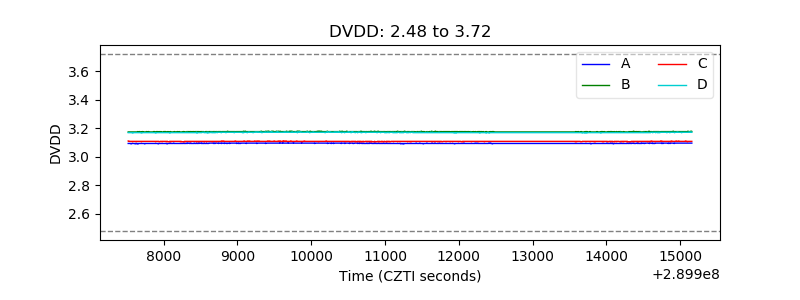 |
| Temperature 1 | 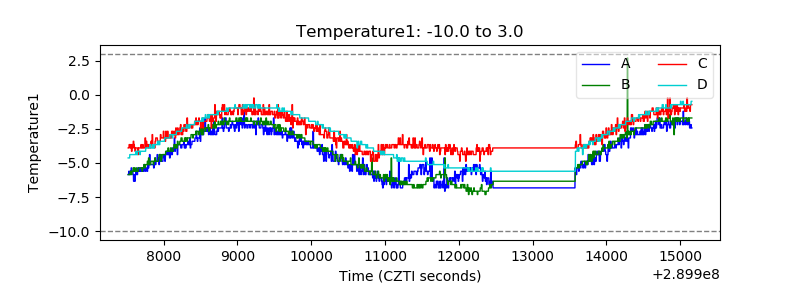 |
| Veto HV Monitor |  |
| Veto LLD | 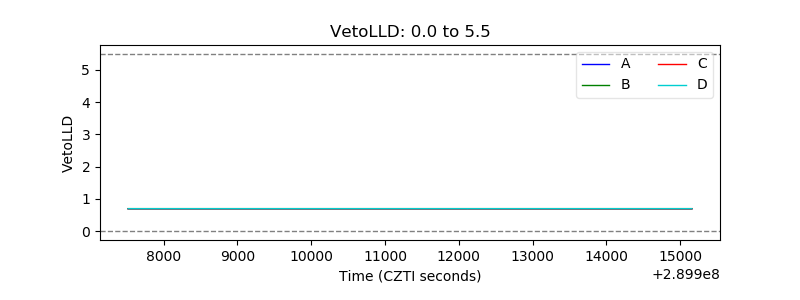 |
| Alpha Counter | 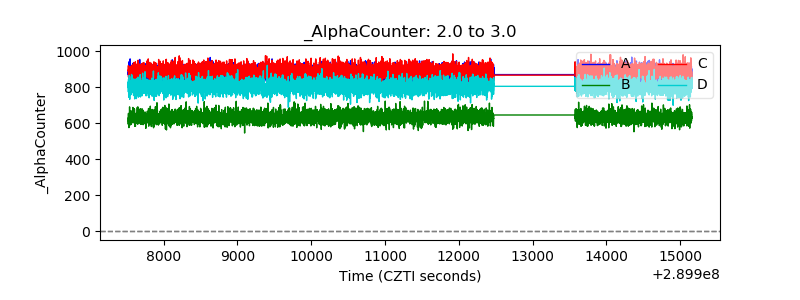 |
| _CPM_Rate | 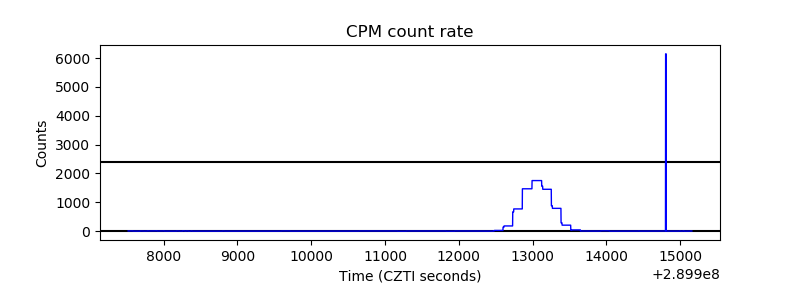 |
| CZT Counter | 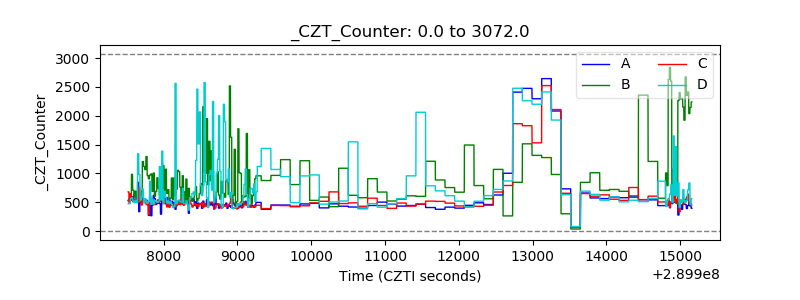 |
| +2.5 Volts monitor |  |
| +5 Volts monitor | 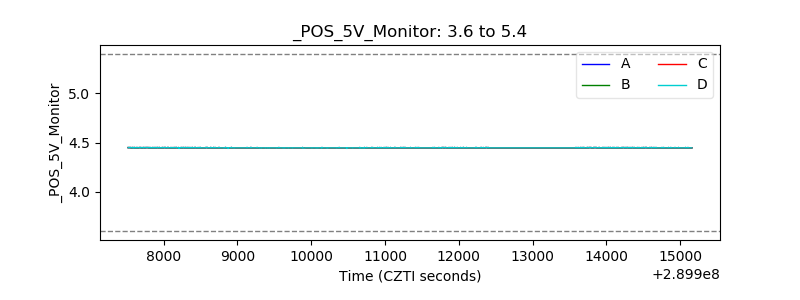 |
| _ROLL_ROT | 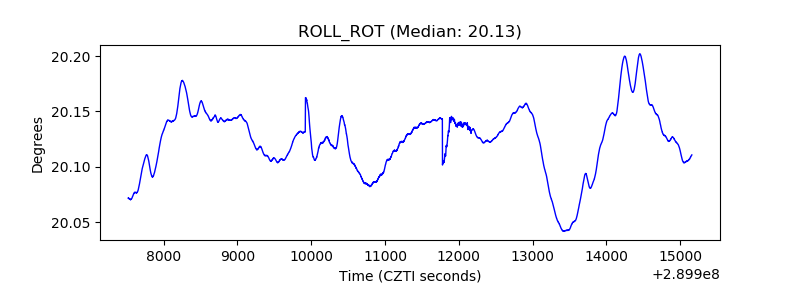 |
| _Roll_DEC | 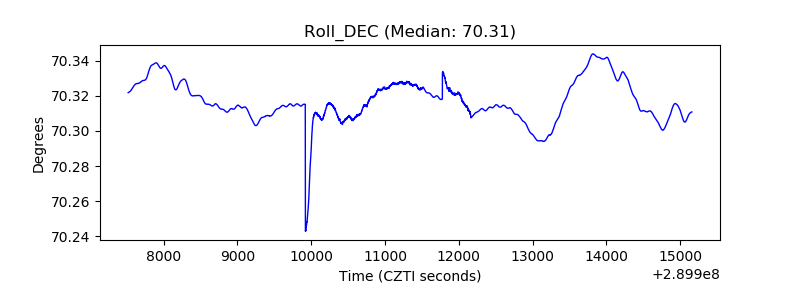 |
| _Roll_RA | 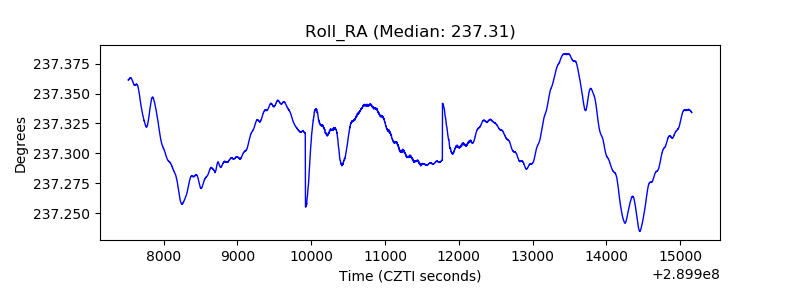 |
| Veto Counter | 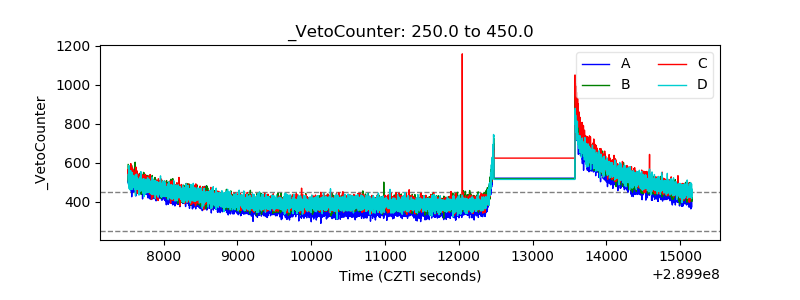 |