| Param | Original file | Final file |
|---|---|---|
| Filename | modeM0/AS1C04_001T01_9000002784_18641cztM0_level2.evt | modeM0/AS1C04_001T01_9000002784_18641cztM0_level2_quad_clean.evt |
| Size (bytes) | 376,073,280 | 69,511,680 |
| Size | 358.7 MB | 66.3 MB |
| Events in quadrant A | 1,888,170 | 477,761 |
| Events in quadrant B | 5,135,654 | 414,816 |
| Events in quadrant C | 1,997,391 | 463,812 |
| Events in quadrant D | 2,090,352 | 460,642 |
| Mode SS | |||
|---|---|---|---|
| Quadrant | BADHDUFLAG | Total packets | Discarded packets |
| A | 0 | 82 | 0 |
| B | 0 | 82 | 0 |
| C | 0 | 82 | 0 |
| D | 0 | 82 | 0 |
| Mode M0 | |||
|---|---|---|---|
| Quadrant | BADHDUFLAG | Total packets | Discarded packets |
| A | 0 | 8225 | 0 |
| B | 0 | 18023 | 0 |
| C | 0 | 8412 | 0 |
| D | 0 | 8946 | 0 |
| Quadrant | Total seconds | Saturated seconds | Saturation percentage |
|---|---|---|---|
| A | 4073 | 2 | 0.049104% |
| B | 4074 | 1219 | 29.921453% |
| C | 4074 | 21 | 0.515464% |
| D | 4074 | 28 | 0.687285% |
Noise dominated data is calculated using 1-second bins in cleaned event files. If a bin has >2000 counts, and if more than 50% of those come from <1% of pixels, then it is considered to be noise-dominated and hence unusable.
| Quadrant | # 1 sec bins | Bins with >0 counts | Bins with >2000 counts | High rate bins dominated by noise | Noise dominated (total time) | Noise dominated (detector-on time) | Marked lightcurve |
|---|---|---|---|---|---|---|---|
| A | 4073 | 4073 | 0 | 0 | 0.00% | 0.00% | 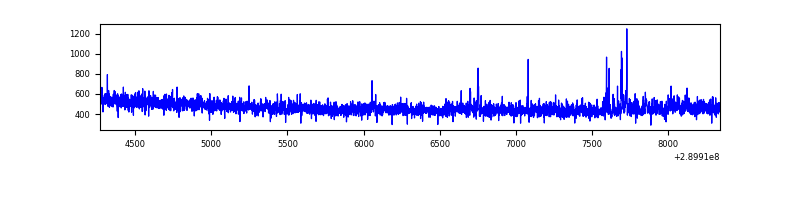 |
| B | 4074 | 4074 | 1011 | 1011 | 24.82% | 24.82% | 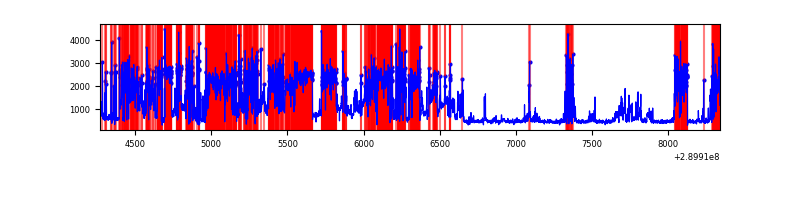 |
| C | 4074 | 4074 | 0 | 0 | 0.00% | 0.00% | 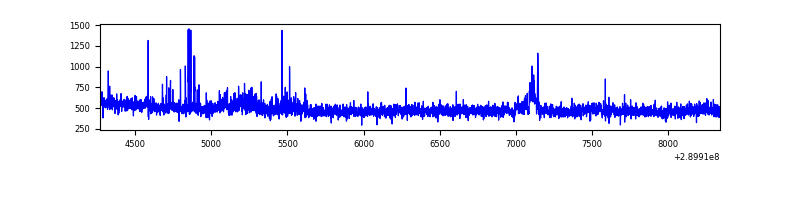 |
| D | 4074 | 4074 | 22 | 22 | 0.54% | 0.54% | 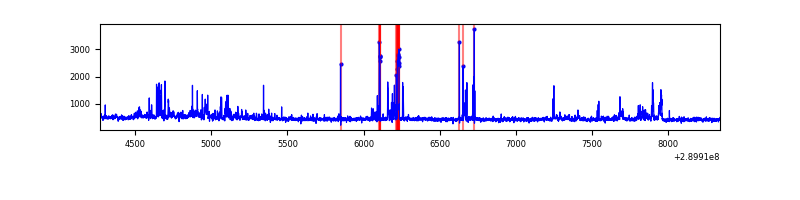 |
Top three noisy pixels from each quadrant. If the there are fewer than three noisy pixels in the level2.evt file, extra rows are filled as -1
| Pixel properties | Quadrant properties | ||||||
|---|---|---|---|---|---|---|---|
| Quadrant | DetID | PixID | Counts | Sigma | Mean | Median | Sigma |
| A | 0 | 13 | 30652 | 310.57 | 480 | 471 | 97.2 |
| A | 13 | 254 | 6235 | 59.31 | 480 | 471 | 97.2 |
| A | 0 | 226 | 4200 | 38.37 | 480 | 471 | 97.2 |
| B | 10 | 245 | 3285057 | 41123.7 | 420 | 409 | 79.9 |
| B | 12 | 18 | 70110 | 872.65 | 420 | 409 | 79.9 |
| B | 7 | 220 | 40008 | 495.78 | 420 | 409 | 79.9 |
| C | 3 | 233 | 99168 | 910.01 | 466 | 469 | 108.5 |
| C | 14 | 238 | 74313 | 680.84 | 466 | 469 | 108.5 |
| C | 13 | 61 | 3413 | 27.14 | 466 | 469 | 108.5 |
| D | 7 | 238 | 165013 | 1432.4 | 471 | 458 | 114.9 |
| D | 10 | 70 | 53442 | 461.21 | 471 | 458 | 114.9 |
| D | 13 | 172 | 28885 | 247.45 | 471 | 458 | 114.9 |
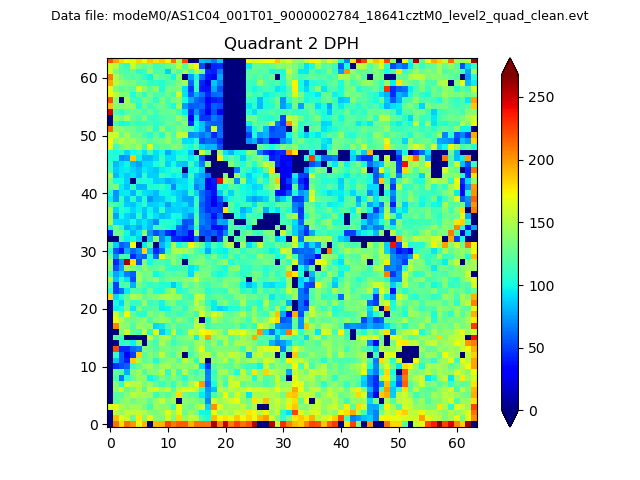
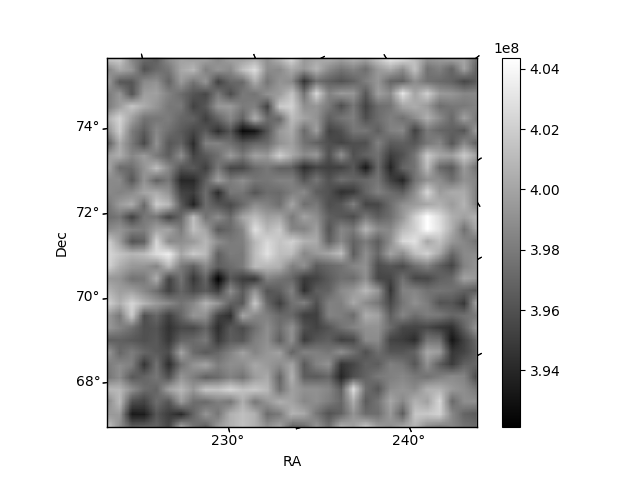
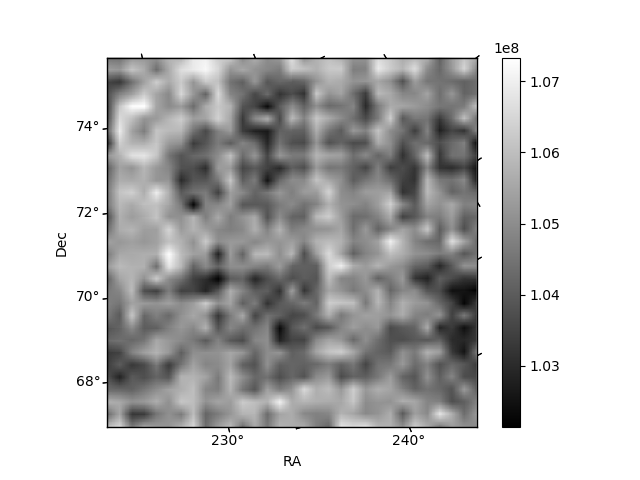
Histogram calculated using DETX and DETY for each event in the final _common_clean file
| Quadrant A | 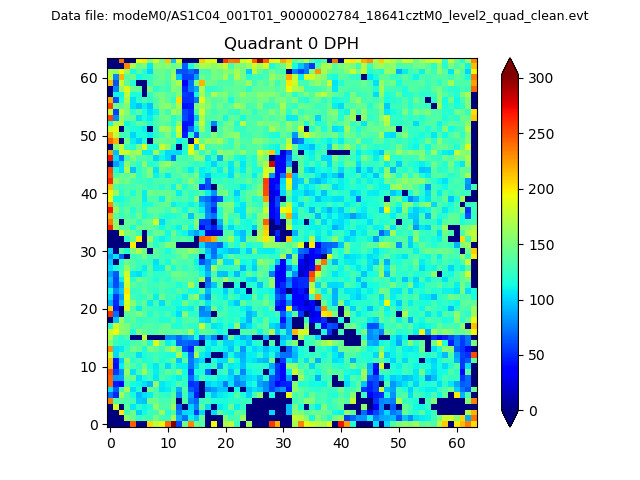 |
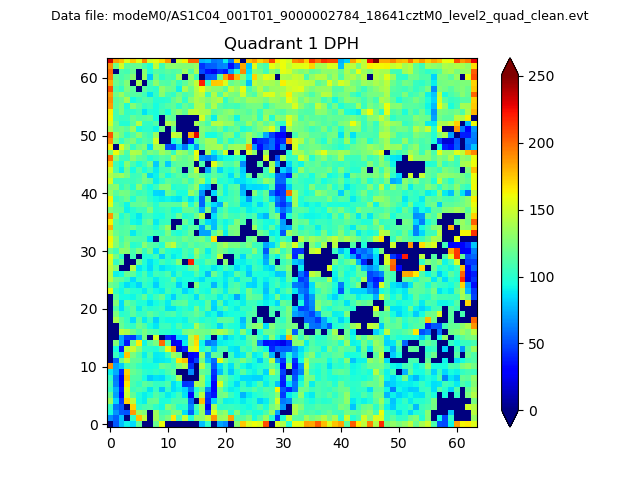 |
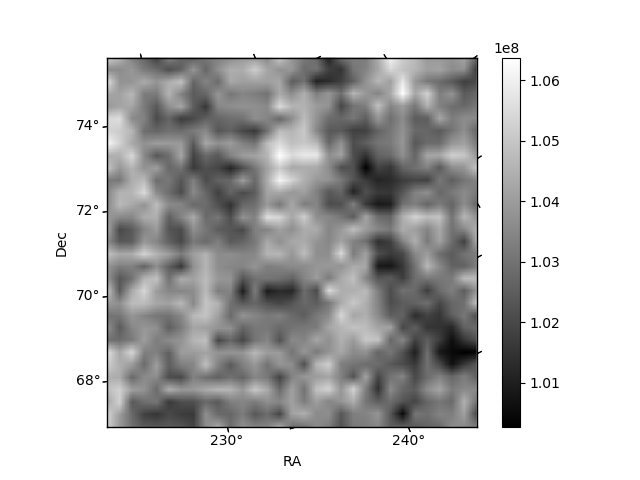
Quadrant B |
|---|---|---|---|
| Quadrant D | 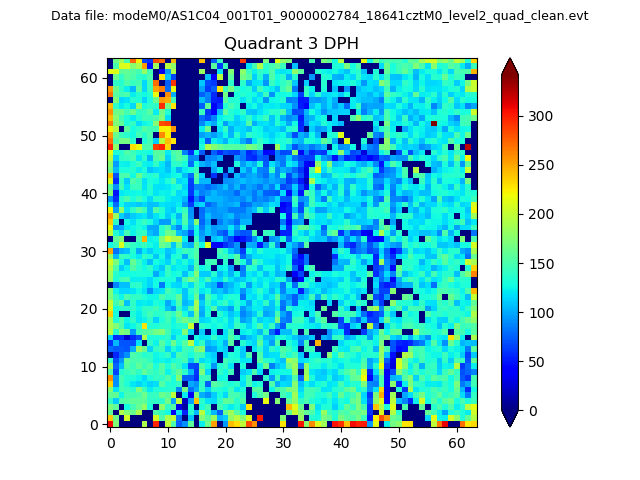 |
 |
Quadrant C |
| Plot type | Count rate plots | Images |
|---|---|---|
| Comparison with Poisson distribution Blue bars denote a histogram of data divided into 1 sec bins. Red curve is a Poisson curve with rate = median count rate of data. |
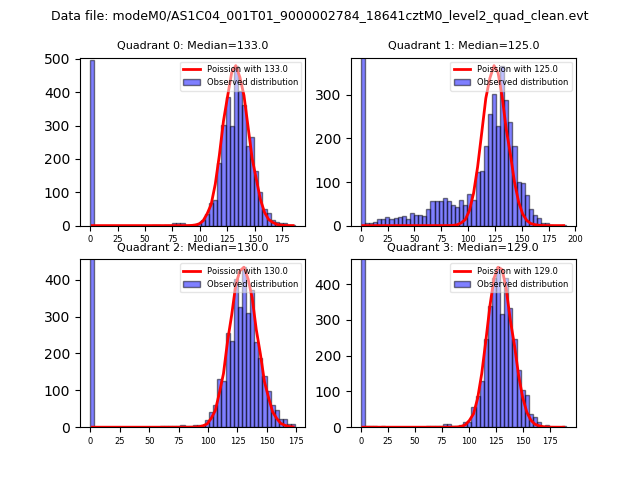 |
 |
| Quadrant-wise count rates Data is divided into 100 sec bins |
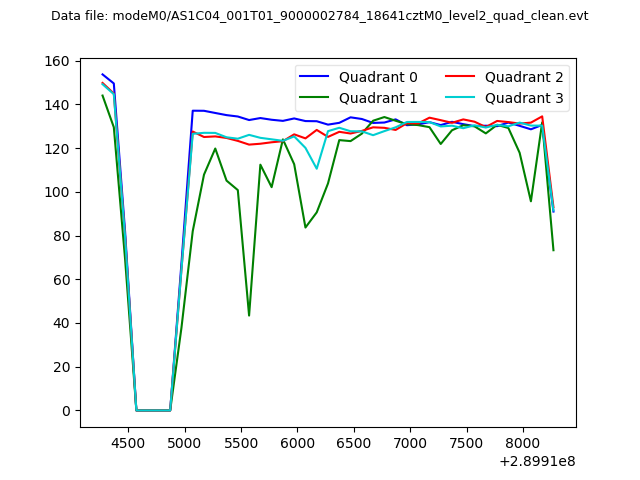 |
|
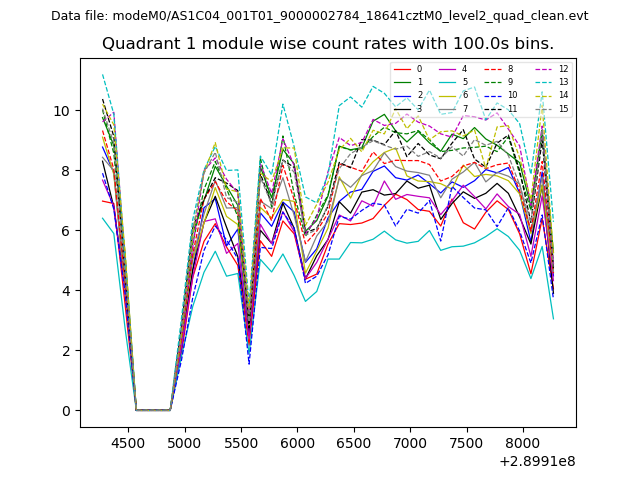
| Module-wise count rates for Quadrant A Data is divided into 100 sec bins |
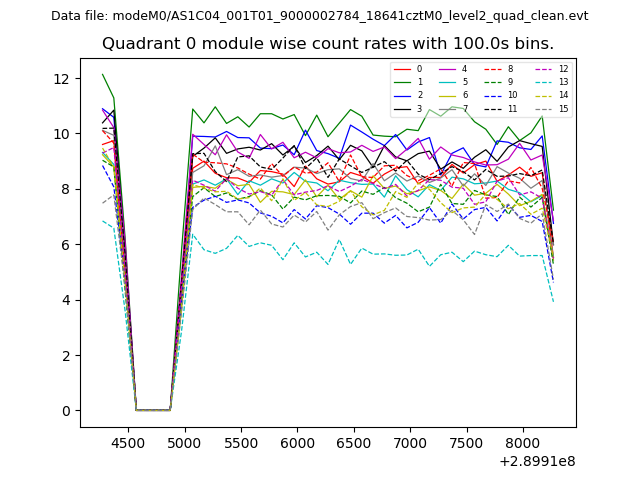 |
 |
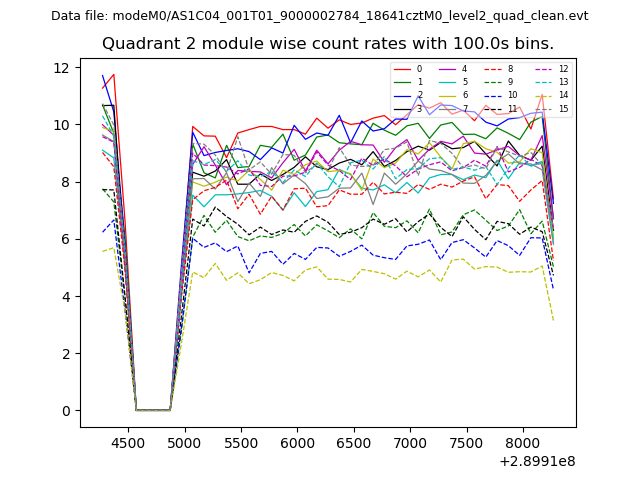
| Module-wise count rates for Quadrant B Data is divided into 100 sec bins |
 |
 |
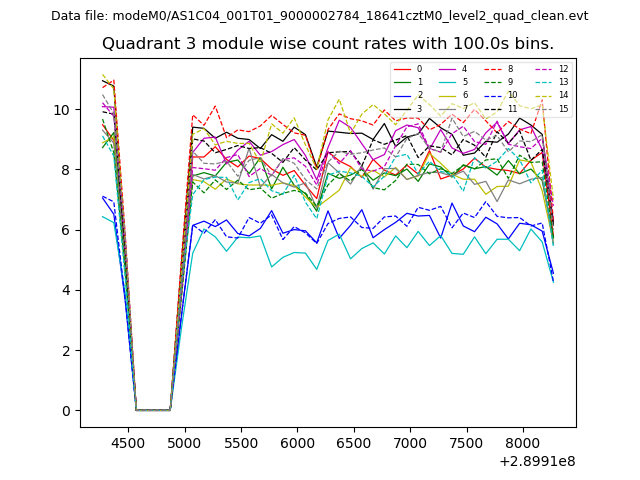
| Module-wise count rates for Quadrant C Data is divided into 100 sec bins |
 |
 |
| Module-wise count rates for Quadrant D Data is divided into 100 sec bins |
 |
 |
| Parameter | Plot |
|---|---|
| CZT HV Monitor | 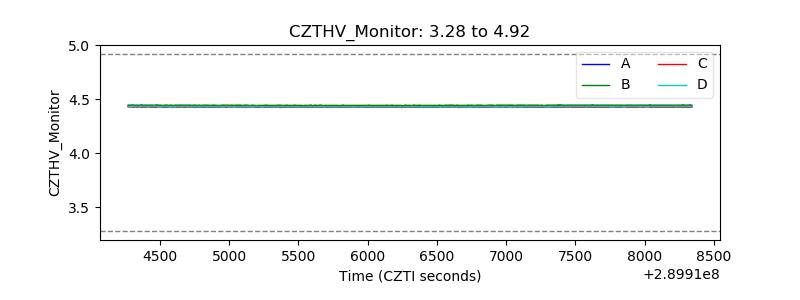 |
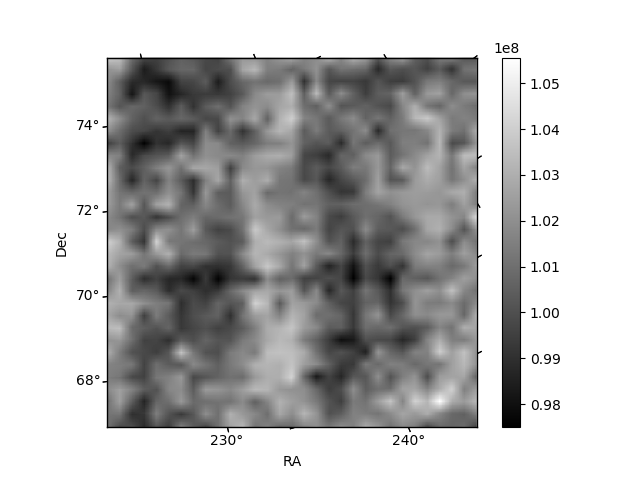
| D_VDD | 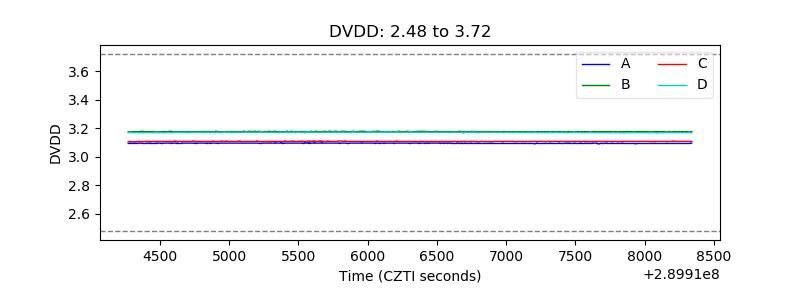 |
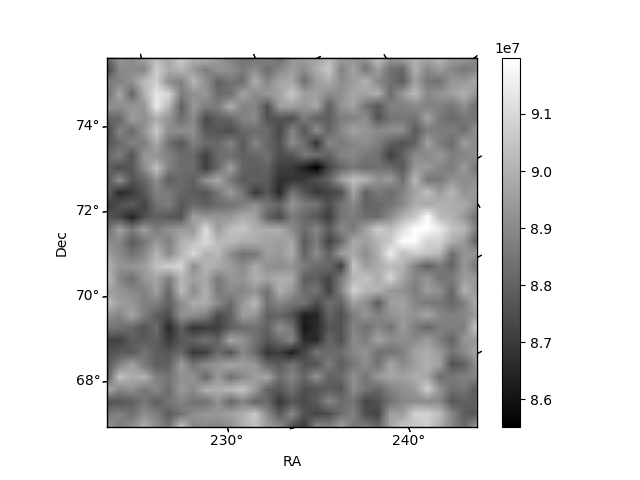
| Temperature 1 | 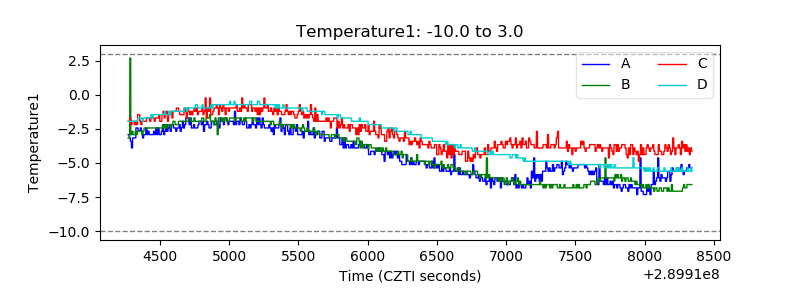 |
| Veto HV Monitor | 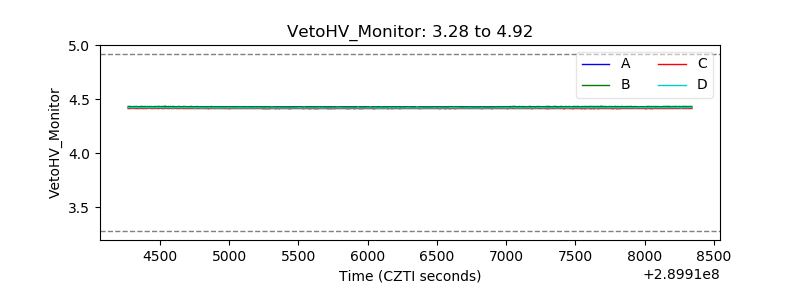 |
| Veto LLD | 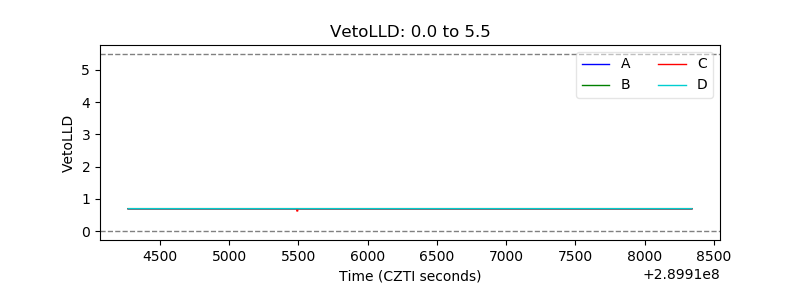 |
| Alpha Counter | 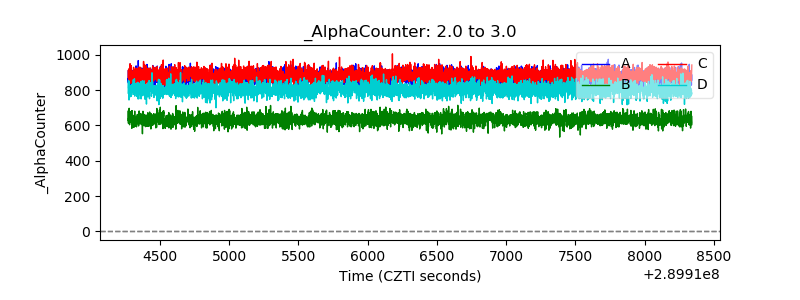 |
| _CPM_Rate | 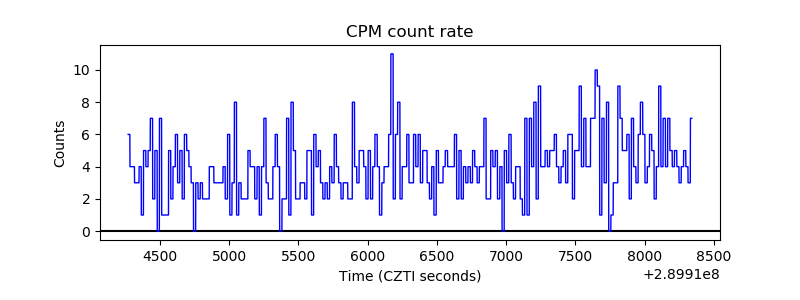 |
| CZT Counter | 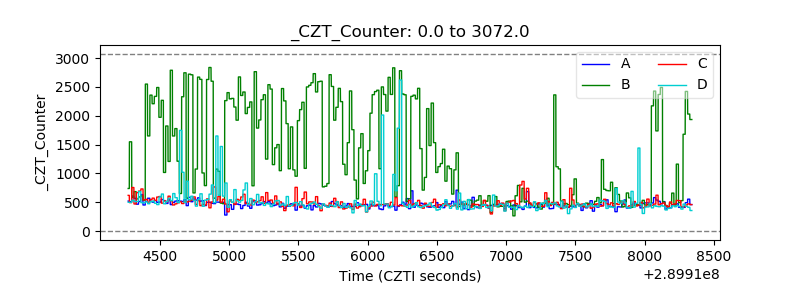 |
| +2.5 Volts monitor | 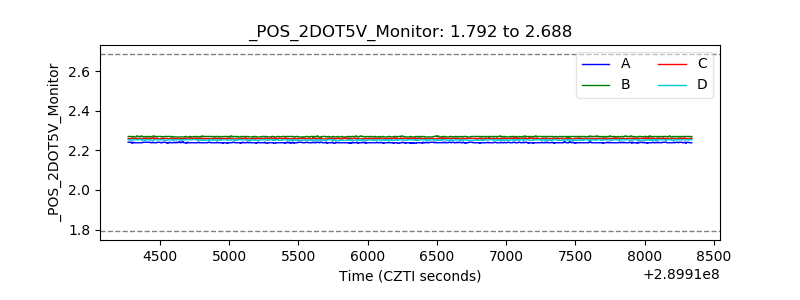 |
| +5 Volts monitor | 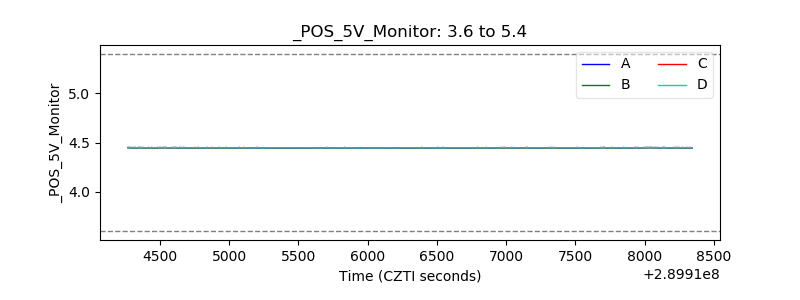 |
| _ROLL_ROT | 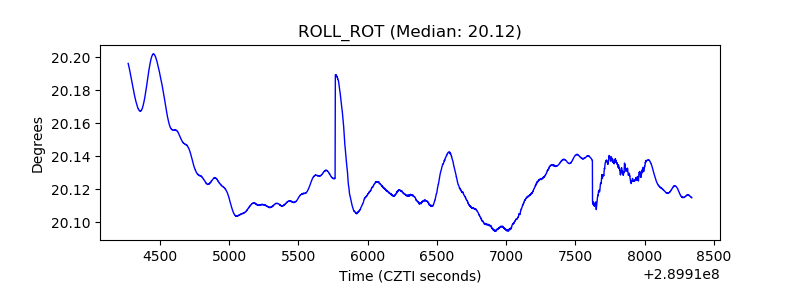 |
| _Roll_DEC | 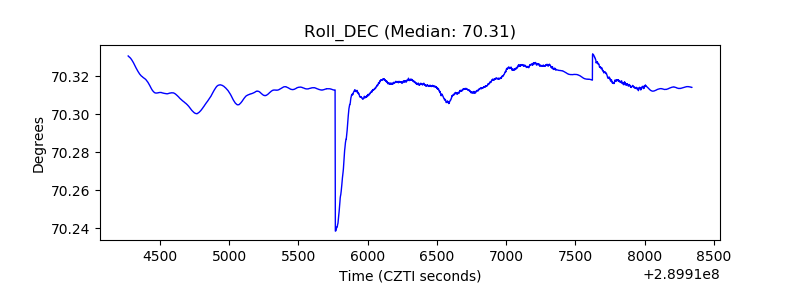 |
| _Roll_RA | 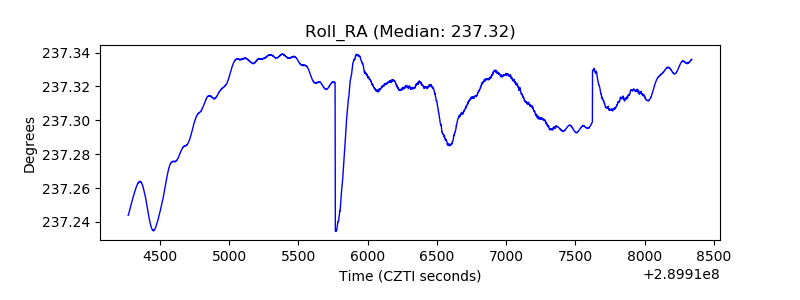 |
| Veto Counter | 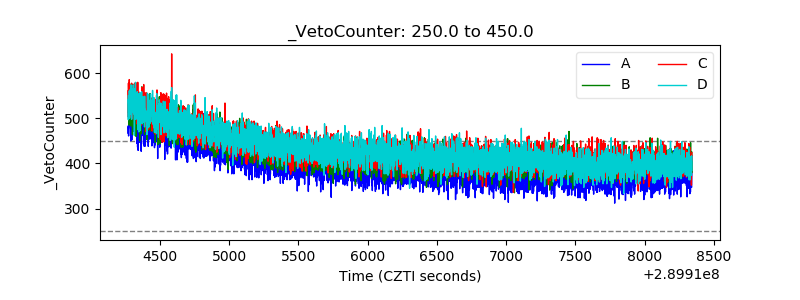 |