| Param | Original file | Final file |
|---|---|---|
| Filename | modeM0/AS1A06_003T01_9000002786_18643cztM0_level2.evt | modeM0/AS1A06_003T01_9000002786_18643cztM0_level2_quad_clean.evt |
| Size (bytes) | 465,972,480 | 79,669,440 |
| Size | 444.4 MB | 76.0 MB |
| Events in quadrant A | 3,341,984 | 500,295 |
| Events in quadrant B | 3,248,785 | 512,147 |
| Events in quadrant C | 3,164,725 | 503,422 |
| Events in quadrant D | 3,959,609 | 487,889 |
| Mode SS | |||
|---|---|---|---|
| Quadrant | BADHDUFLAG | Total packets | Discarded packets |
| A | 0 | 118 | 0 |
| B | 0 | 118 | 0 |
| C | 0 | 118 | 0 |
| D | 0 | 118 | 0 |
| Mode M0 | |||
|---|---|---|---|
| Quadrant | BADHDUFLAG | Total packets | Discarded packets |
| A | 0 | 13793 | 1 |
| B | 0 | 13349 | 1 |
| C | 0 | 13096 | 1 |
| D | 0 | 15691 | 3 |
| Mode M9 | |||
|---|---|---|---|
| Quadrant | BADHDUFLAG | Total packets | Discarded packets |
| A | 0 | 13 | 0 |
| B | 0 | 13 | 0 |
| C | 0 | 13 | 0 |
| D | 0 | 13 | 0 |
| Quadrant | Total seconds | Saturated seconds | Saturation percentage |
|---|---|---|---|
| A | 5844 | 97 | 1.659822% |
| B | 5845 | 103 | 1.762190% |
| C | 5845 | 102 | 1.745081% |
| D | 5844 | 293 | 5.013689% |
Noise dominated data is calculated using 1-second bins in cleaned event files. If a bin has >2000 counts, and if more than 50% of those come from <1% of pixels, then it is considered to be noise-dominated and hence unusable.
| Quadrant | # 1 sec bins | Bins with >0 counts | Bins with >2000 counts | High rate bins dominated by noise | Noise dominated (total time) | Noise dominated (detector-on time) | Marked lightcurve |
|---|---|---|---|---|---|---|---|
| A | 7199 | 5844 | 16 | 16 | 0.22% | 0.27% | 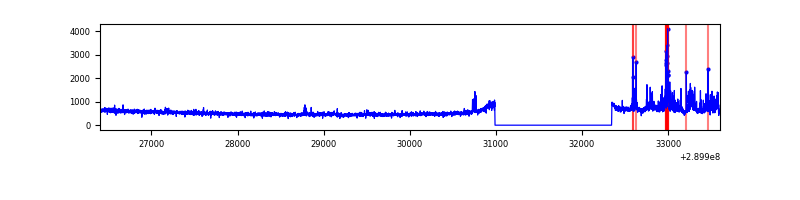 |
| B | 7200 | 5845 | 11 | 11 | 0.15% | 0.19% | 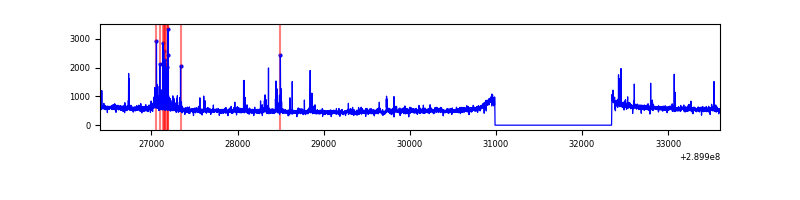 |
| C | 7200 | 5845 | 0 | 0 | 0.00% | 0.00% | 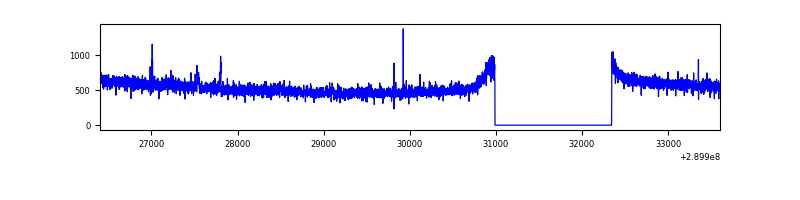 |
| D | 7199 | 5845 | 171 | 171 | 2.38% | 2.93% | 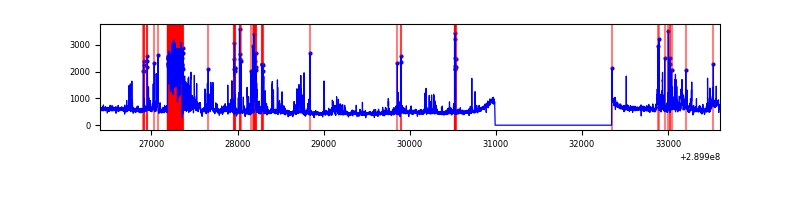 |
Top three noisy pixels from each quadrant. If the there are fewer than three noisy pixels in the level2.evt file, extra rows are filled as -1
| Pixel properties | Quadrant properties | ||||||
|---|---|---|---|---|---|---|---|
| Quadrant | DetID | PixID | Counts | Sigma | Mean | Median | Sigma |
| A | 0 | 13 | 302356 | 1951.49 | 783 | 768 | 154.5 |
| A | 6 | 16 | 11253 | 67.85 | 783 | 768 | 154.5 |
| A | 13 | 254 | 8479 | 49.9 | 783 | 768 | 154.5 |
| B | 7 | 220 | 64721 | 436.39 | 783 | 764 | 146.6 |
| B | 0 | 197 | 37131 | 248.14 | 783 | 764 | 146.6 |
| B | 0 | 198 | 31729 | 211.28 | 783 | 764 | 146.6 |
| C | 14 | 238 | 120333 | 674.55 | 770 | 778 | 177.2 |
| C | 3 | 233 | 36201 | 199.86 | 770 | 778 | 177.2 |
| C | 13 | 61 | 5372 | 25.92 | 770 | 778 | 177.2 |
| D | 1 | 52 | 760214 | 4116.76 | 769 | 750 | 184.5 |
| D | 7 | 238 | 205118 | 1107.8 | 769 | 750 | 184.5 |
| D | 2 | 234 | 24524 | 128.87 | 769 | 750 | 184.5 |
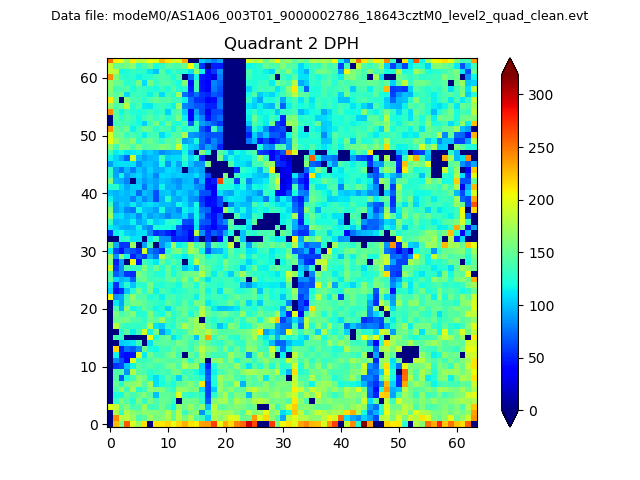
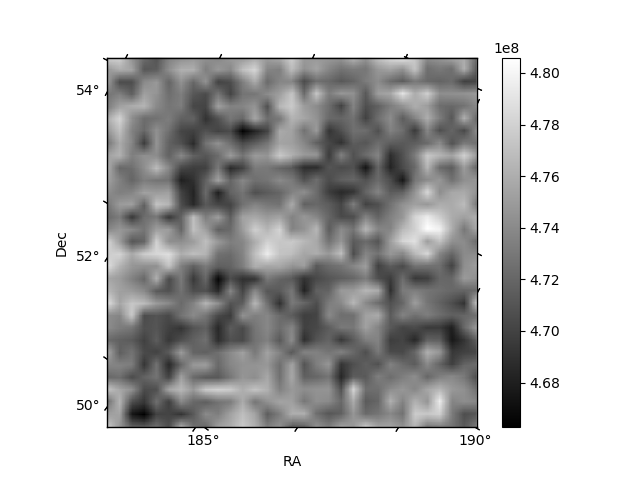
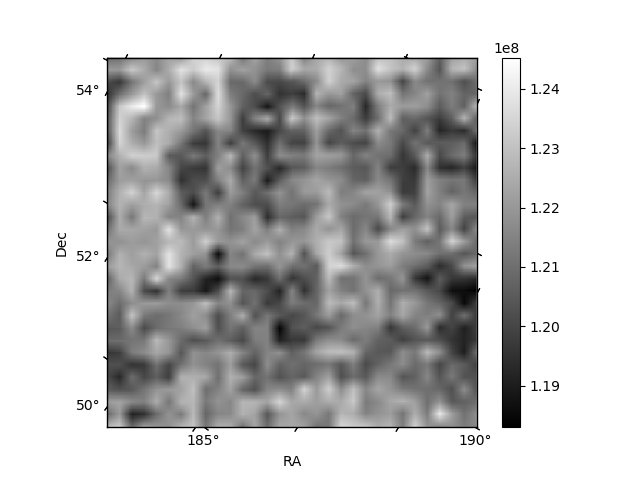
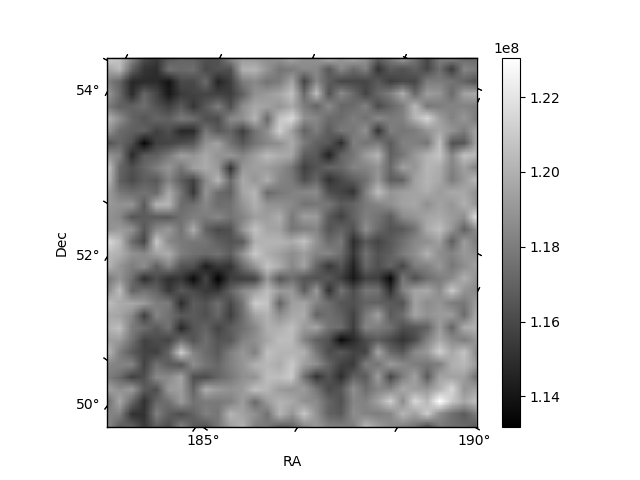
Histogram calculated using DETX and DETY for each event in the final _common_clean file
| Quadrant A | 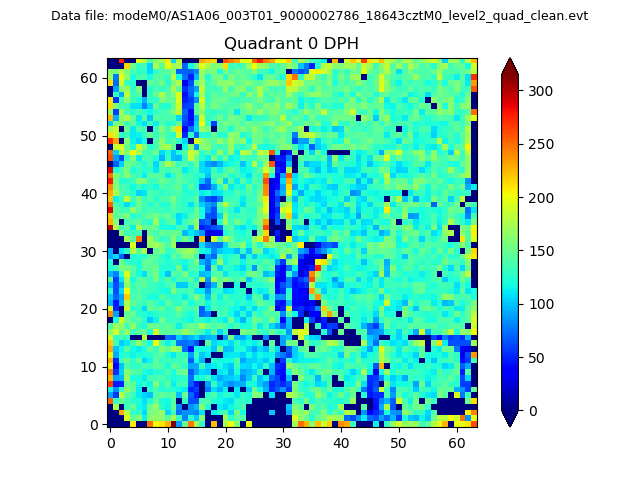 |
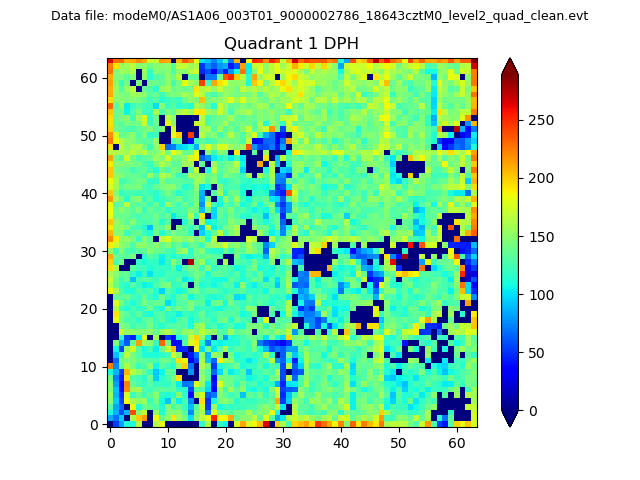 |
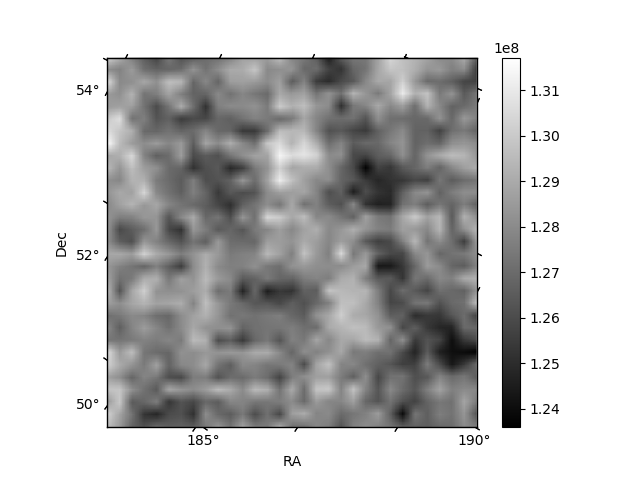
Quadrant B |
|---|---|---|---|
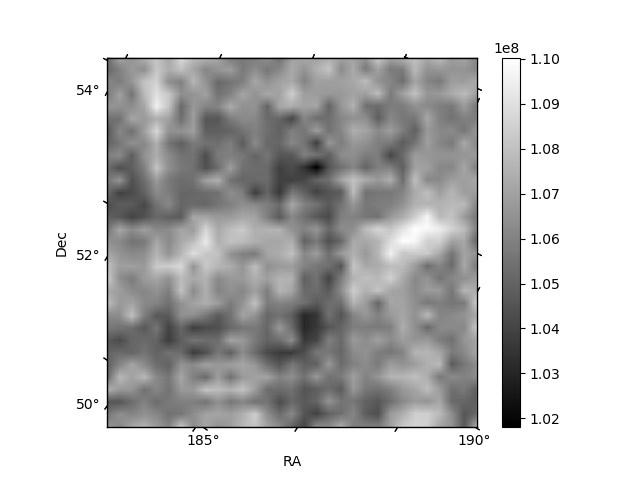
| Quadrant D | 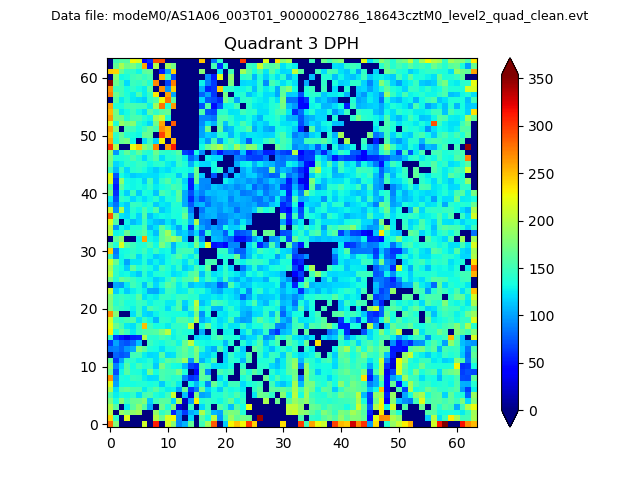 |
 |
Quadrant C |
| Plot type | Count rate plots | Images |
|---|---|---|
| Comparison with Poisson distribution Blue bars denote a histogram of data divided into 1 sec bins. Red curve is a Poisson curve with rate = median count rate of data. |
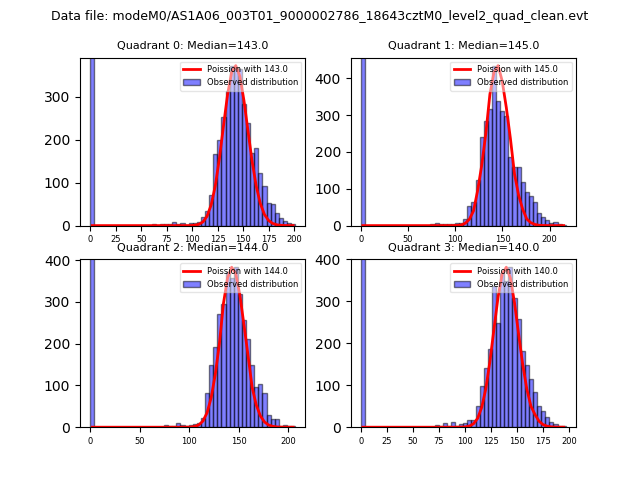 |
 |
| Quadrant-wise count rates Data is divided into 100 sec bins |
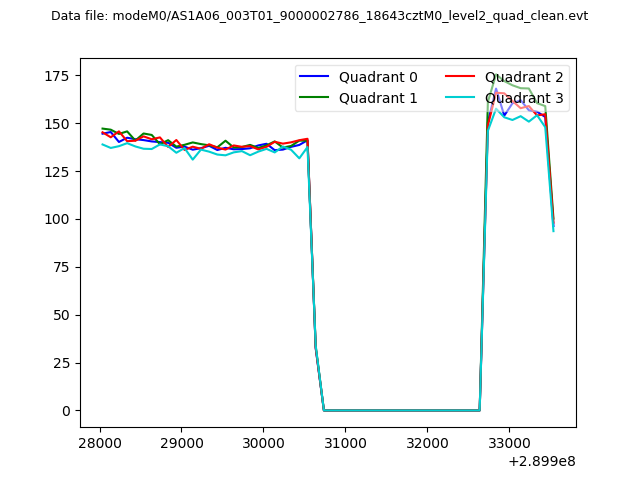 |
|
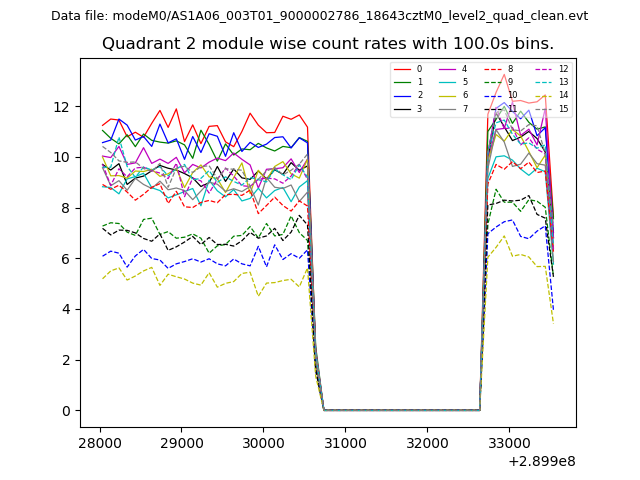
| Module-wise count rates for Quadrant A Data is divided into 100 sec bins |
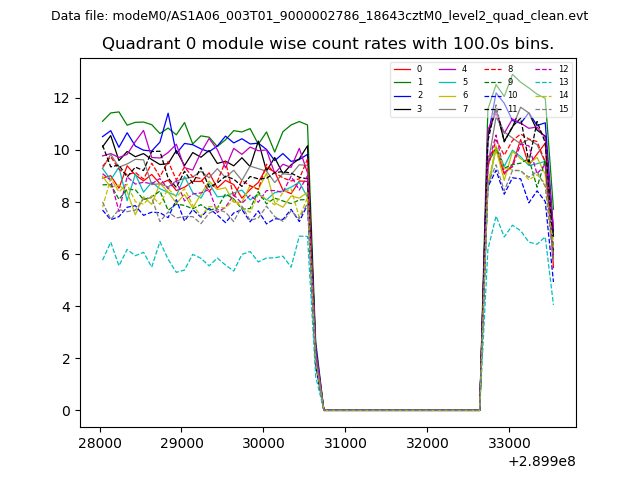 |
 |
| Module-wise count rates for Quadrant B Data is divided into 100 sec bins |
 |
 |
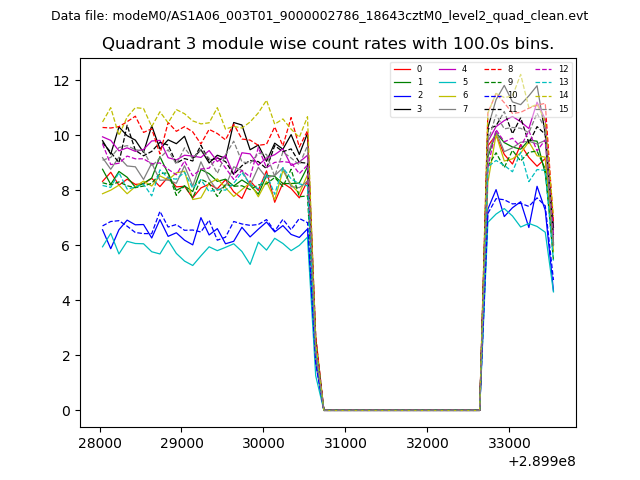
| Module-wise count rates for Quadrant C Data is divided into 100 sec bins |
 |
 |
| Module-wise count rates for Quadrant D Data is divided into 100 sec bins |
 |
 |
| Parameter | Plot |
|---|---|
| CZT HV Monitor | 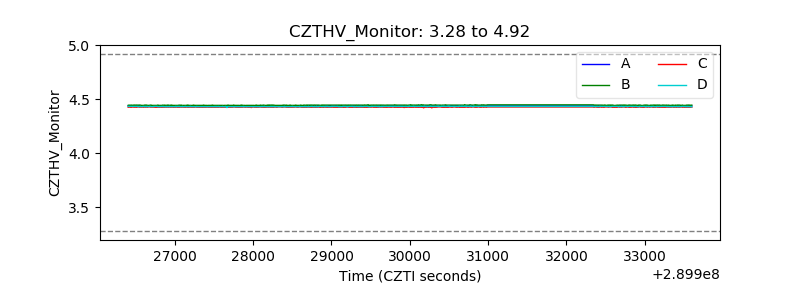 |
| D_VDD | 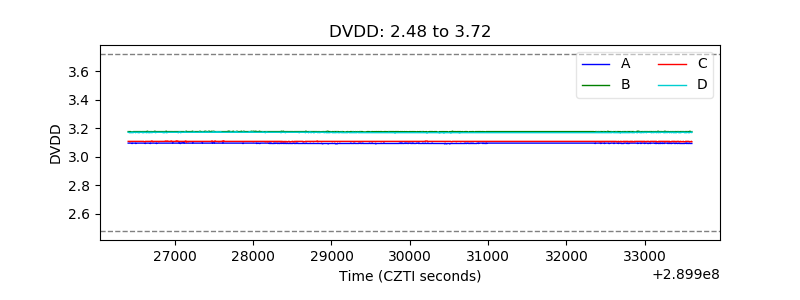 |
| Temperature 1 | 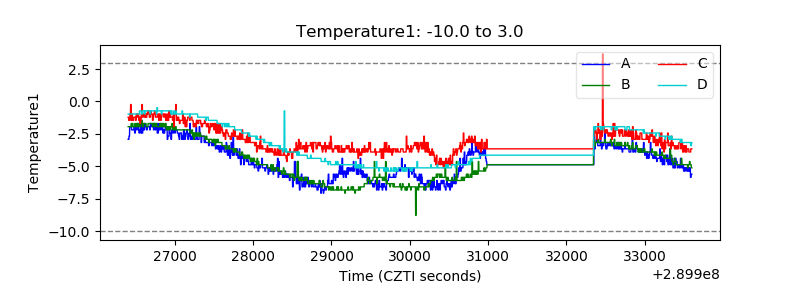 |
| Veto HV Monitor | 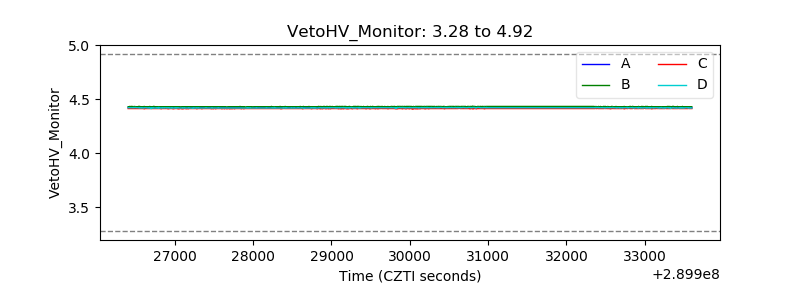 |
| Veto LLD | 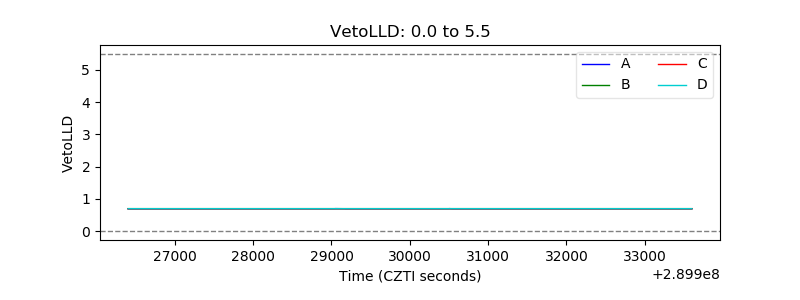 |
| Alpha Counter | 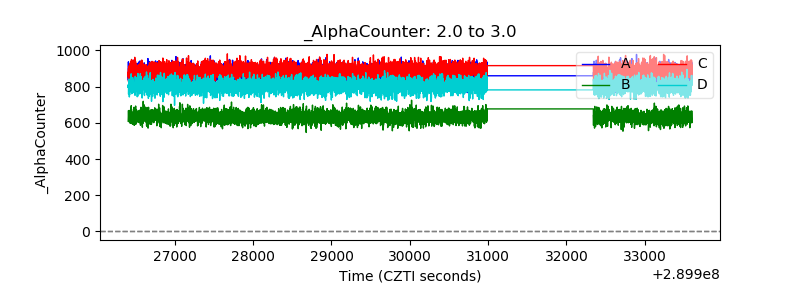 |
| _CPM_Rate | 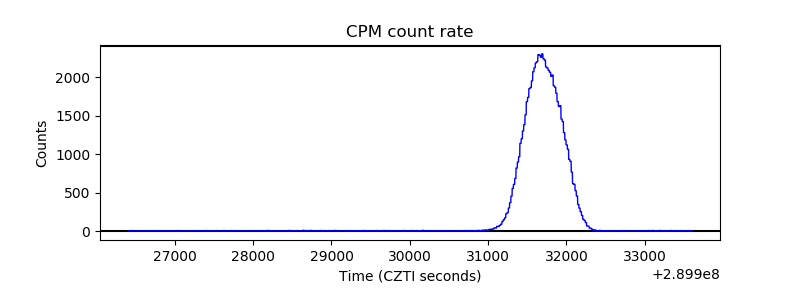 |
| CZT Counter | 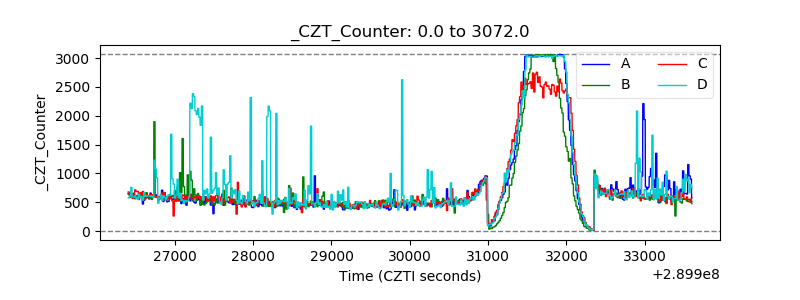 |
| +2.5 Volts monitor |  |
| +5 Volts monitor |  |
| _ROLL_ROT | 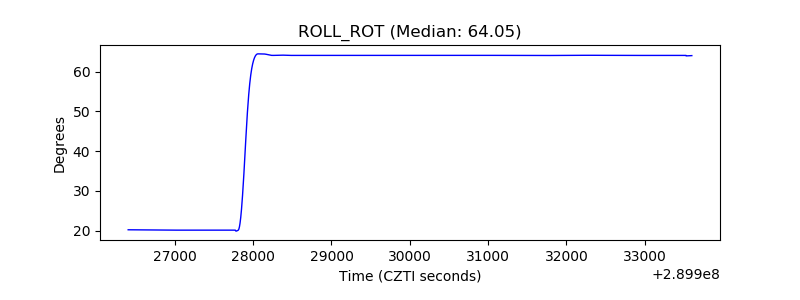 |
| _Roll_DEC | 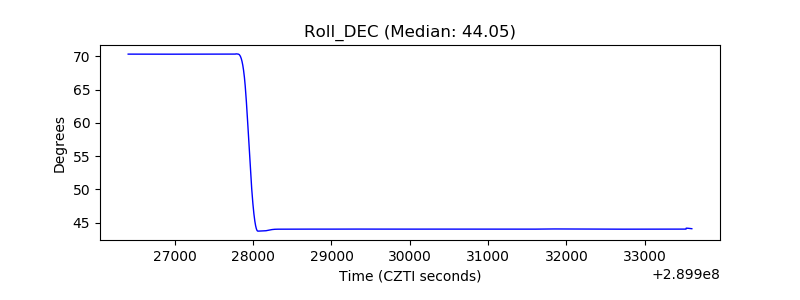 |
| _Roll_RA | 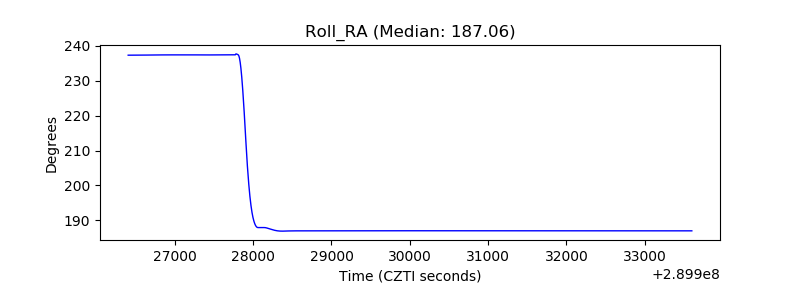 |
| Veto Counter |  |