| Param | Original file | Final file |
|---|---|---|
| Filename | modeM0/AS1A06_003T01_9000002786_18645cztM0_level2.evt | modeM0/AS1A06_003T01_9000002786_18645cztM0_level2_quad_clean.evt |
| Size (bytes) | 584,000,640 | 105,494,400 |
| Size | 556.9 MB | 100.6 MB |
| Events in quadrant A | 5,564,639 | 662,255 |
| Events in quadrant B | 3,612,149 | 702,963 |
| Events in quadrant C | 3,821,751 | 684,263 |
| Events in quadrant D | 4,217,765 | 661,970 |
| Mode SS | |||
|---|---|---|---|
| Quadrant | BADHDUFLAG | Total packets | Discarded packets |
| A | 0 | 142 | 0 |
| B | 0 | 142 | 0 |
| C | 0 | 142 | 0 |
| D | 0 | 142 | 0 |
| Mode M0 | |||
|---|---|---|---|
| Quadrant | BADHDUFLAG | Total packets | Discarded packets |
| A | 0 | 21270 | 2 |
| B | 0 | 15233 | 2 |
| C | 0 | 15609 | 2 |
| D | 0 | 17192 | 2 |
| Mode M9 | |||
|---|---|---|---|
| Quadrant | BADHDUFLAG | Total packets | Discarded packets |
| A | 0 | 24 | 0 |
| B | 0 | 24 | 0 |
| C | 0 | 24 | 0 |
| D | 0 | 24 | 0 |
| Quadrant | Total seconds | Saturated seconds | Saturation percentage |
|---|---|---|---|
| A | 6942 | 527 | 7.591472% |
| B | 6942 | 160 | 2.304811% |
| C | 6942 | 195 | 2.808989% |
| D | 6943 | 153 | 2.203658% |
Noise dominated data is calculated using 1-second bins in cleaned event files. If a bin has >2000 counts, and if more than 50% of those come from <1% of pixels, then it is considered to be noise-dominated and hence unusable.
| Quadrant | # 1 sec bins | Bins with >0 counts | Bins with >2000 counts | High rate bins dominated by noise | Noise dominated (total time) | Noise dominated (detector-on time) | Marked lightcurve |
|---|---|---|---|---|---|---|---|
| A | 9387 | 6944 | 320 | 320 | 3.41% | 4.61% | 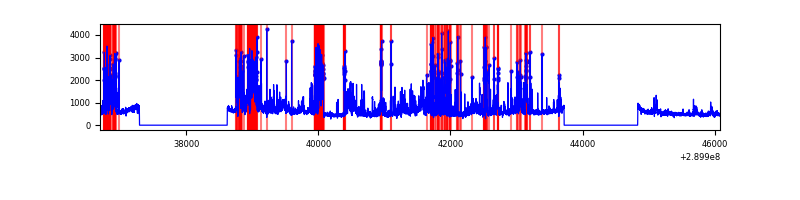 |
| B | 9387 | 6944 | 2 | 2 | 0.02% | 0.03% | 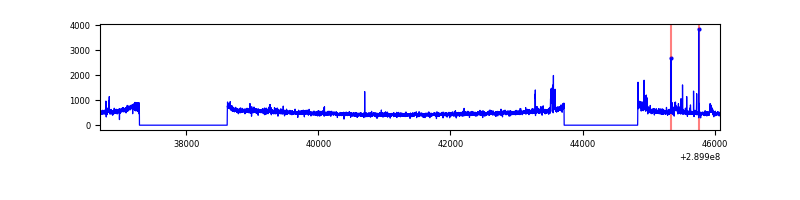 |
| C | 9387 | 6944 | 36 | 36 | 0.38% | 0.52% | 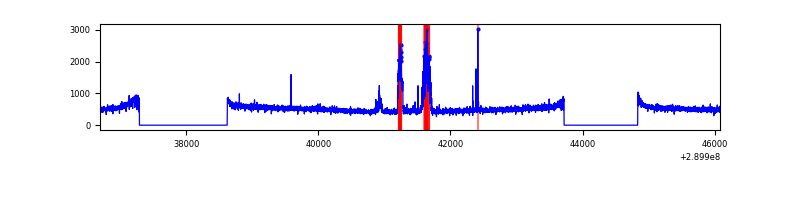 |
| D | 9388 | 6945 | 38 | 38 | 0.40% | 0.55% | 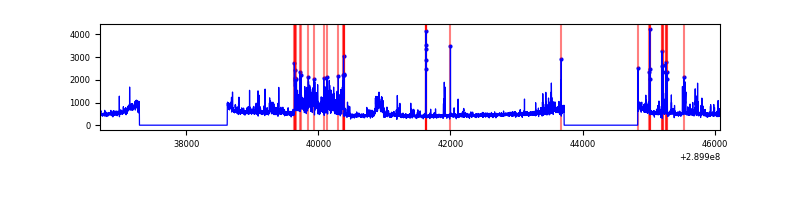 |
Top three noisy pixels from each quadrant. If the there are fewer than three noisy pixels in the level2.evt file, extra rows are filled as -1
| Pixel properties | Quadrant properties | ||||||
|---|---|---|---|---|---|---|---|
| Quadrant | DetID | PixID | Counts | Sigma | Mean | Median | Sigma |
| A | 0 | 13 | 2198201 | 12583.01 | 869 | 853 | 174.6 |
| A | 6 | 16 | 13292 | 71.23 | 869 | 853 | 174.6 |
| A | 13 | 254 | 8606 | 44.4 | 869 | 853 | 174.6 |
| B | 0 | 183 | 77838 | 458.32 | 888 | 865 | 167.9 |
| B | 0 | 230 | 38714 | 225.36 | 888 | 865 | 167.9 |
| B | 12 | 111 | 20214 | 115.21 | 888 | 865 | 167.9 |
| C | 9 | 54 | 288144 | 1434.03 | 867 | 873 | 200.3 |
| C | 14 | 238 | 132801 | 658.57 | 867 | 873 | 200.3 |
| C | 3 | 233 | 18630 | 88.64 | 867 | 873 | 200.3 |
| D | 1 | 52 | 759173 | 3615.89 | 874 | 847 | 209.7 |
| D | 7 | 238 | 93208 | 440.4 | 874 | 847 | 209.7 |
| D | 2 | 234 | 26597 | 122.78 | 874 | 847 | 209.7 |
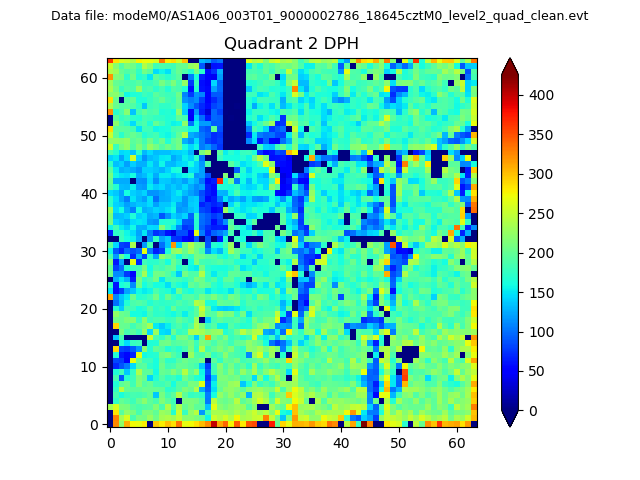
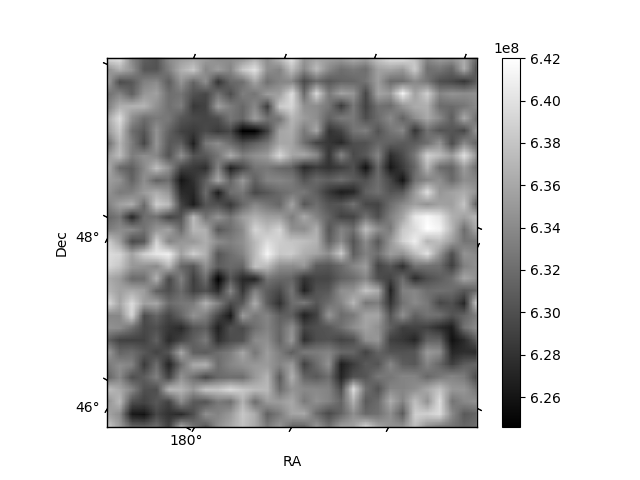
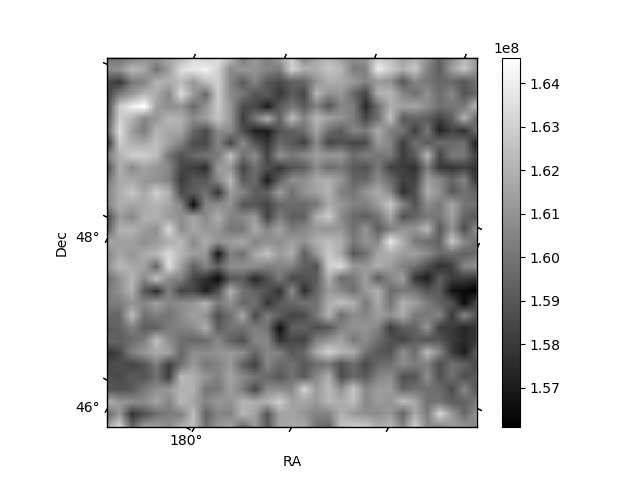
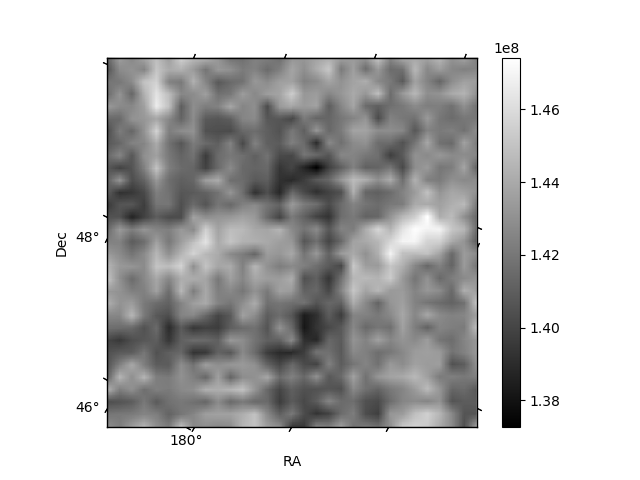
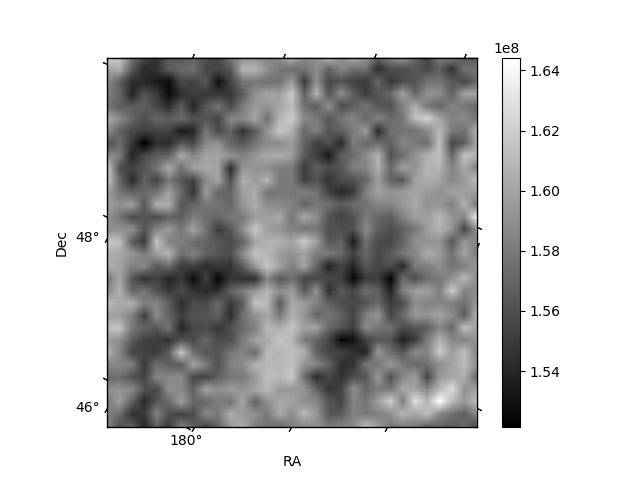
Histogram calculated using DETX and DETY for each event in the final _common_clean file
| Quadrant A | 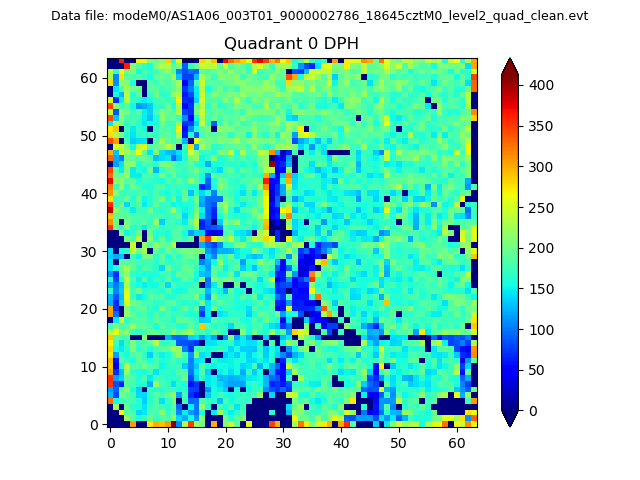 |
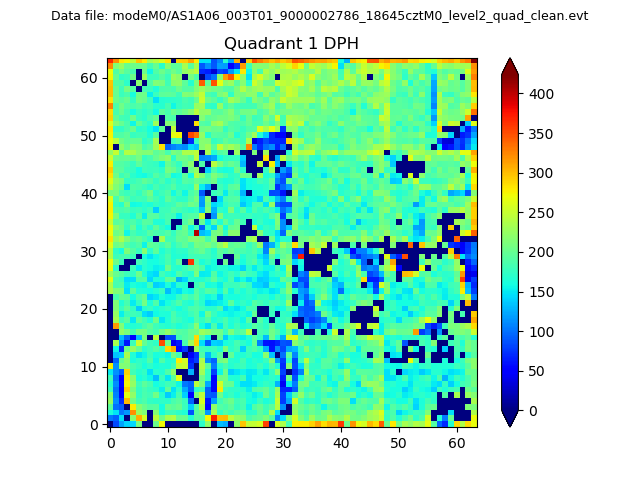 |
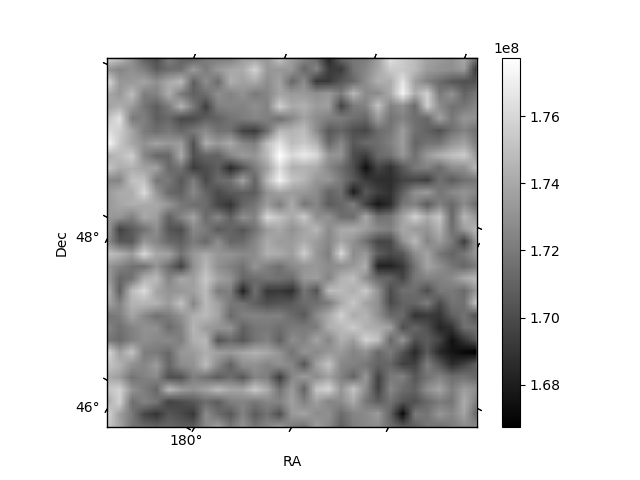
Quadrant B |
|---|---|---|---|
| Quadrant D | 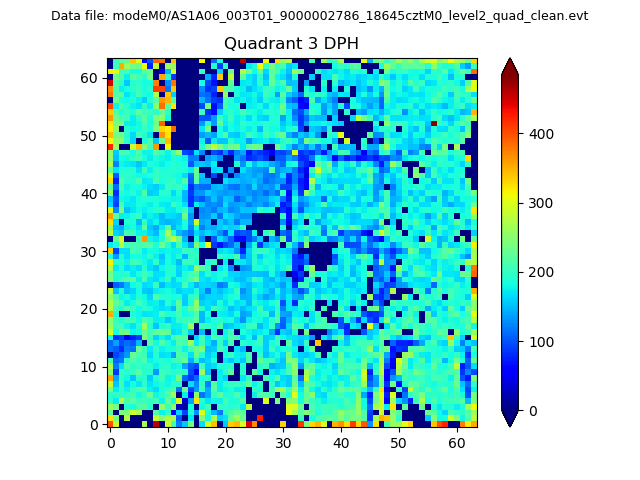 |
 |
Quadrant C |
| Plot type | Count rate plots | Images |
|---|---|---|
| Comparison with Poisson distribution Blue bars denote a histogram of data divided into 1 sec bins. Red curve is a Poisson curve with rate = median count rate of data. |
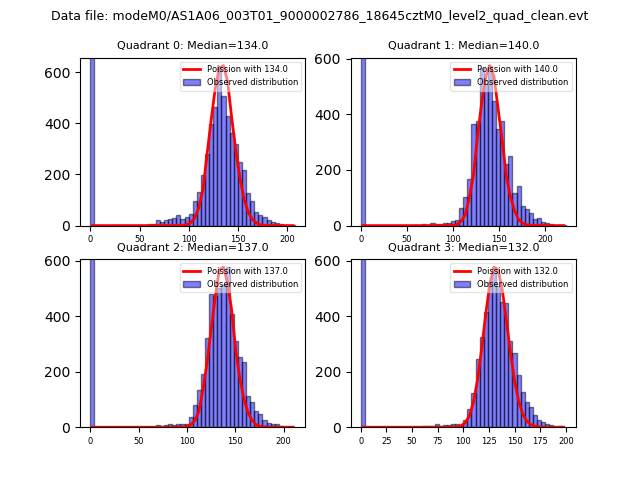 |
 |
| Quadrant-wise count rates Data is divided into 100 sec bins |
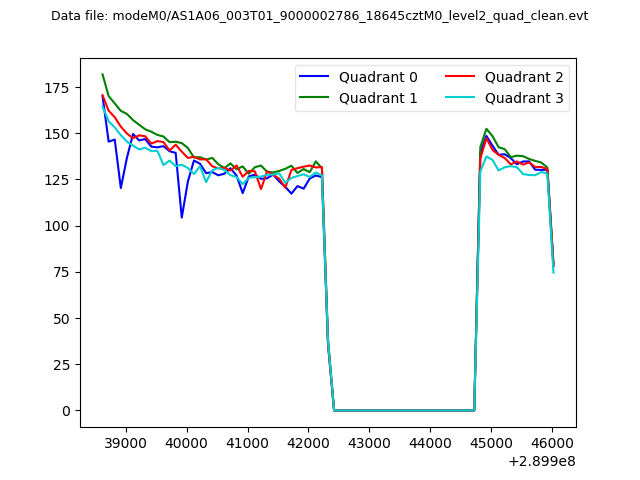 |
|
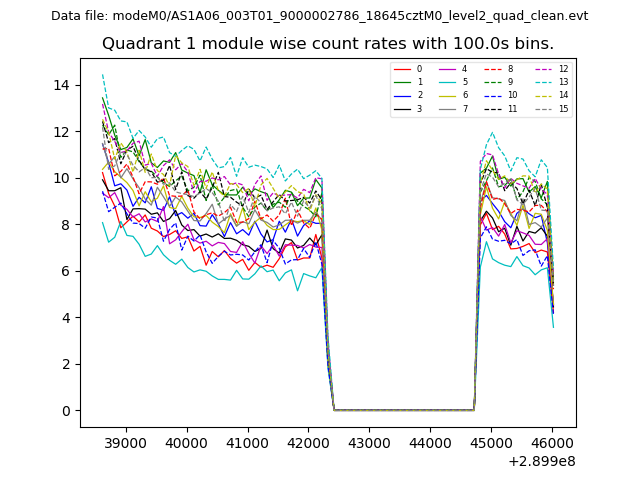
| Module-wise count rates for Quadrant A Data is divided into 100 sec bins |
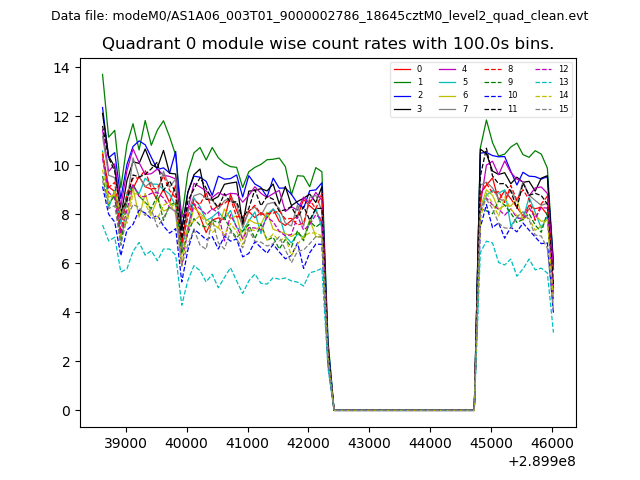 |
 |
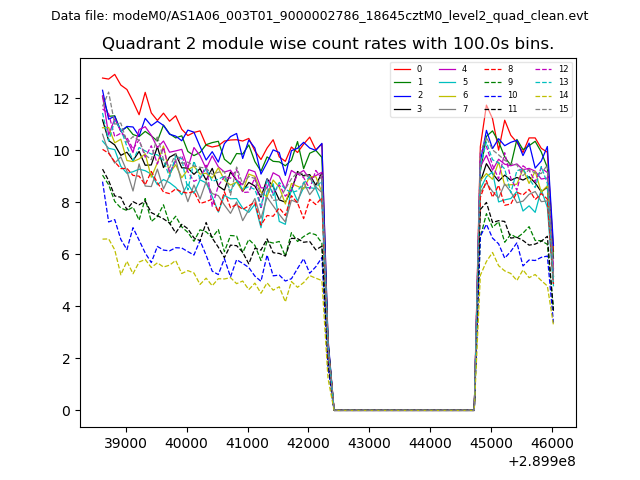
| Module-wise count rates for Quadrant B Data is divided into 100 sec bins |
 |
 |
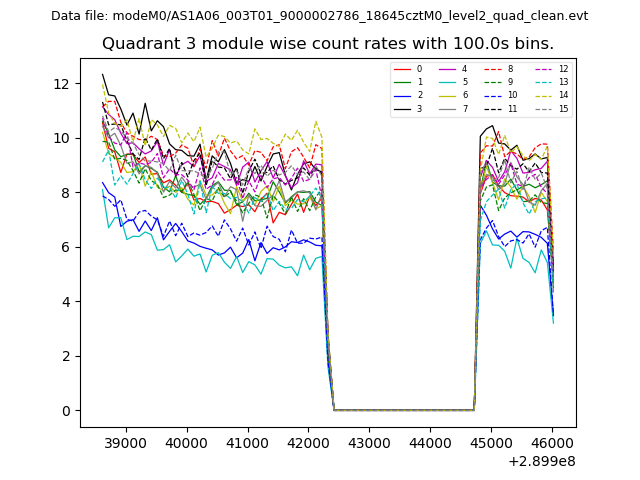
| Module-wise count rates for Quadrant C Data is divided into 100 sec bins |
 |
 |
| Module-wise count rates for Quadrant D Data is divided into 100 sec bins |
 |
 |
| Parameter | Plot |
|---|---|
| CZT HV Monitor | 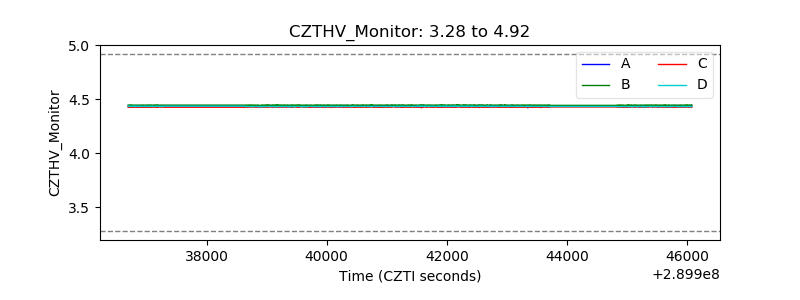 |
| D_VDD | 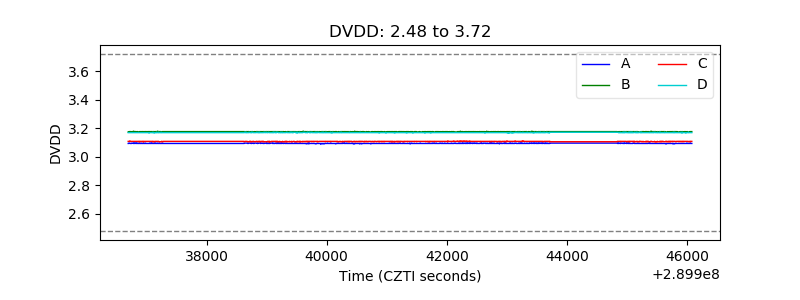 |
| Temperature 1 | 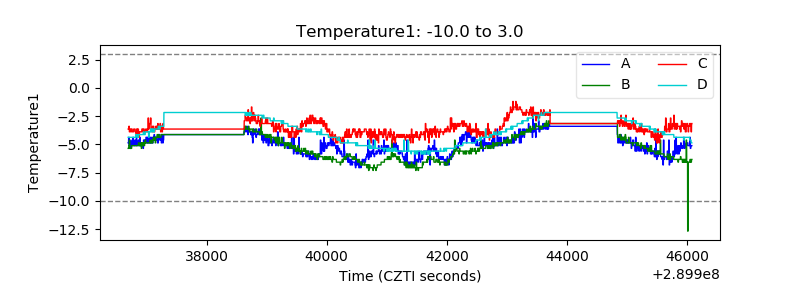 |
| Veto HV Monitor |  |
| Veto LLD | 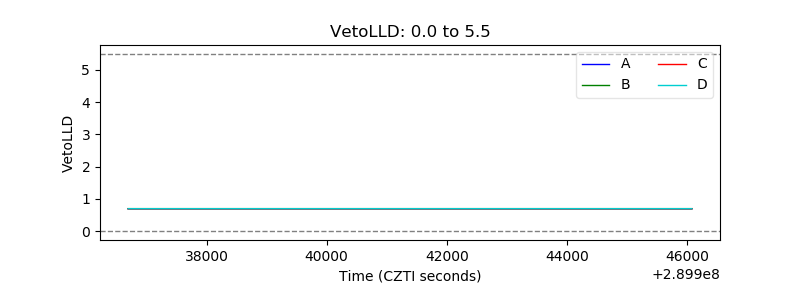 |
| Alpha Counter | 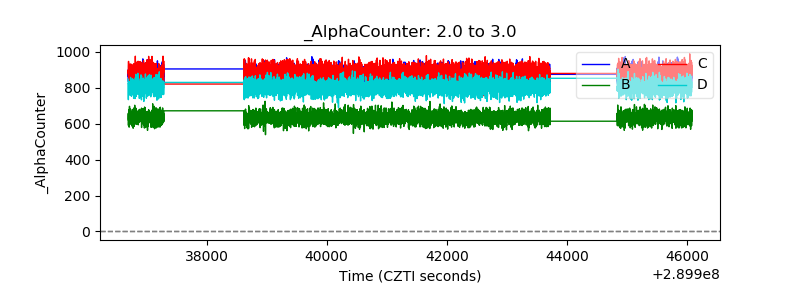 |
| _CPM_Rate | 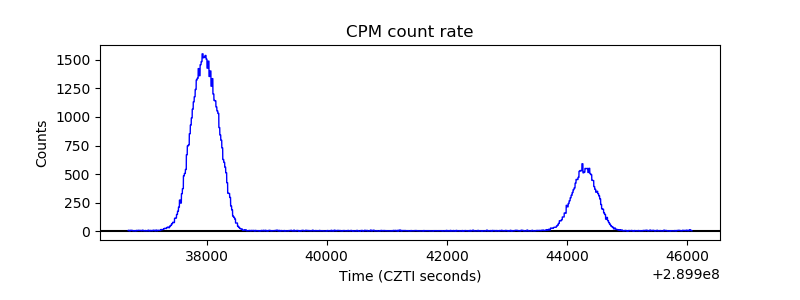 |
| CZT Counter | 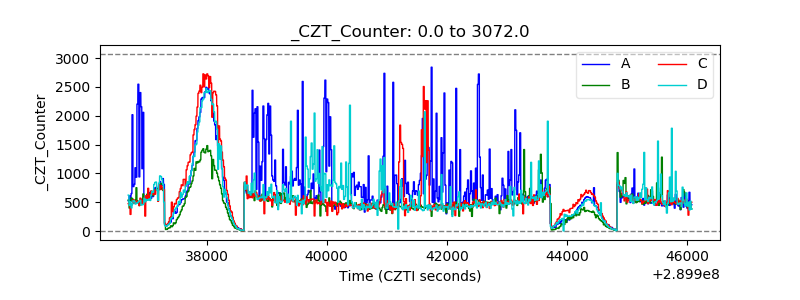 |
| +2.5 Volts monitor |  |
| +5 Volts monitor |  |
| _ROLL_ROT | 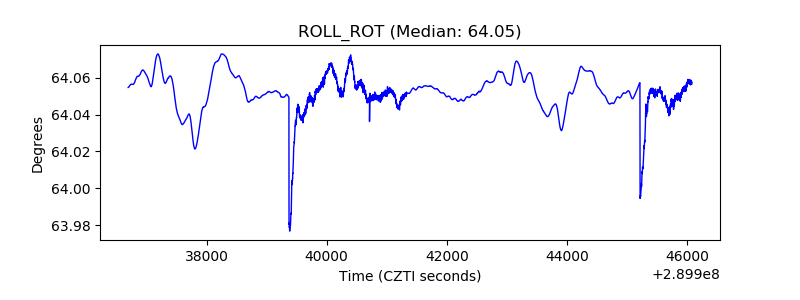 |
| _Roll_DEC | 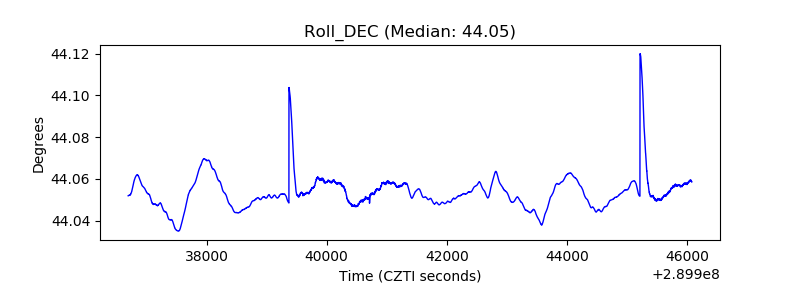 |
| _Roll_RA | 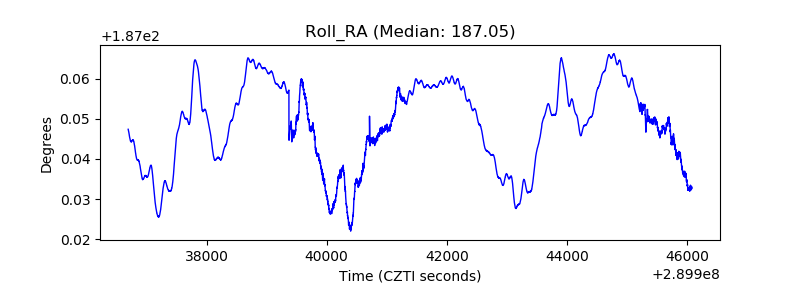 |
| Veto Counter | 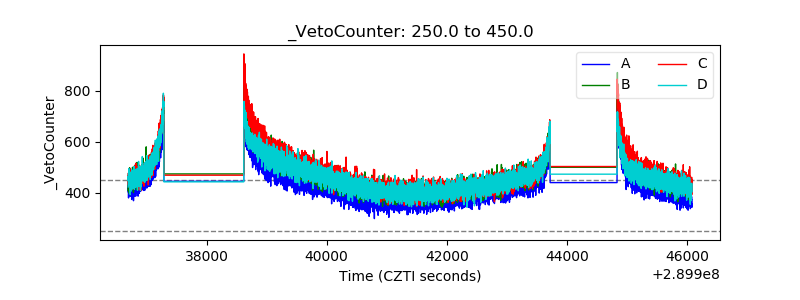 |