| Param | Original file | Final file |
|---|---|---|
| Filename | modeM0/AS1A06_003T01_9000002786_18646cztM0_level2.evt | modeM0/AS1A06_003T01_9000002786_18646cztM0_level2_quad_clean.evt |
| Size (bytes) | 516,381,120 | 97,865,280 |
| Size | 492.5 MB | 93.3 MB |
| Events in quadrant A | 4,480,753 | 616,628 |
| Events in quadrant B | 3,404,307 | 635,937 |
| Events in quadrant C | 3,368,316 | 623,112 |
| Events in quadrant D | 3,916,526 | 606,745 |
| Mode SS | |||
|---|---|---|---|
| Quadrant | BADHDUFLAG | Total packets | Discarded packets |
| A | 0 | 140 | 0 |
| B | 0 | 140 | 0 |
| C | 0 | 140 | 0 |
| D | 0 | 140 | 0 |
| Mode M0 | |||
|---|---|---|---|
| Quadrant | BADHDUFLAG | Total packets | Discarded packets |
| A | 0 | 17935 | 2 |
| B | 0 | 14705 | 2 |
| C | 0 | 14395 | 2 |
| D | 0 | 16323 | 2 |
| Mode M9 | |||
|---|---|---|---|
| Quadrant | BADHDUFLAG | Total packets | Discarded packets |
| A | 0 | 10 | 0 |
| B | 0 | 11 | 0 |
| C | 0 | 11 | 0 |
| D | 0 | 11 | 0 |
| Quadrant | Total seconds | Saturated seconds | Saturation percentage |
|---|---|---|---|
| A | 6911 | 134 | 1.938938% |
| B | 6911 | 85 | 1.229923% |
| C | 6911 | 97 | 1.403560% |
| D | 6910 | 80 | 1.157742% |
Noise dominated data is calculated using 1-second bins in cleaned event files. If a bin has >2000 counts, and if more than 50% of those come from <1% of pixels, then it is considered to be noise-dominated and hence unusable.
| Quadrant | # 1 sec bins | Bins with >0 counts | Bins with >2000 counts | High rate bins dominated by noise | Noise dominated (total time) | Noise dominated (detector-on time) | Marked lightcurve |
|---|---|---|---|---|---|---|---|
| A | 7646 | 6912 | 81 | 81 | 1.06% | 1.17% | 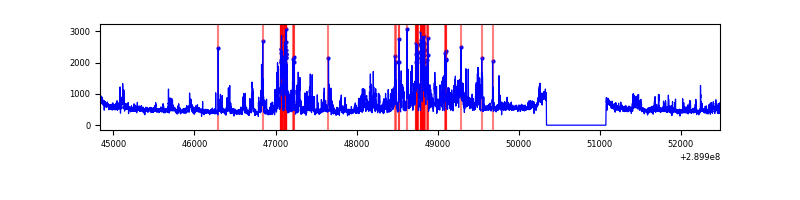 |
| B | 7646 | 6912 | 2 | 2 | 0.03% | 0.03% | 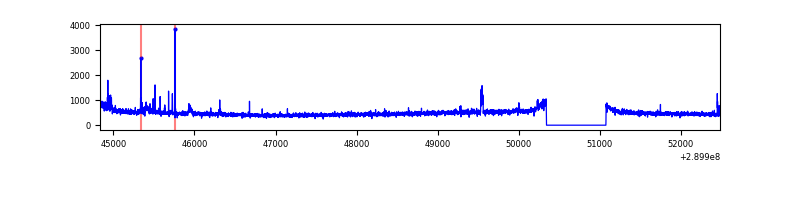 |
| C | 7646 | 6912 | 0 | 0 | 0.00% | 0.00% | 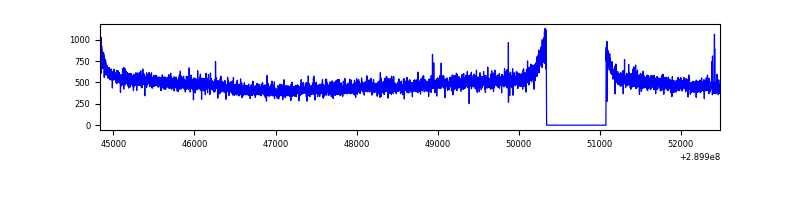 |
| D | 7645 | 6911 | 34 | 34 | 0.44% | 0.49% | 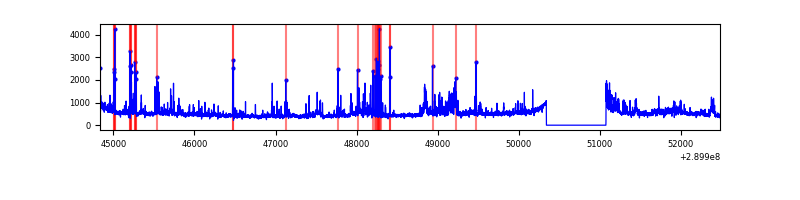 |
Top three noisy pixels from each quadrant. If the there are fewer than three noisy pixels in the level2.evt file, extra rows are filled as -1
| Pixel properties | Quadrant properties | ||||||
|---|---|---|---|---|---|---|---|
| Quadrant | DetID | PixID | Counts | Sigma | Mean | Median | Sigma |
| A | 0 | 13 | 1246673 | 7370.09 | 833 | 816 | 169.0 |
| A | 6 | 16 | 13489 | 74.97 | 833 | 816 | 169.0 |
| A | 11 | 29 | 12560 | 69.47 | 833 | 816 | 169.0 |
| B | 0 | 183 | 71866 | 439.59 | 839 | 817 | 161.6 |
| B | 0 | 230 | 20017 | 118.79 | 839 | 817 | 161.6 |
| B | 12 | 111 | 19927 | 118.23 | 839 | 817 | 161.6 |
| C | 14 | 238 | 126955 | 655.41 | 821 | 827 | 192.4 |
| C | 3 | 233 | 27088 | 136.46 | 821 | 827 | 192.4 |
| C | 9 | 221 | 6736 | 30.71 | 821 | 827 | 192.4 |
| D | 7 | 238 | 418531 | 2093.75 | 822 | 796 | 199.5 |
| D | 1 | 52 | 318755 | 1593.66 | 822 | 796 | 199.5 |
| D | 2 | 152 | 46497 | 229.06 | 822 | 796 | 199.5 |
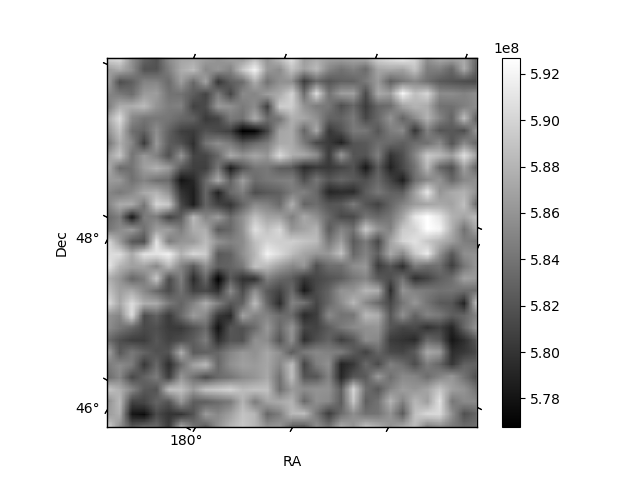
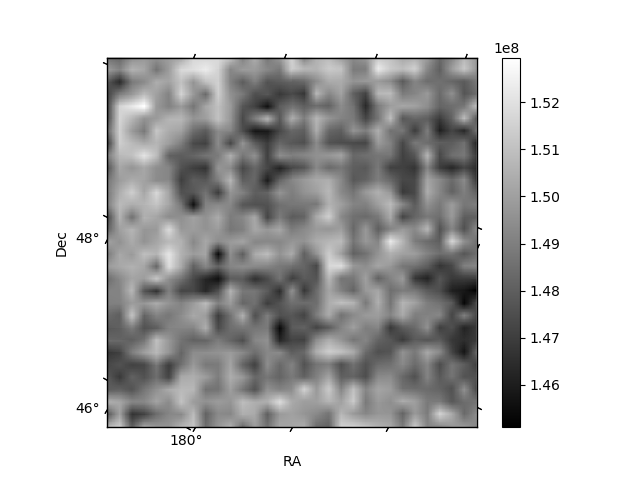
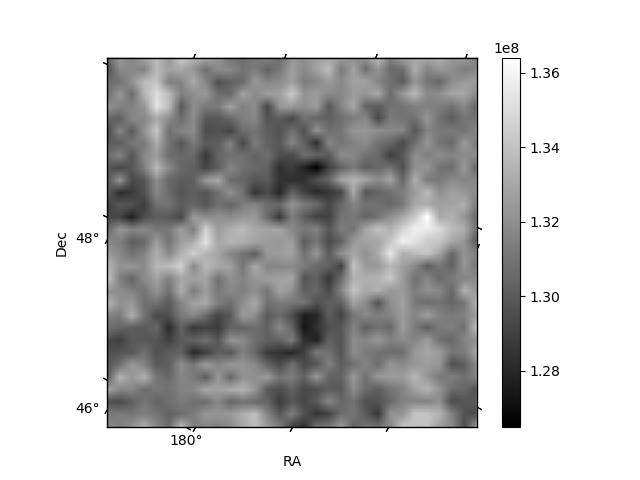
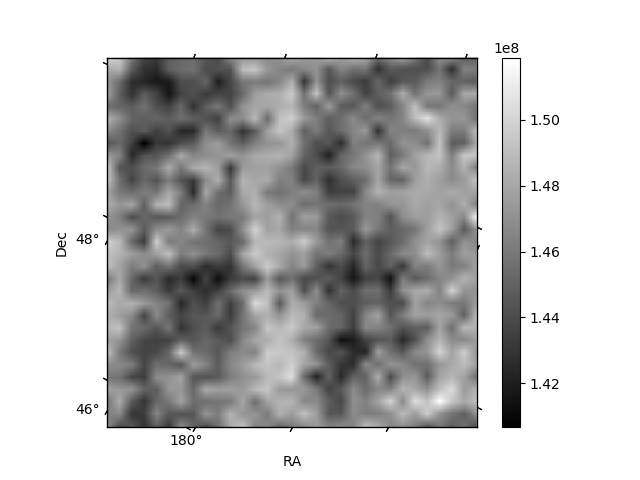
Histogram calculated using DETX and DETY for each event in the final _common_clean file
| Quadrant A | 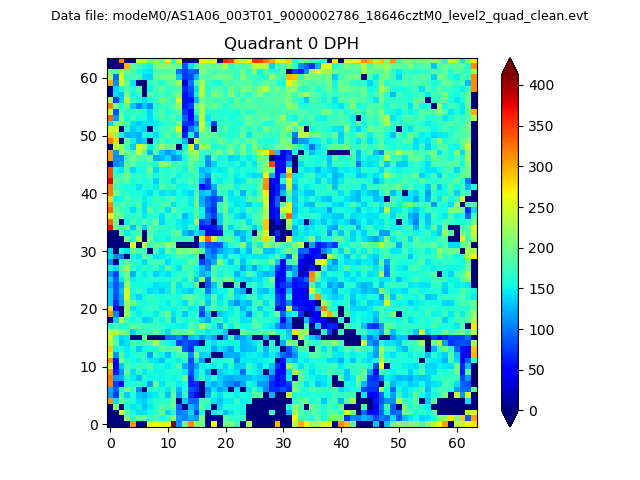 |
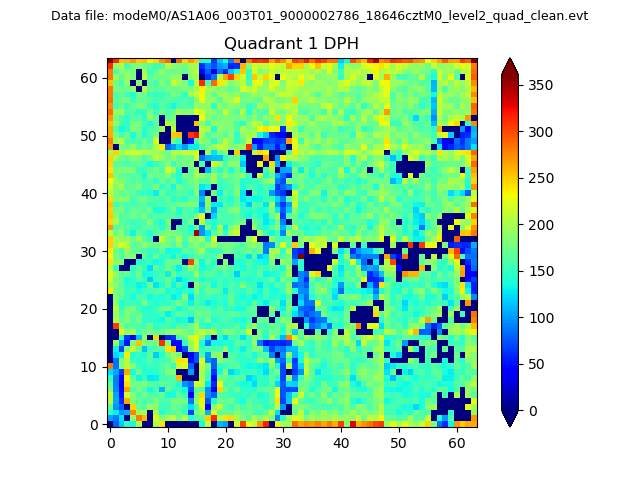 |
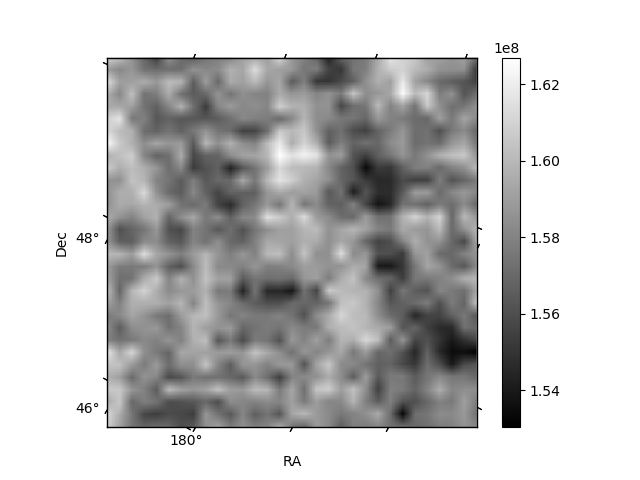
Quadrant B |
|---|---|---|---|
| Quadrant D | 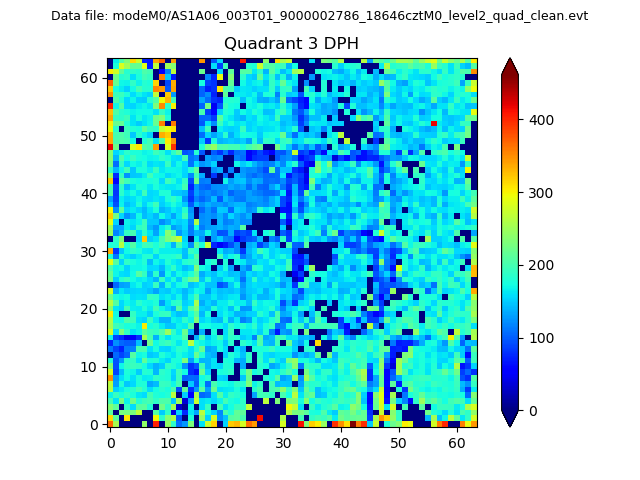 |
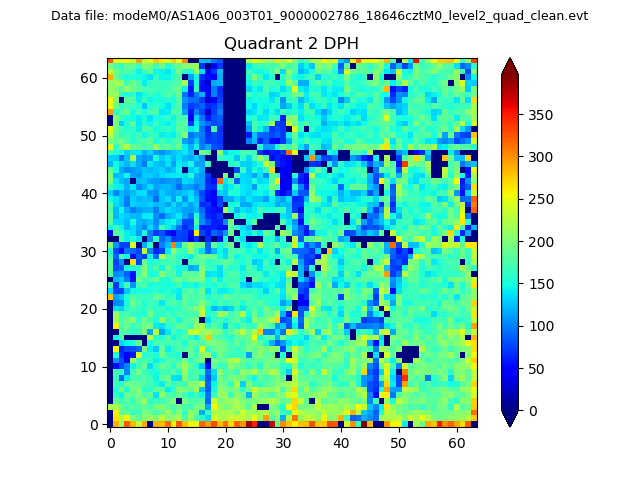 |
Quadrant C |
| Plot type | Count rate plots | Images |
|---|---|---|
| Comparison with Poisson distribution Blue bars denote a histogram of data divided into 1 sec bins. Red curve is a Poisson curve with rate = median count rate of data. |
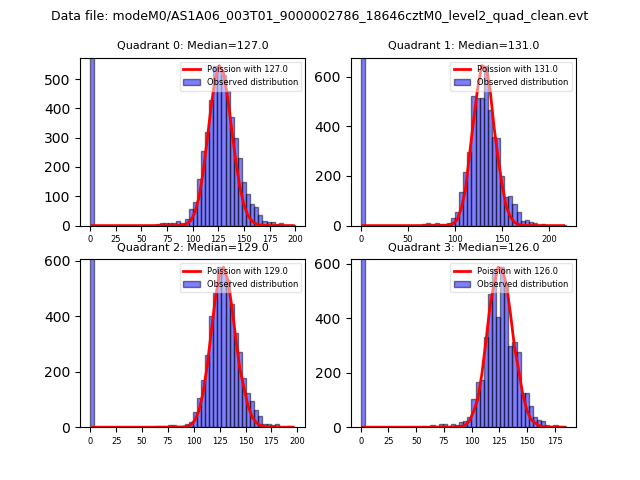 |
 |
| Quadrant-wise count rates Data is divided into 100 sec bins |
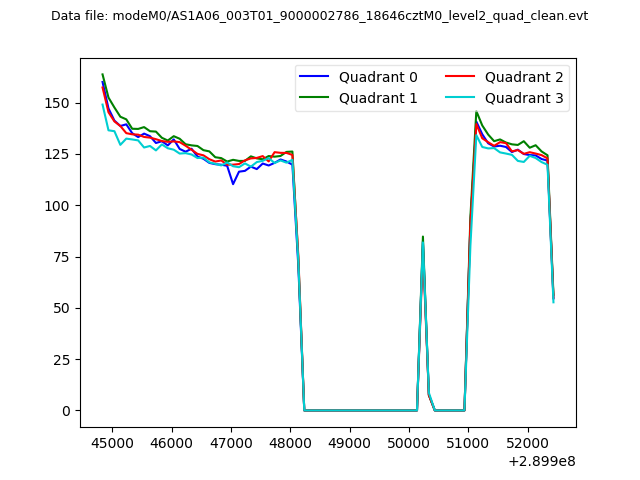 |
|
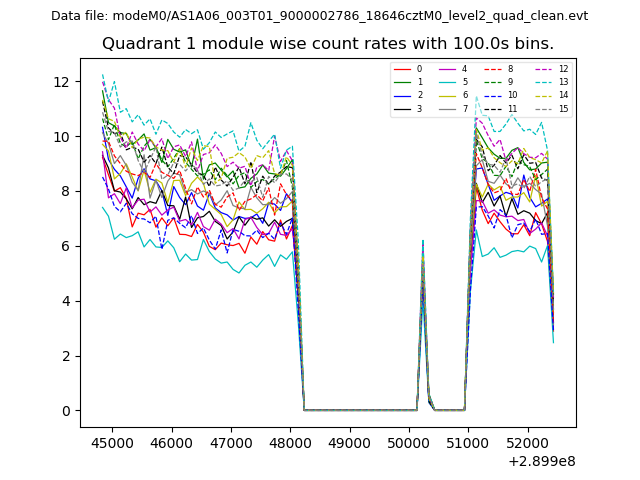
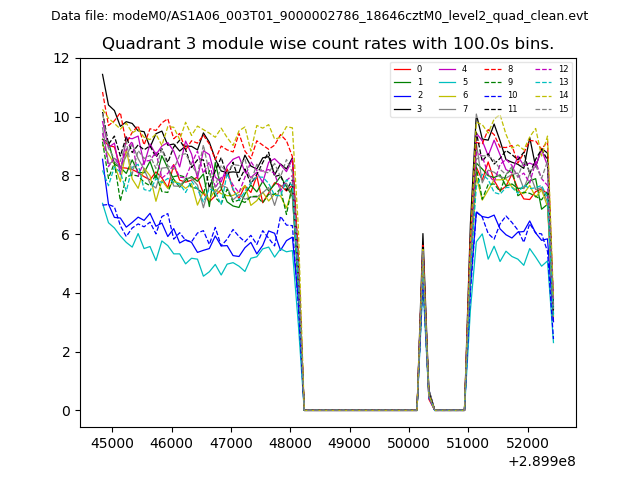
| Module-wise count rates for Quadrant A Data is divided into 100 sec bins |
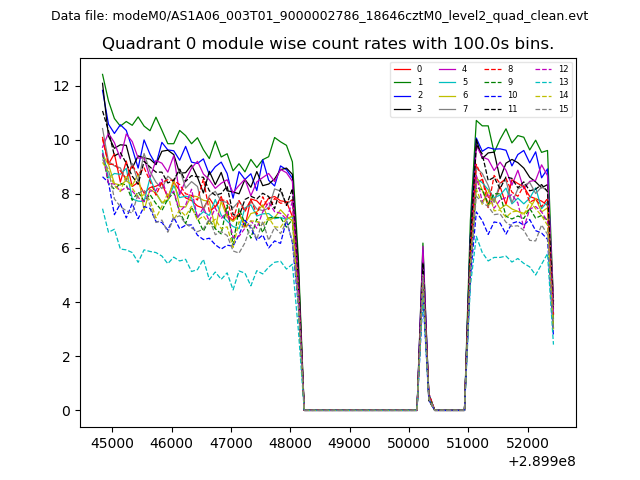 |
 |
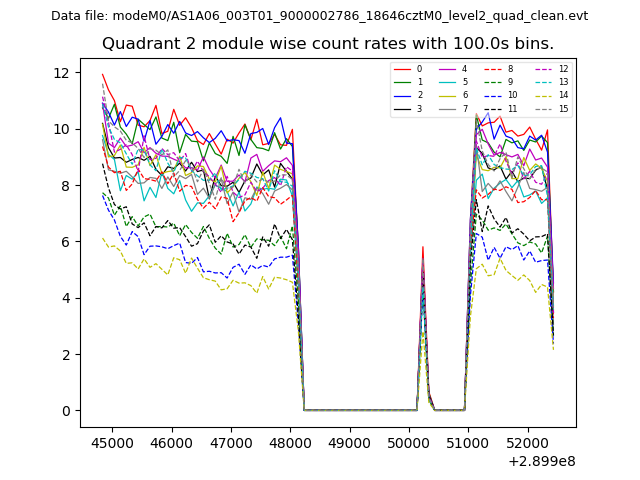
| Module-wise count rates for Quadrant B Data is divided into 100 sec bins |
 |
 |
| Module-wise count rates for Quadrant C Data is divided into 100 sec bins |
 |
 |
| Module-wise count rates for Quadrant D Data is divided into 100 sec bins |
 |
 |
| Parameter | Plot |
|---|---|
| CZT HV Monitor | 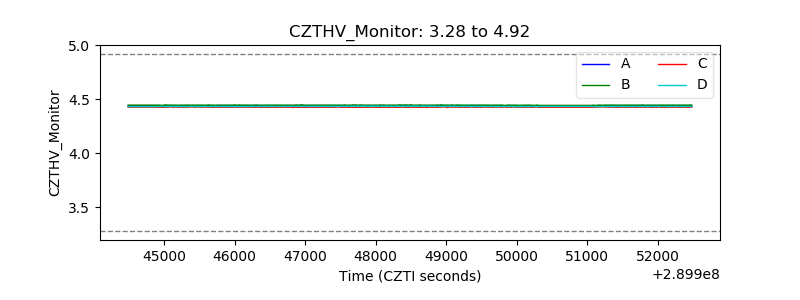 |
| D_VDD | 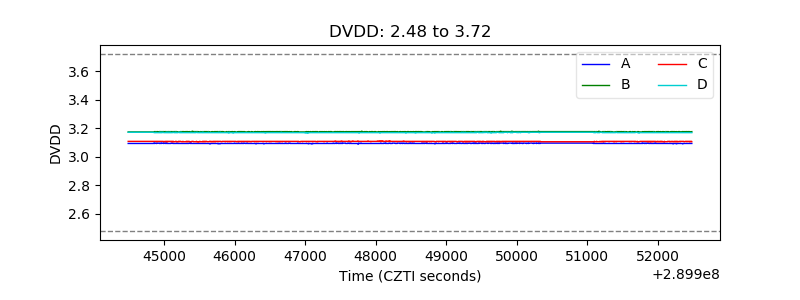 |
| Temperature 1 | 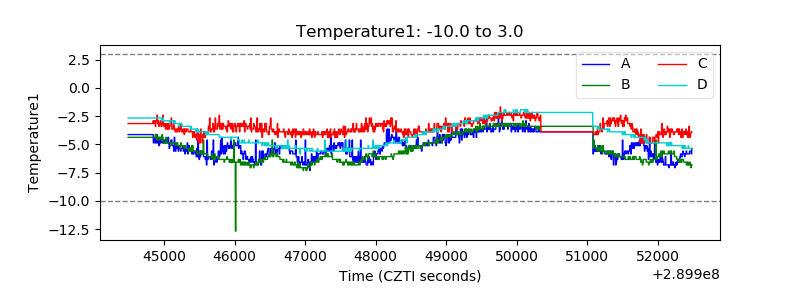 |
| Veto HV Monitor | 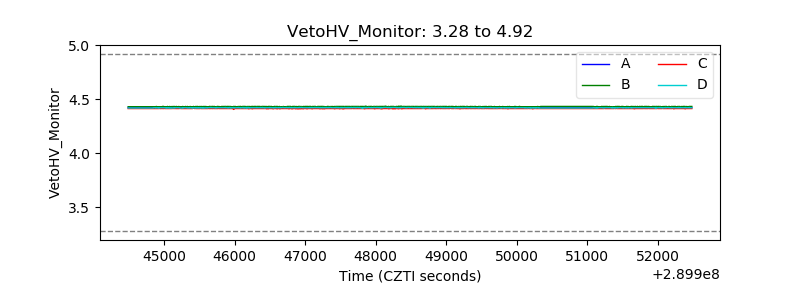 |
| Veto LLD | 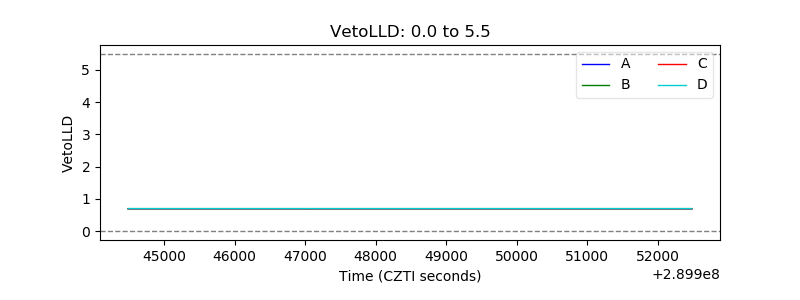 |
| Alpha Counter | 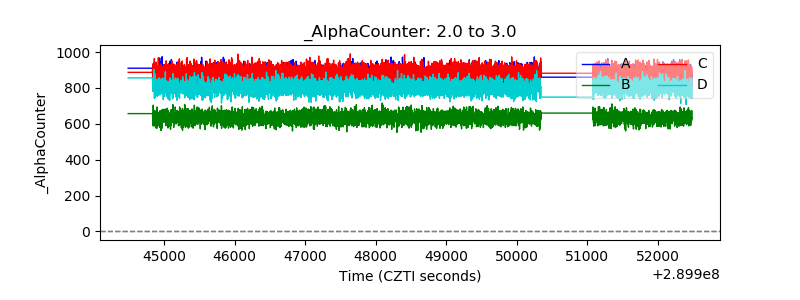 |
| _CPM_Rate | 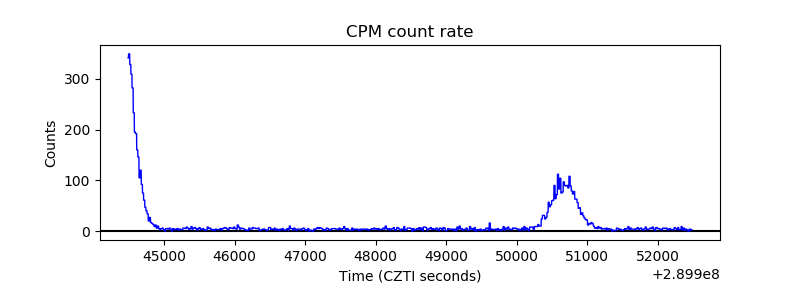 |
| CZT Counter | 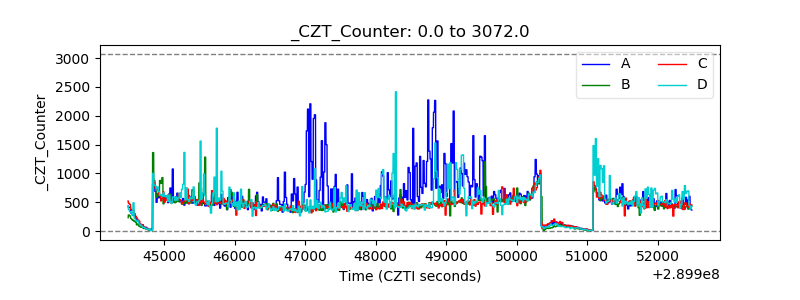 |
| +2.5 Volts monitor |  |
| +5 Volts monitor |  |
| _ROLL_ROT | 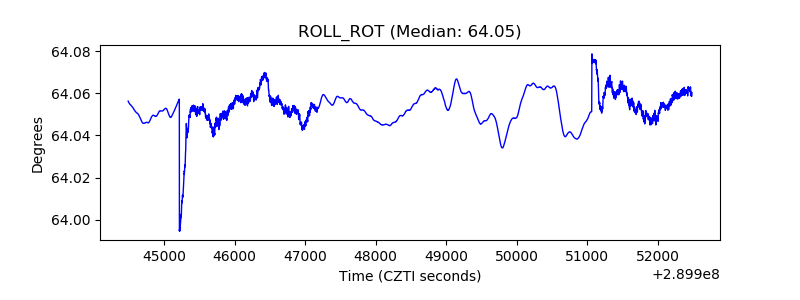 |
| _Roll_DEC | 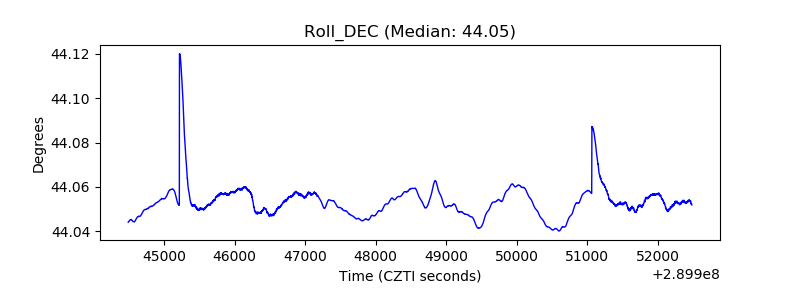 |
| _Roll_RA | 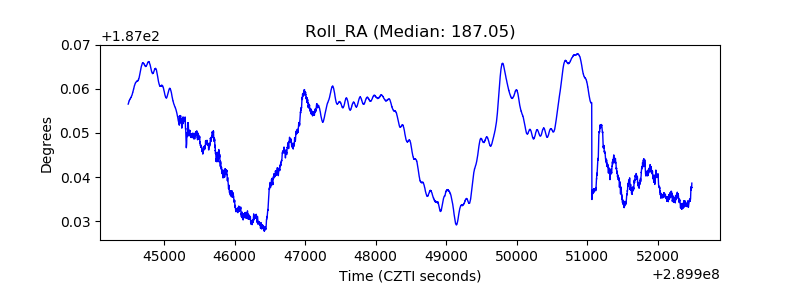 |
| Veto Counter | 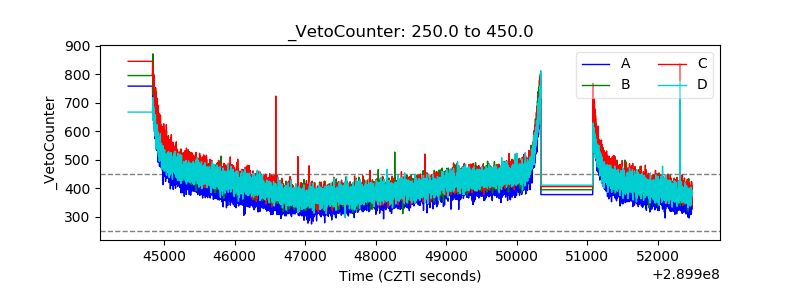 |