| Param | Original file | Final file |
|---|---|---|
| Filename | modeM0/AS1A06_003T01_9000002786_18647cztM0_level2.evt | modeM0/AS1A06_003T01_9000002786_18647cztM0_level2_quad_clean.evt |
| Size (bytes) | 584,893,440 | 108,987,840 |
| Size | 557.8 MB | 103.9 MB |
| Events in quadrant A | 4,057,216 | 690,668 |
| Events in quadrant B | 3,905,221 | 705,442 |
| Events in quadrant C | 3,906,354 | 691,960 |
| Events in quadrant D | 5,307,833 | 662,123 |
| Mode SS | |||
|---|---|---|---|
| Quadrant | BADHDUFLAG | Total packets | Discarded packets |
| A | 0 | 162 | 0 |
| B | 0 | 162 | 0 |
| C | 0 | 162 | 0 |
| D | 0 | 162 | 0 |
| Mode M0 | |||
|---|---|---|---|
| Quadrant | BADHDUFLAG | Total packets | Discarded packets |
| A | 0 | 17296 | 2 |
| B | 0 | 16915 | 2 |
| C | 0 | 16798 | 2 |
| D | 0 | 21552 | 2 |
| Mode M9 | |||
|---|---|---|---|
| Quadrant | BADHDUFLAG | Total packets | Discarded packets |
| A | 0 | 10 | 0 |
| B | 0 | 10 | 0 |
| C | 0 | 10 | 0 |
| D | 0 | 10 | 0 |
| Quadrant | Total seconds | Saturated seconds | Saturation percentage |
|---|---|---|---|
| A | 7917 | 91 | 1.149425% |
| B | 7918 | 160 | 2.020712% |
| C | 7918 | 178 | 2.248042% |
| D | 7917 | 325 | 4.105090% |
Noise dominated data is calculated using 1-second bins in cleaned event files. If a bin has >2000 counts, and if more than 50% of those come from <1% of pixels, then it is considered to be noise-dominated and hence unusable.
| Quadrant | # 1 sec bins | Bins with >0 counts | Bins with >2000 counts | High rate bins dominated by noise | Noise dominated (total time) | Noise dominated (detector-on time) | Marked lightcurve |
|---|---|---|---|---|---|---|---|
| A | 8927 | 7919 | 3 | 3 | 0.03% | 0.04% | 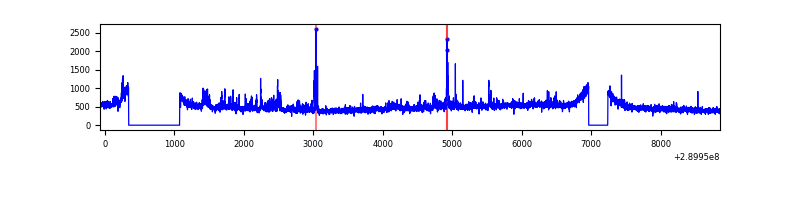 |
| B | 8928 | 7920 | 9 | 9 | 0.10% | 0.11% | 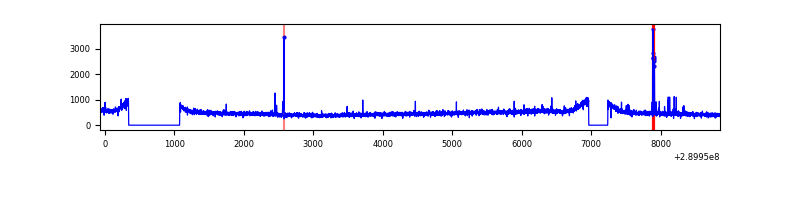 |
| C | 8928 | 7920 | 0 | 0 | 0.00% | 0.00% | 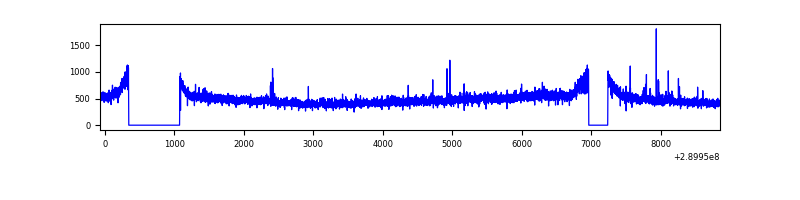 |
| D | 8927 | 7919 | 185 | 185 | 2.07% | 2.34% | 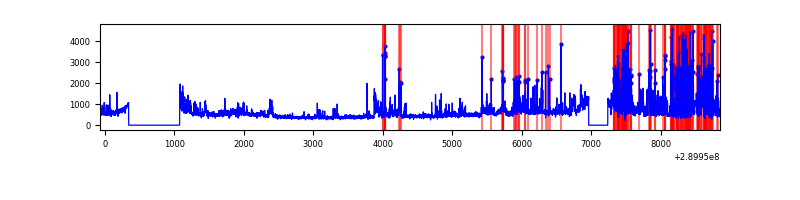 |
Top three noisy pixels from each quadrant. If the there are fewer than three noisy pixels in the level2.evt file, extra rows are filled as -1
| Pixel properties | Quadrant properties | ||||||
|---|---|---|---|---|---|---|---|
| Quadrant | DetID | PixID | Counts | Sigma | Mean | Median | Sigma |
| A | 0 | 13 | 270232 | 1369.48 | 969 | 948 | 196.6 |
| A | 6 | 16 | 26489 | 129.89 | 969 | 948 | 196.6 |
| A | 15 | 191 | 16716 | 80.19 | 969 | 948 | 196.6 |
| B | 0 | 230 | 56846 | 296.47 | 972 | 946 | 188.6 |
| B | 12 | 111 | 23351 | 118.83 | 972 | 946 | 188.6 |
| B | 11 | 111 | 20148 | 101.84 | 972 | 946 | 188.6 |
| C | 14 | 238 | 145422 | 645.44 | 948 | 954 | 223.8 |
| C | 9 | 221 | 38928 | 169.66 | 948 | 954 | 223.8 |
| C | 3 | 233 | 20479 | 87.23 | 948 | 954 | 223.8 |
| D | 1 | 52 | 1261132 | 5488.73 | 942 | 915 | 229.6 |
| D | 7 | 238 | 308712 | 1340.57 | 942 | 915 | 229.6 |
| D | 2 | 152 | 156772 | 678.82 | 942 | 915 | 229.6 |
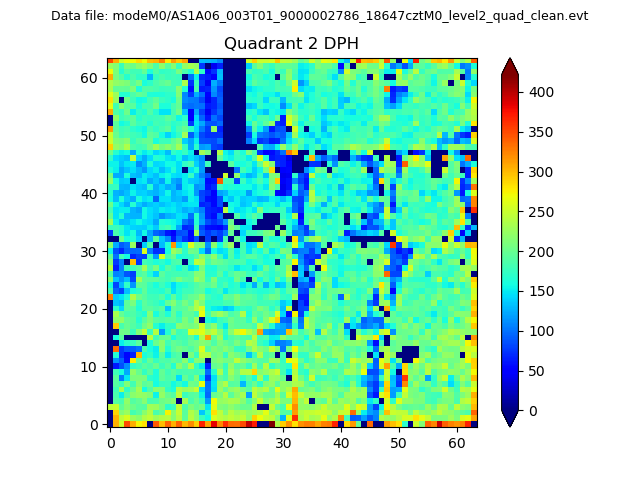
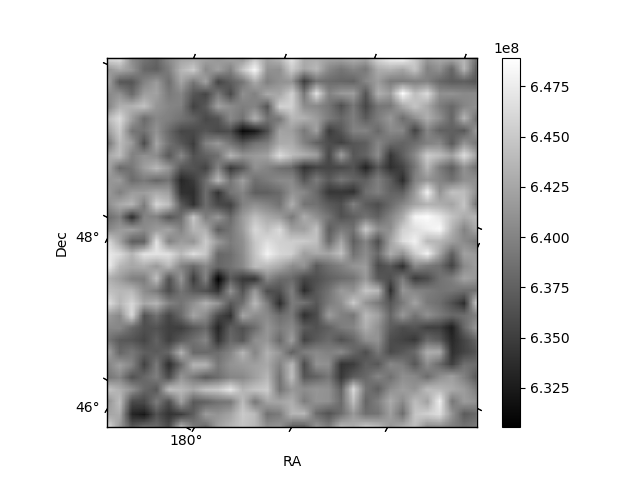
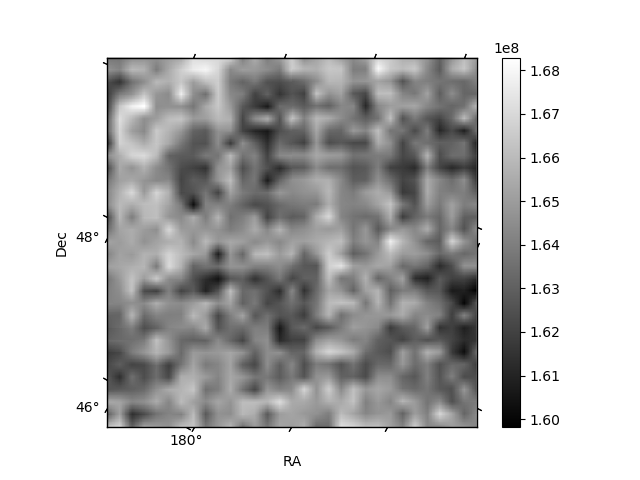
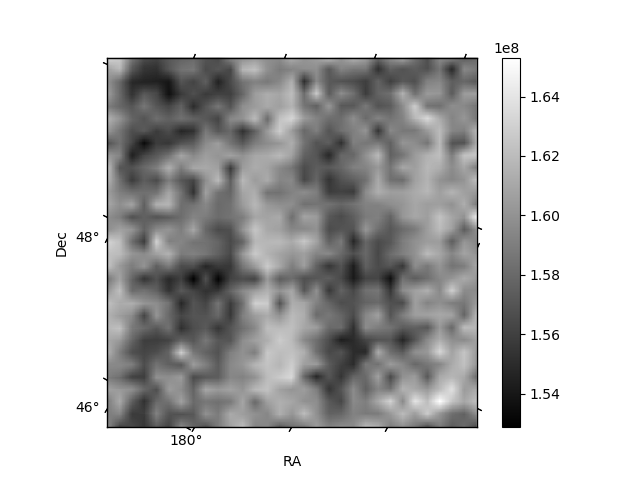
Histogram calculated using DETX and DETY for each event in the final _common_clean file
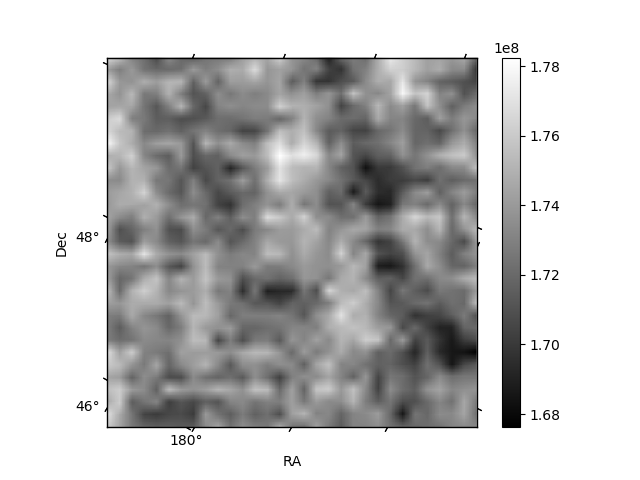
| Quadrant A | 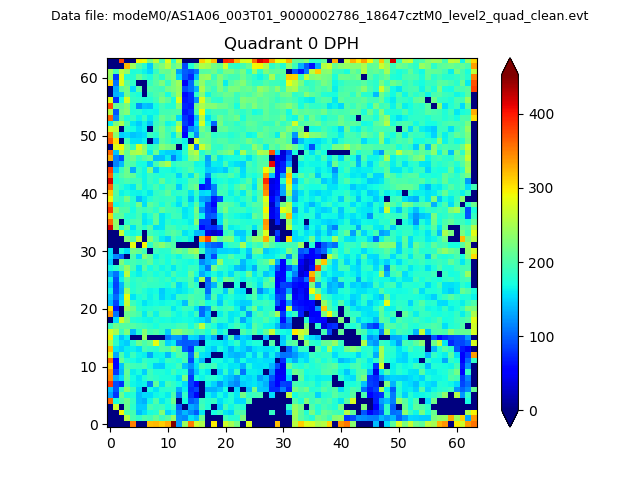 |
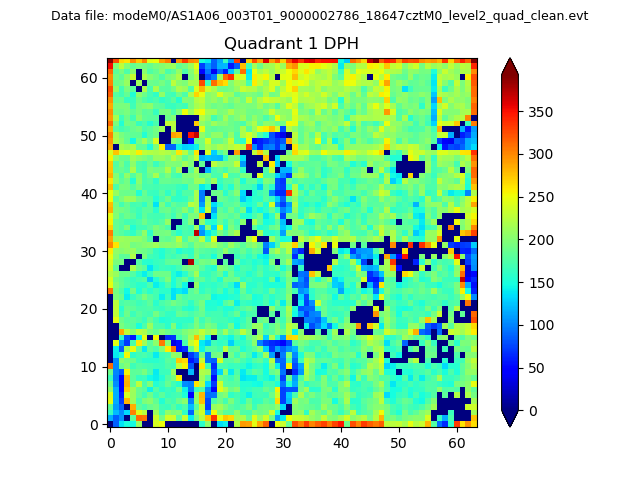 |
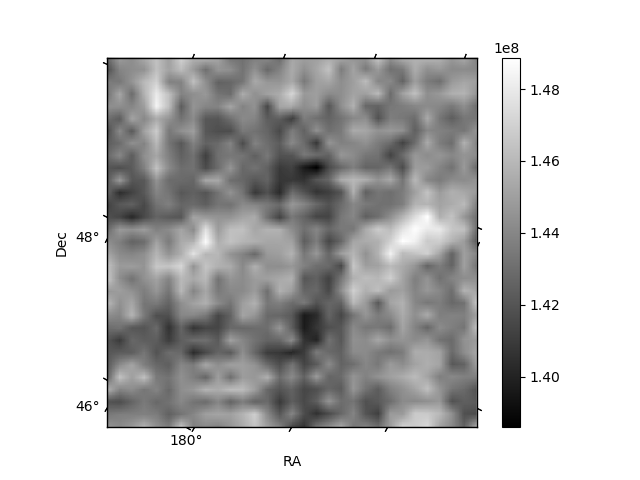
Quadrant B |
|---|---|---|---|
| Quadrant D | 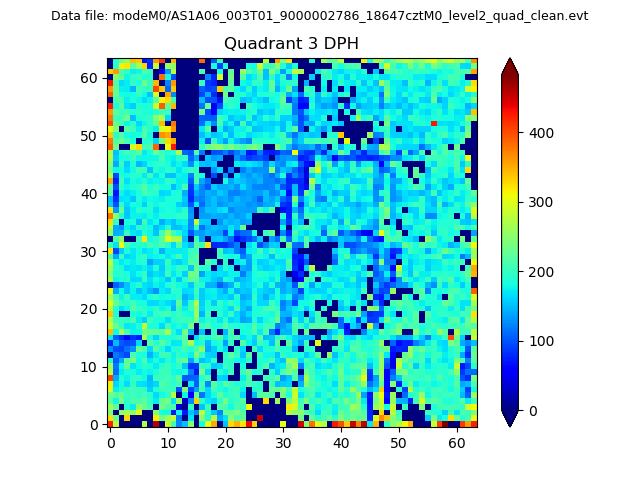 |
 |
Quadrant C |
| Plot type | Count rate plots | Images |
|---|---|---|
| Comparison with Poisson distribution Blue bars denote a histogram of data divided into 1 sec bins. Red curve is a Poisson curve with rate = median count rate of data. |
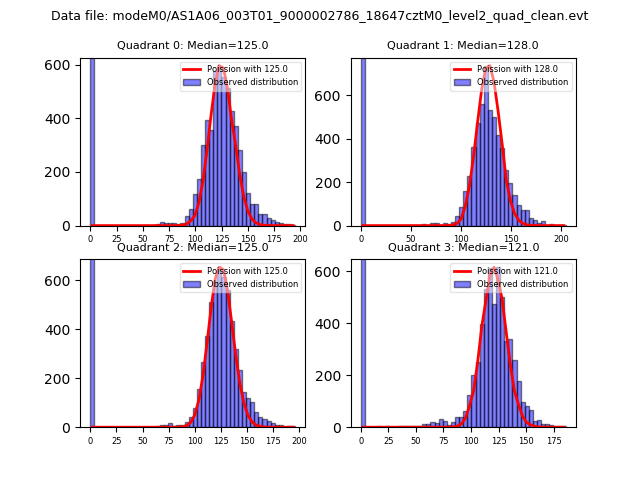 |
 |
| Quadrant-wise count rates Data is divided into 100 sec bins |
 |
|
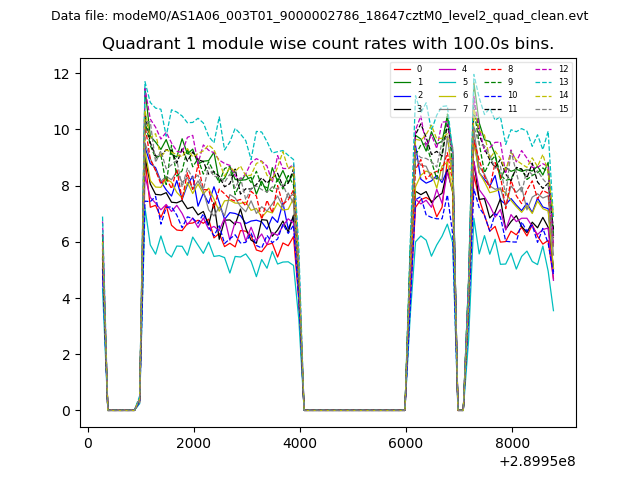
| Module-wise count rates for Quadrant A Data is divided into 100 sec bins |
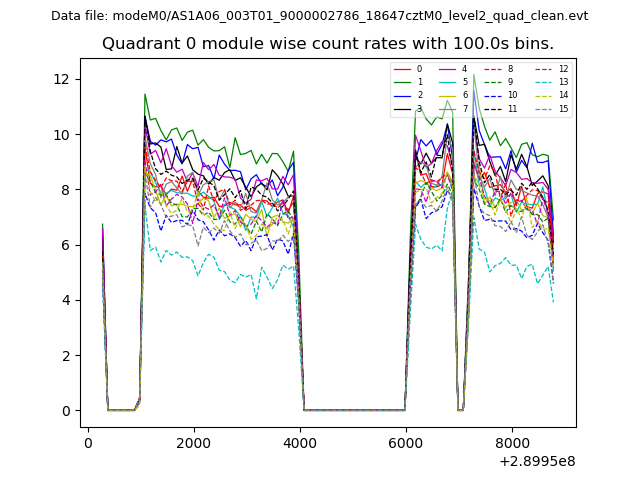 |
 |
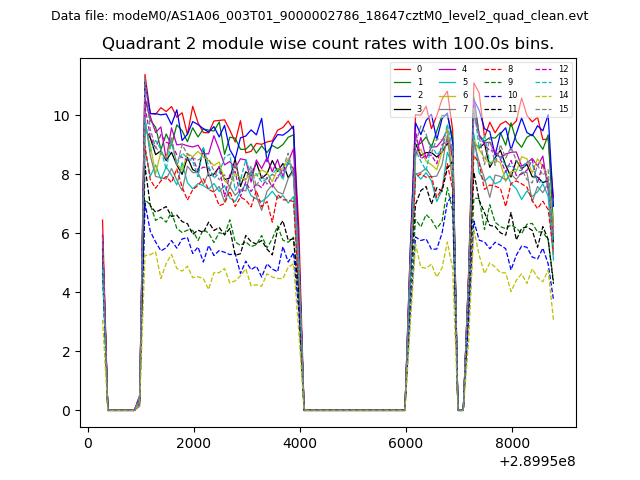
| Module-wise count rates for Quadrant B Data is divided into 100 sec bins |
 |
 |
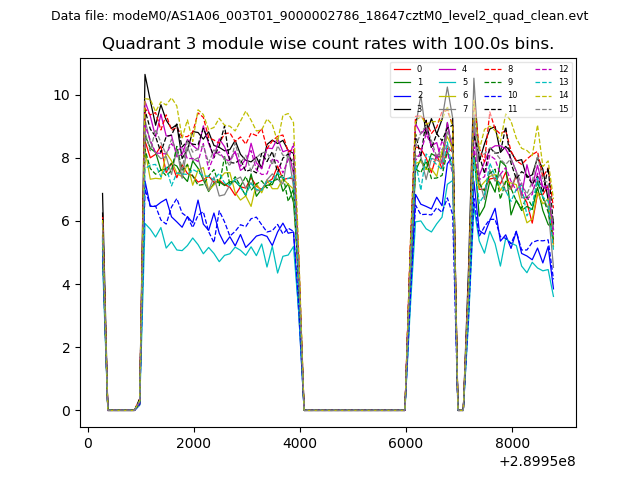
| Module-wise count rates for Quadrant C Data is divided into 100 sec bins |
 |
 |
| Module-wise count rates for Quadrant D Data is divided into 100 sec bins |
 |
 |
| Parameter | Plot |
|---|---|
| CZT HV Monitor | 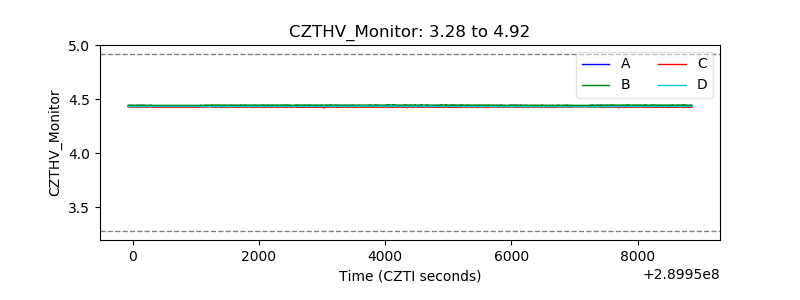 |
| D_VDD | 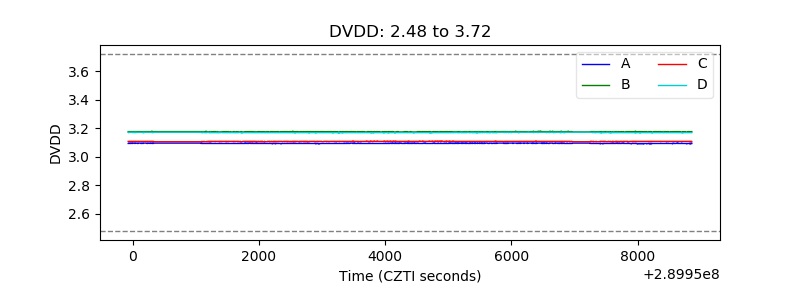 |
| Temperature 1 | 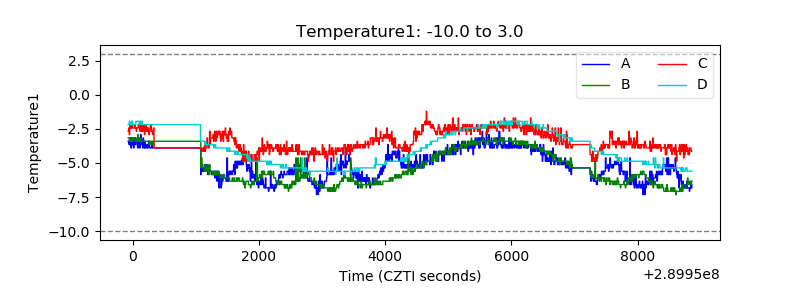 |
| Veto HV Monitor | 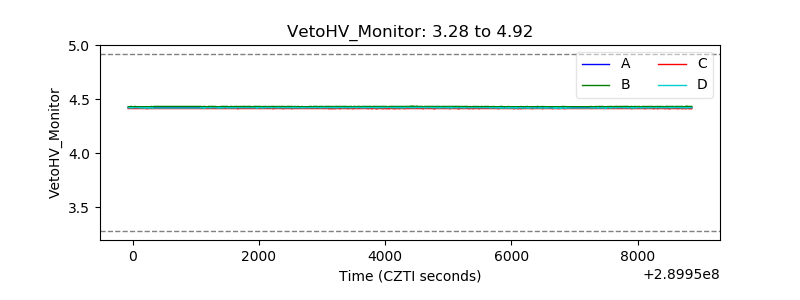 |
| Veto LLD | 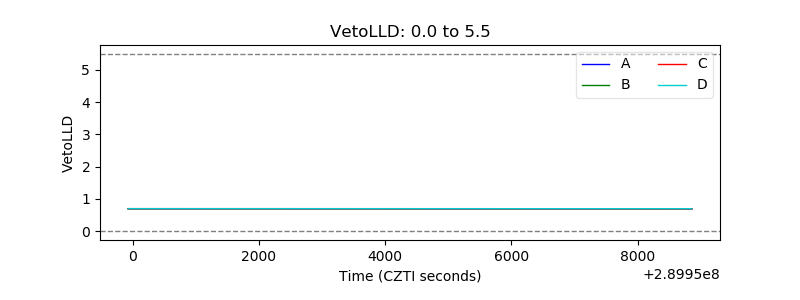 |
| Alpha Counter | 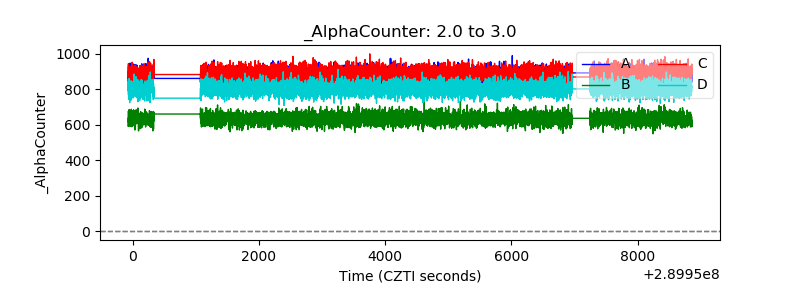 |
| _CPM_Rate |  |
| CZT Counter | 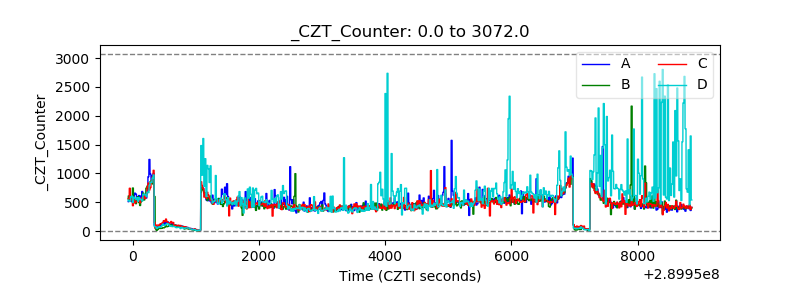 |
| +2.5 Volts monitor |  |
| +5 Volts monitor |  |
| _ROLL_ROT | 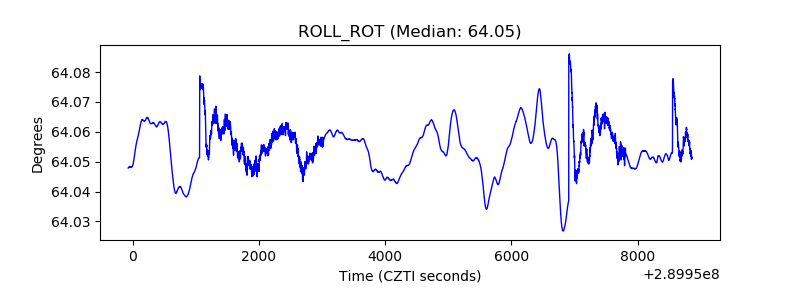 |
| _Roll_DEC | 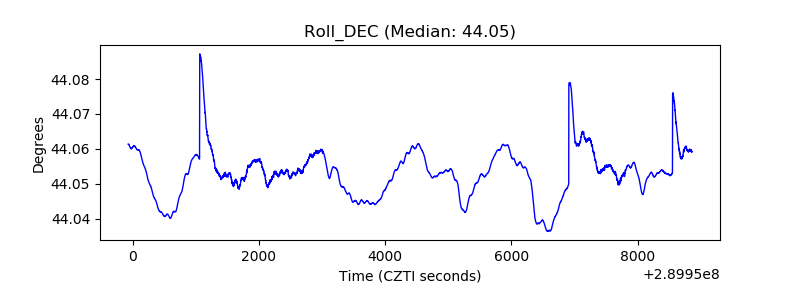 |
| _Roll_RA | 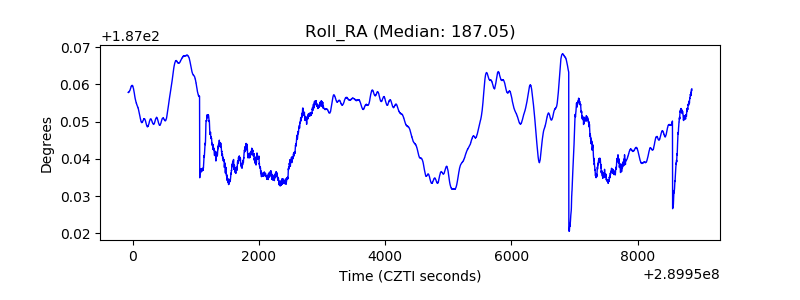 |
| Veto Counter | 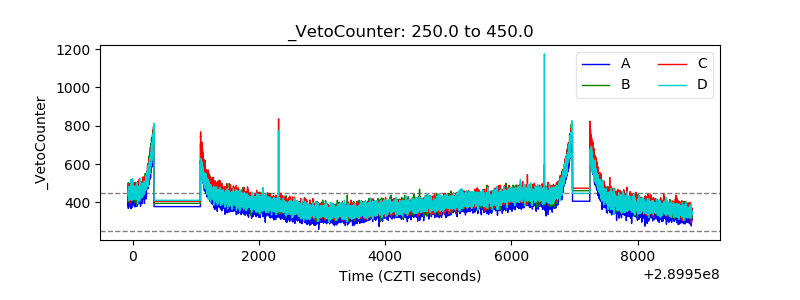 |