| Param | Original file | Final file |
|---|---|---|
| Filename | modeM0/AS1A06_003T01_9000002786_18648cztM0_level2.evt | modeM0/AS1A06_003T01_9000002786_18648cztM0_level2_quad_clean.evt |
| Size (bytes) | 573,053,760 | 113,376,960 |
| Size | 546.5 MB | 108.1 MB |
| Events in quadrant A | 3,812,751 | 727,462 |
| Events in quadrant B | 3,870,629 | 739,624 |
| Events in quadrant C | 3,882,875 | 726,490 |
| Events in quadrant D | 5,254,274 | 692,167 |
| Mode SS | |||
|---|---|---|---|
| Quadrant | BADHDUFLAG | Total packets | Discarded packets |
| A | 0 | 162 | 0 |
| B | 0 | 162 | 0 |
| C | 0 | 162 | 0 |
| D | 0 | 162 | 0 |
| Mode M0 | |||
|---|---|---|---|
| Quadrant | BADHDUFLAG | Total packets | Discarded packets |
| A | 0 | 16623 | 2 |
| B | 0 | 16848 | 2 |
| C | 0 | 16832 | 2 |
| D | 0 | 21126 | 2 |
| Mode M9 | |||
|---|---|---|---|
| Quadrant | BADHDUFLAG | Total packets | Discarded packets |
| A | 0 | 5 | 0 |
| B | 0 | 5 | 0 |
| C | 0 | 5 | 0 |
| D | 0 | 5 | 0 |
| Quadrant | Total seconds | Saturated seconds | Saturation percentage |
|---|---|---|---|
| A | 7881 | 138 | 1.751047% |
| B | 7881 | 218 | 2.766146% |
| C | 7881 | 228 | 2.893034% |
| D | 7882 | 391 | 4.960670% |
Noise dominated data is calculated using 1-second bins in cleaned event files. If a bin has >2000 counts, and if more than 50% of those come from <1% of pixels, then it is considered to be noise-dominated and hence unusable.
| Quadrant | # 1 sec bins | Bins with >0 counts | Bins with >2000 counts | High rate bins dominated by noise | Noise dominated (total time) | Noise dominated (detector-on time) | Marked lightcurve |
|---|---|---|---|---|---|---|---|
| A | 8311 | 7884 | 0 | 0 | 0.00% | 0.00% | 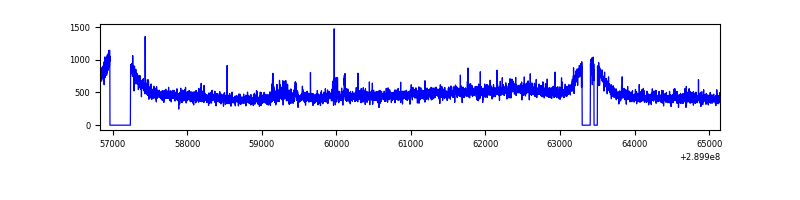 |
| B | 8311 | 7884 | 12 | 12 | 0.14% | 0.15% | 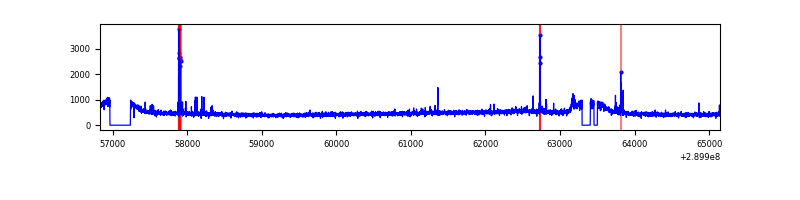 |
| C | 8311 | 7884 | 2 | 2 | 0.02% | 0.03% | 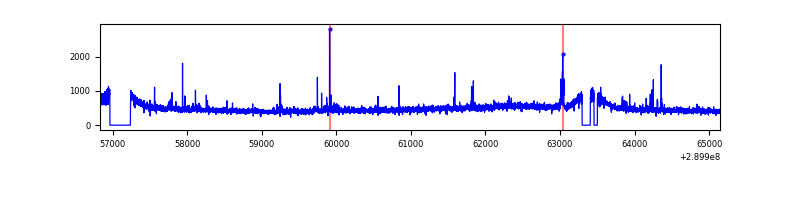 |
| D | 8312 | 7885 | 233 | 233 | 2.80% | 2.95% | 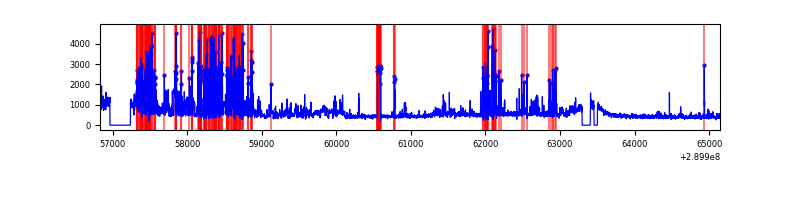 |
Top three noisy pixels from each quadrant. If the there are fewer than three noisy pixels in the level2.evt file, extra rows are filled as -1
| Pixel properties | Quadrant properties | ||||||
|---|---|---|---|---|---|---|---|
| Quadrant | DetID | PixID | Counts | Sigma | Mean | Median | Sigma |
| A | 0 | 13 | 98918 | 502.31 | 955 | 934 | 195.1 |
| A | 15 | 191 | 13710 | 65.5 | 955 | 934 | 195.1 |
| A | 6 | 16 | 12954 | 61.62 | 955 | 934 | 195.1 |
| B | 0 | 230 | 76192 | 406.09 | 955 | 929 | 185.3 |
| B | 12 | 111 | 23300 | 120.7 | 955 | 929 | 185.3 |
| B | 0 | 244 | 22645 | 117.17 | 955 | 929 | 185.3 |
| C | 14 | 238 | 142760 | 648.73 | 930 | 937 | 218.6 |
| C | 9 | 221 | 98039 | 444.17 | 930 | 937 | 218.6 |
| C | 5 | 112 | 13990 | 59.71 | 930 | 937 | 218.6 |
| D | 1 | 52 | 1678004 | 7437.04 | 923 | 896 | 225.5 |
| D | 7 | 238 | 56748 | 247.67 | 923 | 896 | 225.5 |
| D | 2 | 234 | 29395 | 126.38 | 923 | 896 | 225.5 |
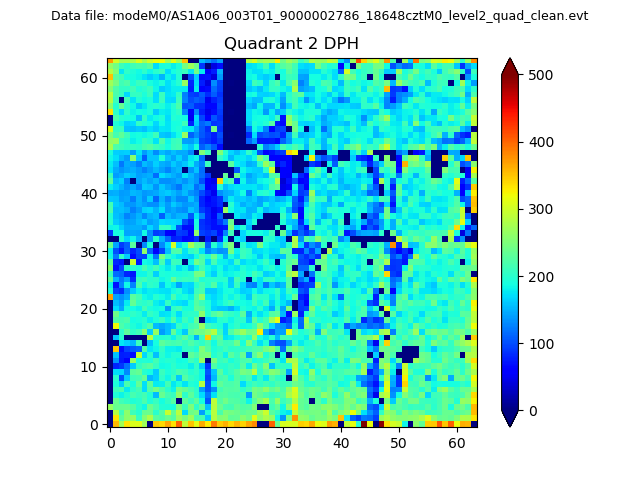
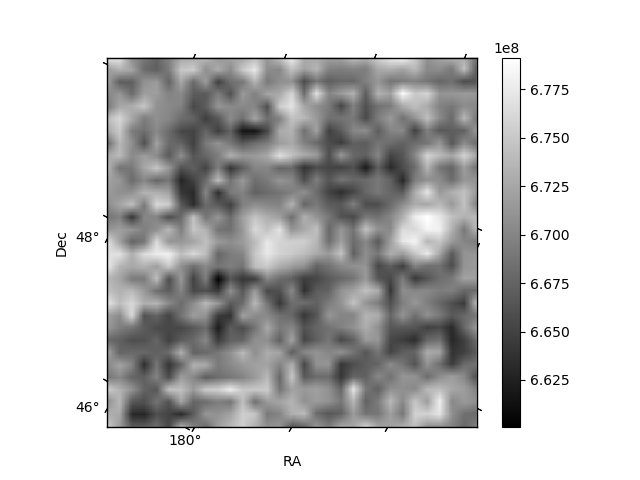
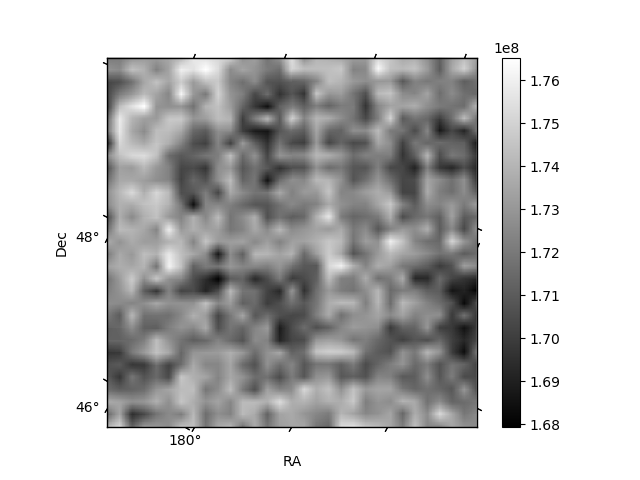
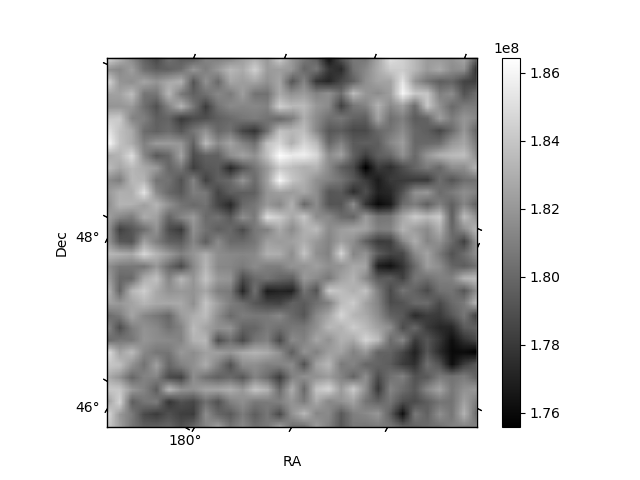
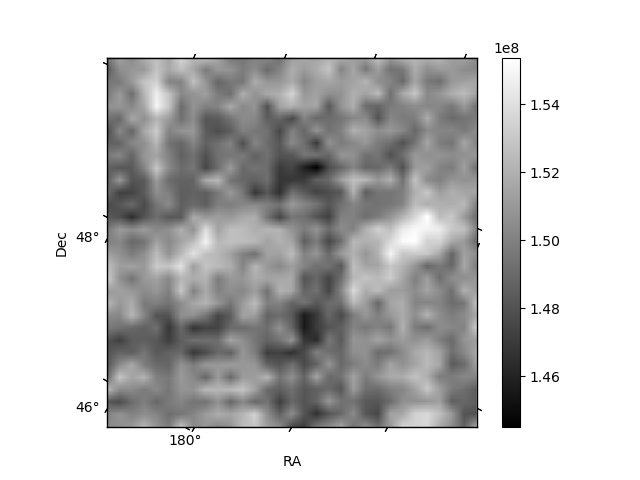
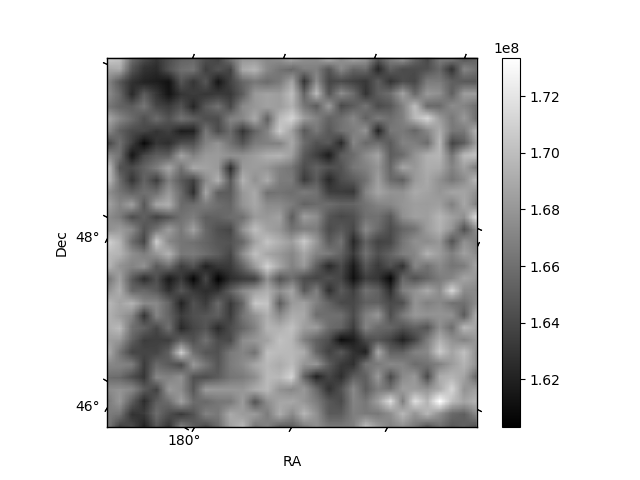
Histogram calculated using DETX and DETY for each event in the final _common_clean file
| Quadrant A | 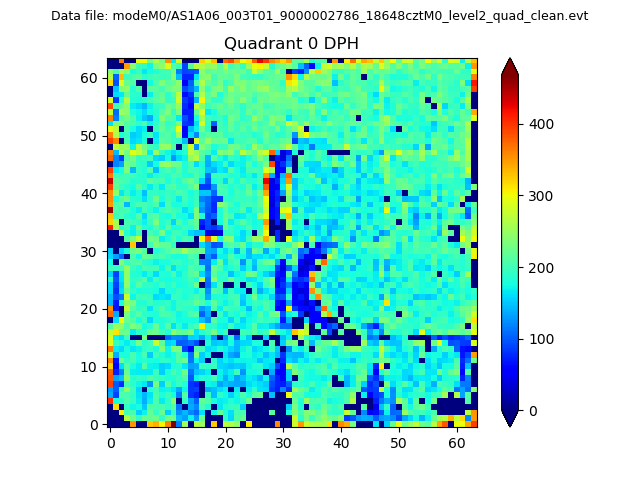 |
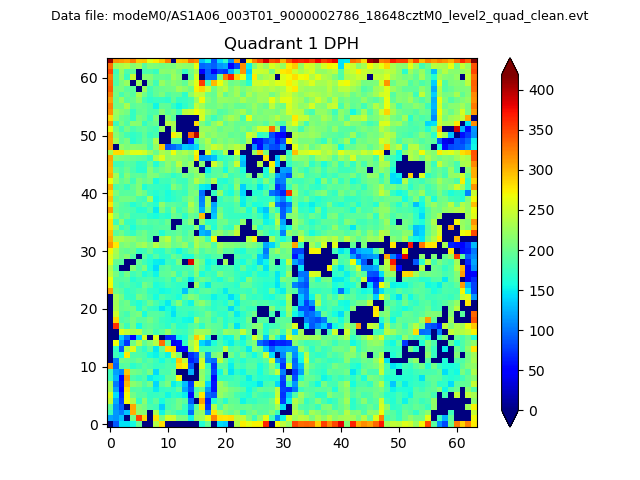 |
Quadrant B |
|---|---|---|---|
| Quadrant D | 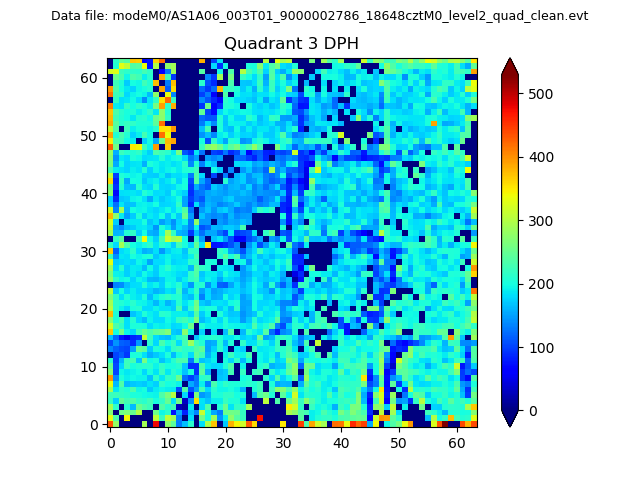 |
 |
Quadrant C |
| Plot type | Count rate plots | Images |
|---|---|---|
| Comparison with Poisson distribution Blue bars denote a histogram of data divided into 1 sec bins. Red curve is a Poisson curve with rate = median count rate of data. |
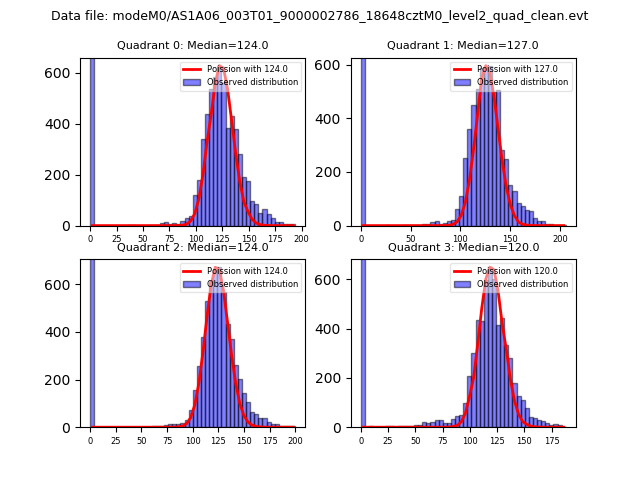 |
 |
| Quadrant-wise count rates Data is divided into 100 sec bins |
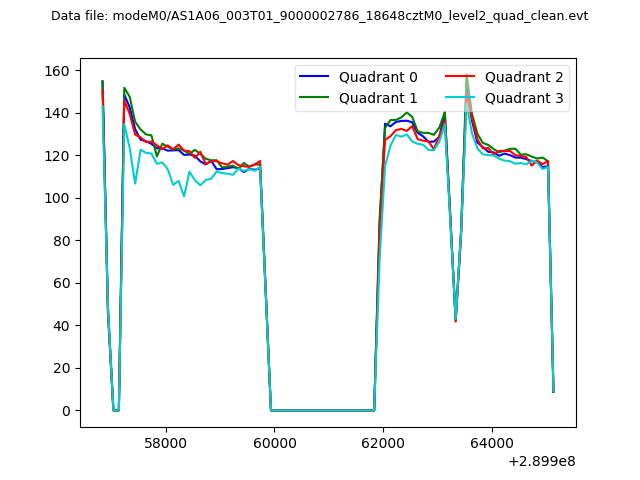 |
|
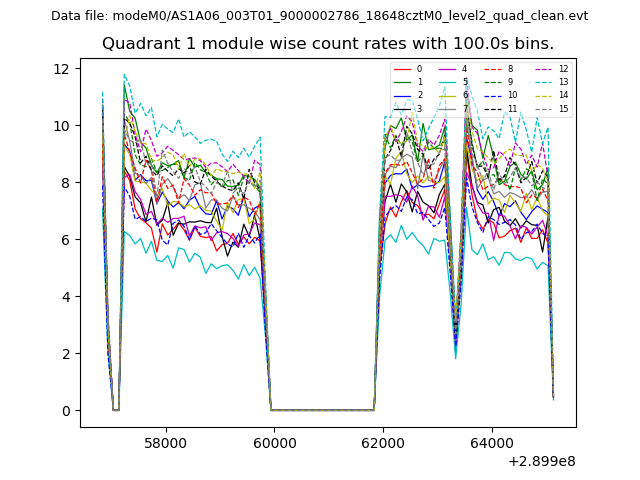
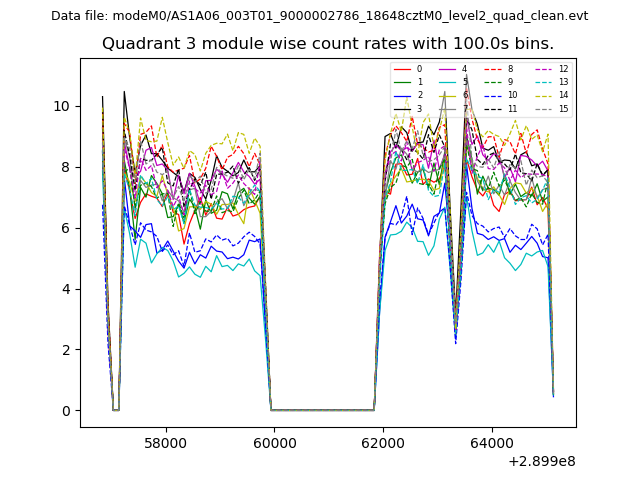
| Module-wise count rates for Quadrant A Data is divided into 100 sec bins |
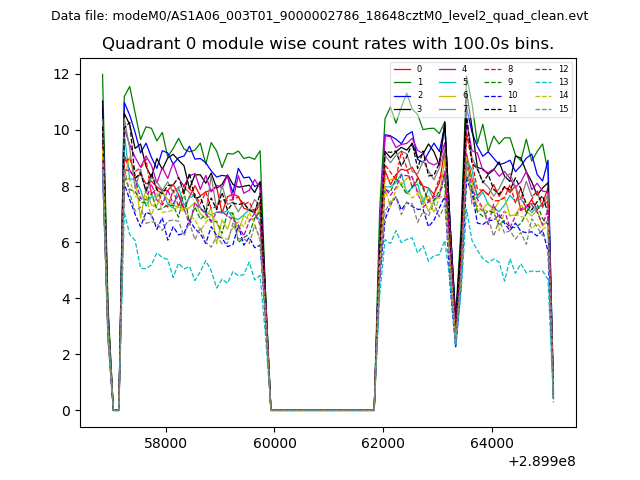 |
 |
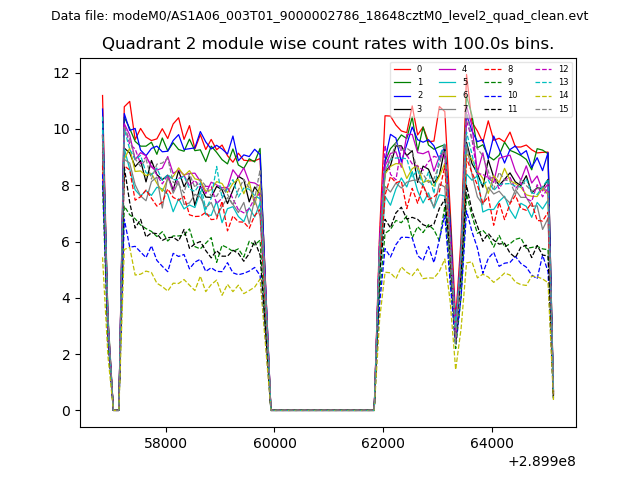
| Module-wise count rates for Quadrant B Data is divided into 100 sec bins |
 |
 |
| Module-wise count rates for Quadrant C Data is divided into 100 sec bins |
 |
 |
| Module-wise count rates for Quadrant D Data is divided into 100 sec bins |
 |
 |
| Parameter | Plot |
|---|---|
| CZT HV Monitor | 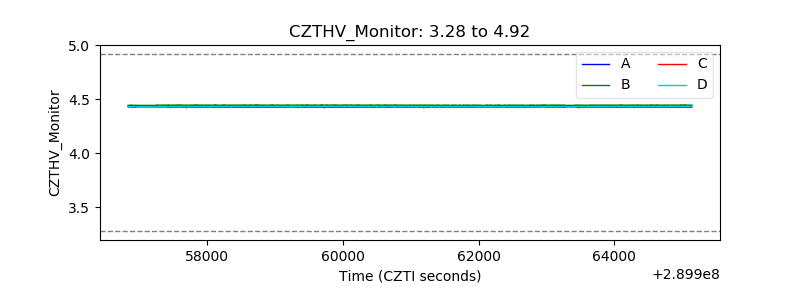 |
| D_VDD | 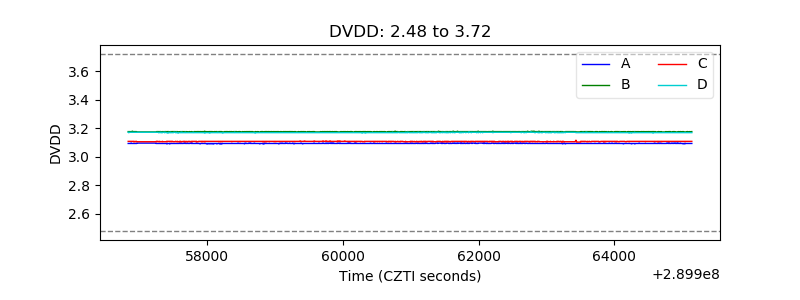 |
| Temperature 1 | 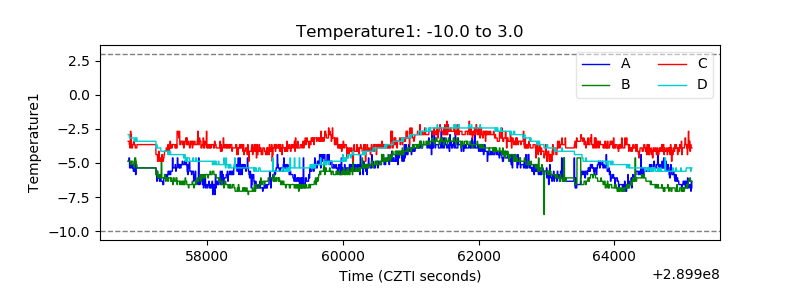 |
| Veto HV Monitor | 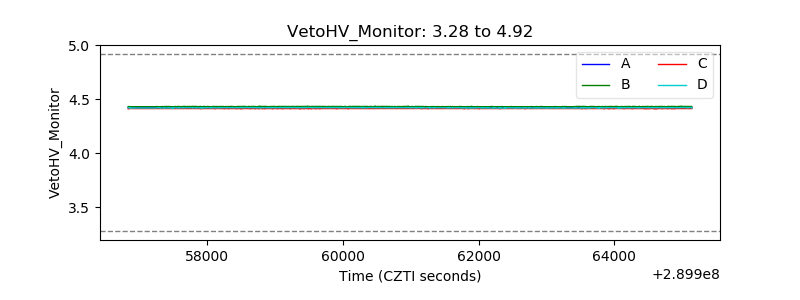 |
| Veto LLD | 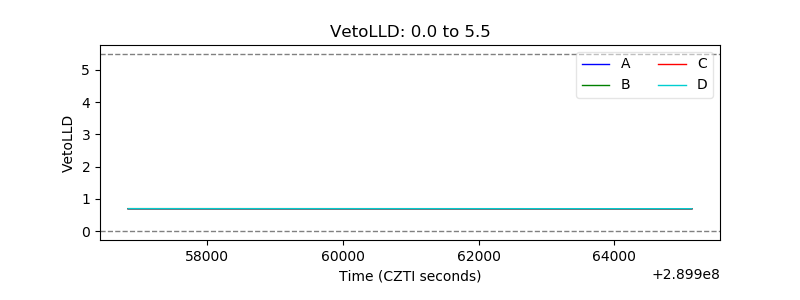 |
| Alpha Counter | 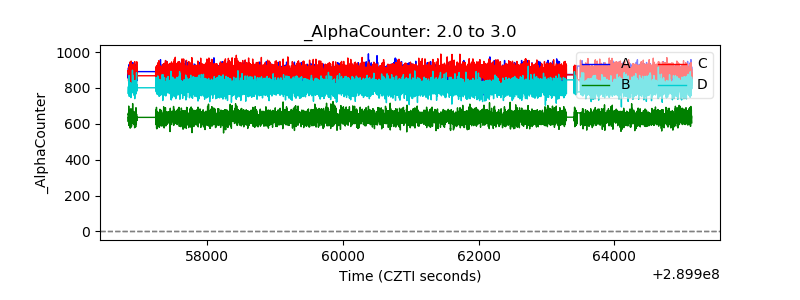 |
| _CPM_Rate | 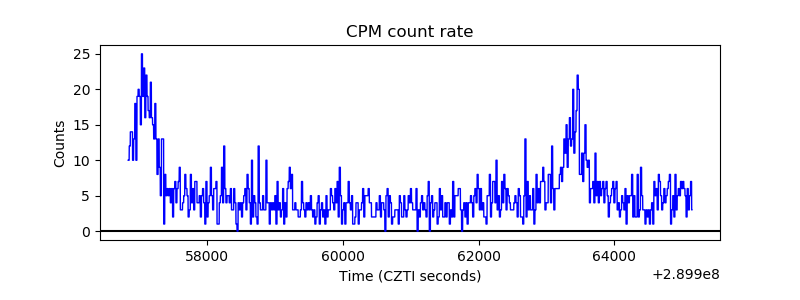 |
| CZT Counter | 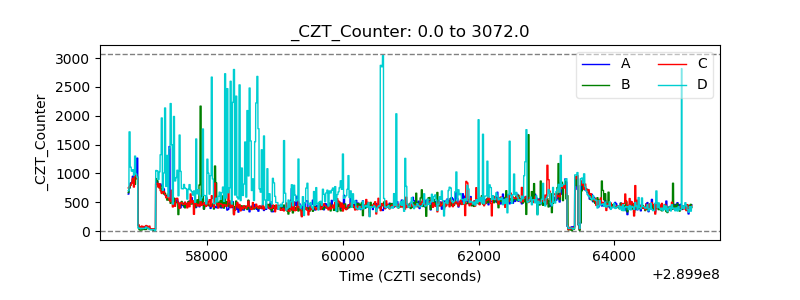 |
| +2.5 Volts monitor |  |
| +5 Volts monitor | 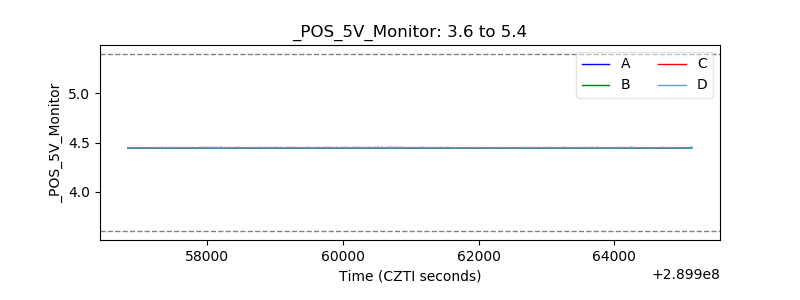 |
| _ROLL_ROT | 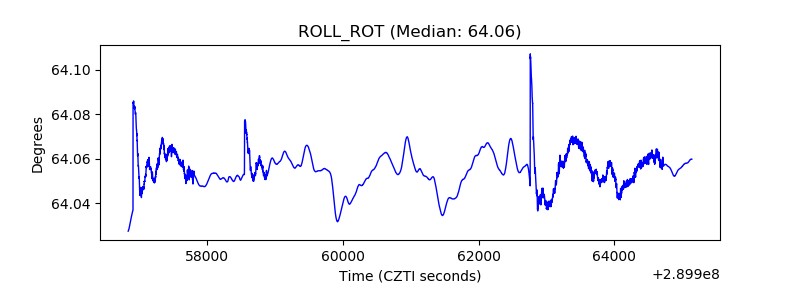 |
| _Roll_DEC | 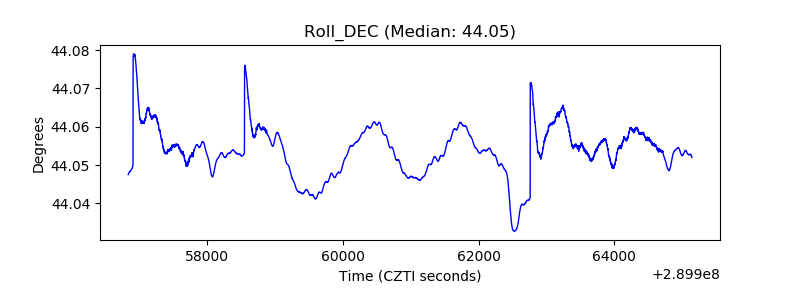 |
| _Roll_RA | 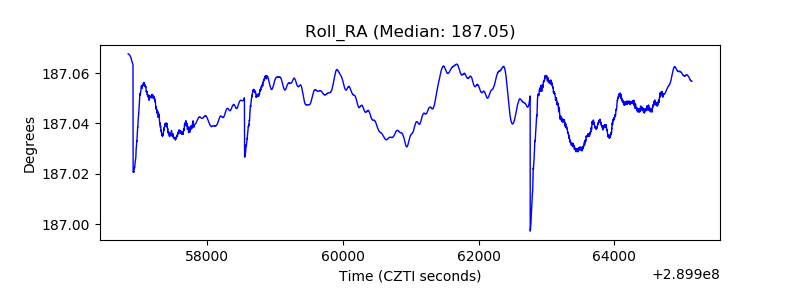 |
| Veto Counter | 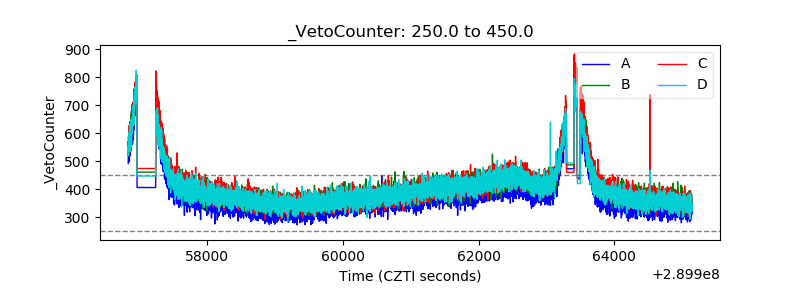 |